


Keltner Channel Trading Strategy: How to Read Volatility With Context


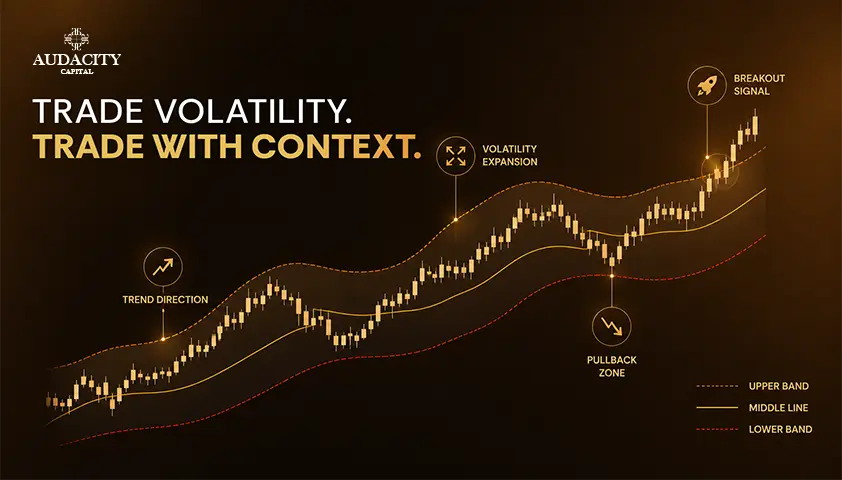
Keltner Channels are volatility-based and are plotted around a moving average. They are used by traders to determine the overall trend, pinpoint volatility expansion or contraction, identify pullbacks within a directional move, and frame potential breakouts when price decisively moves outside the channel.
The point is determining the context: the same band relation can have very different meanings in various market regimes. You will discover how the three lines are built, which settings really do change, and how to use the indicator in trending, compressed and ranging situations.
At the end you will have three different setups, invalidation rules and a testing method you can apply to your own charts.
What Is the Keltner Channel and What Does It Measure?
A modern Keltner Channel employs a centerline moving average, typically the EMA. The upper and lower bands are placed at a fixed multiple of Average True Range above and below it.
The centerline indicates the direction of the price, while the outer bands adapt dynamically to volatility using ATR.
Consider the channel as being divided into three sections. Trend direction is indicated by the centerline, the band width is a measure of the recent volatility, and the price location indicates the strength or stretch. It is not a fixed signal on its own.
This is the important modification that most guides overlook. A move outside the band does not necessarily mean a reversal. When price is trading near or outside the upper or lower band several times in a single trend, it may be a sign of strength and not of exhaustion.
One historical note. Chester Keltner's original calculation in the 1960s was based on simple moving averages and high-low ranges. Modern platforms employ the EMA-plus-ATR version, and this will be the version used throughout this article.
How Is the Keltner Channel Calculated?
The Keltner Channel formula in use today is very simple:
- Middle = EMA(n)
- Upper = EMA(n) + ATR(m) × multiplier
- Lower = EMA(n) − ATR(m) × multiplier
Each input has a specific characteristic effect. A longer EMA will filter the direction of the trend and slow down the response to new moves. A longer ATR will smooth the volatility estimate, and the bands will change more slowly. A bigger multiplier pushes the bands away from price. This yields fewer but more intense interactions.
A common starting point is a 20-period EMA, a 10- or 14-period ATR, and a 2× multiplier. Take this as a starting point, not a universal best setting. The purpose is to gain understanding here, not to do all the calculations by hand.
How to Read Keltner Channels in Different Market Conditions
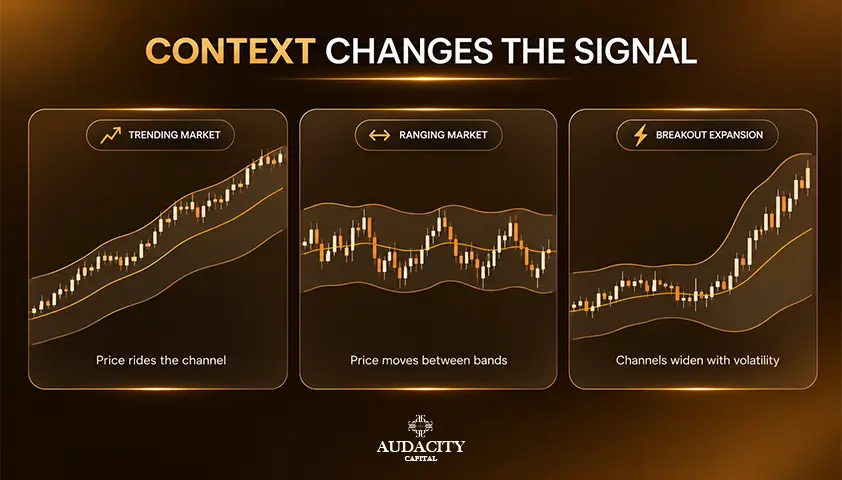
Regime comes first. Before analyzing any band touch, determine which type of market you are in. The same interaction can have different meanings under different circumstances.
1. Trending Market
The channel slopes distinctly in one direction, and the price tends to spend the majority of its time in one half of the channel. When the upper band is repeatedly touched during an uptrend, it is indicative of bullish strength, not overbought.
The mirror applies for downtrends. Typically, fading the outer band here is a battle against the dominant flow.
2. Volatility Contraction
The narrower the bands, the stronger the volatility contraction. Narrowing is a state, not a direction. You do not know which way the price will resolve yet. Wait for the consolidation structure to break and for price to close decisively outside the channel. Use compression as a setup filter, NOT an entry.
3. Range or Weak Trend
The centerline levels out, and the price bounces back and forth. Horizontal support and resistance take precedence over the channel.
Outer-band tests can be used as stretches, but only where the overall structure indicates a range and rejection is evident.
This regime-first approach is what makes disciplined use of Keltner Channels different from the common mix of breakout and reversal rules being applied to the same chart, without context.
Keltner Channel Trading Strategy 1: Trend Pullback
The pullback setup is a natural fit for Keltner Channels, as it is a trend-following channel setup. After a directional trend is in place, the channel offers a repeatable pullback zone and a definite invalidation level.
Long example rules:
- Identify the upward-sloping channel and higher-high, higher-low pattern on your time frame of interest.
- Look for a price pullback towards the centerline or towards the lower half of the channel.
- Ensure that the overall trend pattern remains intact. The previous swing low should not break during the pullback.
- Only enter on a clear bullish sign such as a bullish engulfing at the centerline, reclaim of a short-term high, or a breakdown from the pullback's minor trendline.
- The stop should be set past the invalidating structure, usually below the pullback swing low, but not on a channel line.
The short setup is the opposite: downward-sloping channel, pullback up into the upper half, bearish trigger, stop above the pullback swing high.
Hypothetical example. Imagine an uptrend scenario in which the 20-EMA centerline is rising, and the price has managed to double-touch the lower level of the EMA.
On the third pullback, the price hits the centreline and forms a solid bullish reversal candle which recovers the previous minor high. Enter on the reclaim. Place the stop below the pullback low.
The first target could be the recent swing high. After that, a runner might be trailed behind structure towards a possible upper band retest.
Some of the exit options that might be considered for testing are a prior swing high, retest of the outer band, a fixed R multiple, or a trail behind structure. None of these is a universal solution, and the centerline is not a guaranteed support.
Keltner Channel Trading Strategy 2: Volatility Breakout
The setup starts with the volatility compression and not the breakout candle. A Keltner Channel breakout setup is more powerful if it is preceded by a short-term period of low volatility. The arrangement shows a change from low activity to higher activity.
Workflow:
- Look for a narrowing channel and horizontal consolidation.
- Identify the range by setting specific support and resistance levels.
- Wait for a decisive close outside the channel and outside the range structure, not just an intrabar wick.
- Enter on the close or a controlled retest of the broken level.
- Place invalidation within the range or on the other side of the breakout pattern.
A Keltner Channel breakout plus compression is more significant than a close outside the band in choppy times. The desired volatility expansion you want to trade is the change from quiet to active conditions.
It's the structure that should confirm the transition, and not the band.
Breakouts also fail. Any quick turn-in in the channel, bad follow-through or rejection at the last range marker is true information.
If the price doesn't break outside the channel and structure in a few candles, the expansion has not succeeded. Staying flat is a valid decision.
Filters like volume, RSI, MACD, or ADX can be added, but they are not mandatory. If you use them, try them out individually to determine if they enhance the setup or cause noise.
Keltner Channel Trading Strategy 3: Mean Reversion
Mean reversion is best executed in a true ranging market. The outer band touch can indicate a trend strength in a trend market or a stretch in a flat market. Hence, regime is important here.
Look for these conditions before considering a mean-reversion trade:
- Flat or weakly sloped centerline
- Two-sided rotation over recent sessions
- Identified horizontal resistance and support levels within the range
- No new directional move or news-breakout.
Wait for rejection, not the first touch. A move back into the Keltner Channel is more useful than fading the initial move out of the Keltner Channel. It is best to find a rejection candle at horizontal resistance or support.
Put stops outside of the range extreme or failed rejection structure, not at some arbitrary fixed distance.
Stick to this application. Keltner Channels are not an overbought or oversold oscillator and its interpretation as such on all charts is a popular way to lose money in trends.
What Are the Best Keltner Channel Settings?
There is no universal optimum configuration. Keltner channel settings do not affect the quality of the strategy, rather they adjust how sensitive the tool is.
The key compromises are between speed and noise.
- Shorter EMA and ATR react quicker but with more noisy and more false interactions.
- Too long EMA and ATR smooth the picture but respond to actual changes later.
- A lower multiplier leads to more band interactions.
- A higher multiplier leads to fewer, stronger interactions.
A good testing technique:
- Select one of the baselines, such as 20 EMA, 14 ATR, 2× multiplier.
- State exactly what are the setup rules including entry, invalidation and exit.
- Test under a broad spectrum of conditions to cover trends, ranges and volatility changes.
- Change one variable at a time and record the change.
- Stop once the setup is stable, not when the chart looks perfect in hindsight.
Sensitivity at a glance
Input changed | What becomes more sensitive | Trade-off |
Shorter EMA | Trend direction reads | More whipsaws around the centerline |
Shorter ATR | Band width responsiveness | Bands react to single volatile candles |
Smaller multiplier | Frequency of band touches | More false stretches in trends |
Larger multiplier | Extremity of band touches | Fewer, delayed interactions |
Don't get caught up in optimizing per asset until each and every backtest appears to be a complete success. This is curve fitting and it doesn't last in live conditions.
How to Set Stop Losses and Profit Targets With Keltner Channels
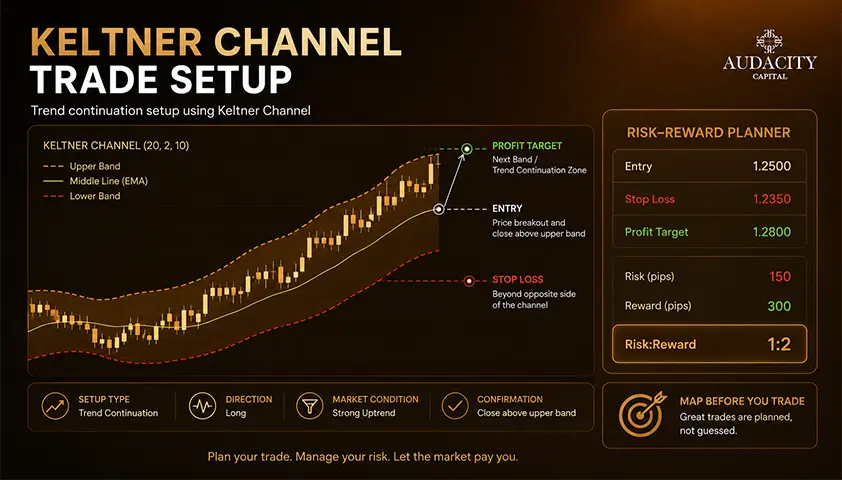
The channel gives you volatility context, but the chart structure should determine the risk level. Begin at the price level that will invalidate the setup and see if the stop distance is within a reasonable distance from the current ATR.
- Pullbacks: Stop sits beyond the pullback swing that would break the trend structure.
- Breakouts: Invalidation is a return through the broken level or back inside the pre-breakout range.
- Ranges: Invalidation is a decisive move outside the range boundary or failure of the rejection candle.
If the stop widens, then position size needs to be adjusted. A volatility-based stop that grows with expansion does not necessarily mean you need to raise your dollar risk. Keep the risk level the same across trades.
Profit management options include a fixed R multiple, prior structural levels, the opposite band as a stretch target, or a trail behind swing structure.
The outer band is a potential reference, not a fixed band. It can trigger trending trades too early or too late, and keep range trades on for too long if used blindly.
Keltner Channels vs Bollinger Bands
The difference between the practical use of Keltner channels and Bollinger bands is their basis for calculation. In modern times Keltner uses ATR around an EMA, while Bollinger uses standard deviation around a moving average.
The most important part is the behavior, not the math. Bollinger Bands are more sensitive to price dispersion changes, and they move rapidly in response to price volatility. ATR based EMA volatility bands will look smoother, because ATR is smoothing the volatility band over the lookback period.
Neither is universally superior. The best one to use is the one that best suits your setup and how you want to measure volatility.
Feature | Keltner Channels | Bollinger Bands |
Calculation basis | ATR around an EMA | Standard deviation around an SMA |
Typical behavior | More steady and constant band width | Sharper, more reactive width changes |
Common use | Trend context, pullback zones, controlled breakouts | Dispersion reads, squeezes, statistical stretches |
Main limitation | Slower to reflect single volatile candles | More whipsaw during sharp, isolated moves |
A brief note on the squeeze concept. A few traders use a combination of Keltner and Bollinger for compression. They are searching for opportunities when Bollinger Bands are trading within Keltner Channels. It's a fair comment, but this article is not about a squeeze system, it's about the channel itself.
For a broader look at how band tools relate to price expansion, see our writing on ATR, volatility, and technical analysis in the Audacity Capital knowledge center.
Common Keltner Channel Trading Mistakes
- Fading every upper-band touch. In an uptrend, repeated upper-band interaction usually reflects strength, not exhaustion.
- Buying every lower-band touch. In a downtrend, that touch is often a continuation, not a bottom.
- Treating a close outside the band as a complete strategy. A closure without compression, structure, or invalidation rules is not a system.
- Ignoring trend structure and market regime. The same signal means different things in different conditions. Regime must lead.
- Over-optimizing EMA, ATR, and multiplier settings. If your rules only work with one exact configuration, they probably will not work forward.
- Using a channel line as the only stop or target rule. Volatility bands inform risk, they do not replace structural risk levels.
One execution reminder. Spreads, slippage, and gaps mean real exits will not always match the levels you see on the chart. Build a small buffer into your planning and expect variance around your levels.
Conclusion
The greatest utility of Keltner Channels comes from reading the volatility and trend first before reading the band touches and breaks. As an ATR channel based on an EMA, Keltner Channels indicate the relationship between the price and recent volatility.
With the addition of market structure, the channel becomes a versatile tool for analyzing support, resistance and volatility rather than being an indicator on its own.
The process is quite straightforward. Pick one calculation. Identify the market regime prior to finding the signal. Specify exact entry and exit rules. Apply consistent risk management to all setups. And then backtest your strategy under varied market conditions before putting real money at risk.
Trading involves substantial risk, and no indicator can predict the market. The purpose is not to predict every market move, but to define rules that can be tested across different conditions.
Frequently Asked Questions
Sustained trading above the upper band usually reflects trend strength, not an automatic reversal signal. In a strong uptrend, price can hug or exceed the upper band across many candles. Treat it as confirmation of momentum. Use structure, not the band itself, to judge when the move is losing energy.
A breakout is directional information, not an overbought reading. A decisive close outside the channel after compression can suggest expansion in that direction. Whether it holds depends on follow-through and structure. A quick reclaim of the channel can invalidate the breakout setup.
A 2× multiplier on a 20-period EMA with ATR around 14 is a common starting point. Smaller multipliers give more frequent band interactions. Larger multipliers give fewer and more extreme touches. There is no universally correct choice, so test one baseline before adjusting.
Yes, the tool works on lower timeframes provided you keep the same regime-first logic. Intraday sessions cycle through trending, compressed, and ranging phases quickly, so context reads matter even more. Set your risk parameters before the session, and do not treat every band touch as an entry.
The bands respond to changes in ATR, which measures recent range. When the average range expands, the bands widen. When range contracts, the bands narrow. That behavior is why compression phases can precede larger directional moves. The direction still needs confirmation.
Adding a separate ATR reading can still be useful because it gives you a numeric volatility value for position sizing and stop distance. The channel visualizes ATR, but a standalone ATR value on the chart makes calculations for lot size and stop placement more precise.
Neither is universally better. The Keltner Channel vs Bollinger Bands decision comes down to how you want volatility represented. ATR-based Keltner bands feel smoother, while standard-deviation Bollinger Bands react more sharply to dispersion changes. Pick the one that suits your setup and test it consistently.

¿Listo para aplicar un riesgo disciplinado a las criptomonedas? Explore los nuevos instrumentos de cripto de Audacity Capital y traiga su estrategia de trading.
Aprender másBoletín
Únase a nuestro boletín para mantenerse al día.
Únete a Nuestra Comunidad Social

Comienza Tu Viaje Hoy Con Nuestra Prueba Gratuita
Muestra con orgullo tus habilidades y logros a través de certificados y obtén reconocimiento por tu arduo trabajo y dedicación de posibles inversores y compañeros.
Prueba GratuitaArtículos Relacionados
Opening Range Breakout Strategy: Rules, Setups and Examples
Learn how the opening range breakout strategy works, including ORB rules, 5, 15 and 30-minute setups, entry signals, stop losses and risk management.


Martingale Strategy in Trading
How the martingale trading strategy works, what the doubling arithmetic actually costs, why position sizing cannot create an edge, and where it is banned.
Inside Bar Trading Strategy: Rules, Entries and Risk Guide
Master the inside bar trading strategy with practical rules for pattern identification, entry triggers, stop placement, risk management, and testing.

Momentum Trading Strategy: A Comprehensive Guide
Master the core principles of a momentum trading strategy. Learn how to use key indicators, manage sharp-reversal risks, and master exit timing.