


Spinning Top Candlestick Pattern: Meaning, Formation & How to Trade



The spinning top candlestick pattern is a single-candle formation that shows indecision between buyers and sellers.
It has a small real body with relatively long upper and lower shadows. During the trading period, price moves both above and below the opening and closing area, but neither buyers nor sellers manage to maintain decisive control by the close.
A spinning top is therefore not inherently bullish or bearish. Its meaning depends heavily on where it appears on the chart, what the preceding trend looks like, and what happens after the candle forms.
A spinning top after a strong uptrend can indicate that buying momentum is losing strength. A spinning top after a downtrend can suggest that selling pressure is weakening. But the candle itself does not confirm a reversal.
Confirmation from subsequent price action and the broader market context is important.
Quick Answer: What Is a Spinning Top Candlestick?
A spinning top candlestick is a single candlestick with:
- A small real body
- A relatively long upper wick
- A relatively long lower wick
- Open and close prices relatively close together
- Significant price movement in both directions during the period
The pattern represents market indecision because buyers pushed prices higher while sellers pushed prices lower, but neither side was able to maintain control by the close.
The candle can close slightly above or below its opening price. Therefore, a green or bullish-colored spinning top is not automatically a bullish signal, and a red or bearish-colored spinning top is not automatically a bearish signal.
What Does a Spinning Top Candlestick Look Like?
The basic structure consists of three components:
1. Small Real Body
The open and close are relatively close together.
This tells you that despite price moving during the session, the market ended relatively close to where it started.
2. Upper Shadow
The upper wick shows that buyers pushed price higher during the session, but the market could not maintain those higher levels.
3. Lower Shadow
The lower wick shows that sellers pushed price lower, but price recovered from those lows before the candle closed.
Together, these features show a market where both sides attempted to control the direction but neither established clear dominance.
Spinning Top Candlestick Formation
A spinning top forms when there is significant price movement in both directions during a trading period, followed by a close relatively close to the opening price.
For example:
- The market opens at a particular price.
- Buyers push the price higher.
- Sellers enter and push the price lower.
- Buyers and sellers continue competing.
- Price eventually closes near the opening level.
The result is a candle with a small body and two relatively long shadows.
The exact proportions do not need to be identical on every chart. The important visual characteristics are the small body and meaningful upper and lower shadows.
What Does a Spinning Top Candlestick Mean?
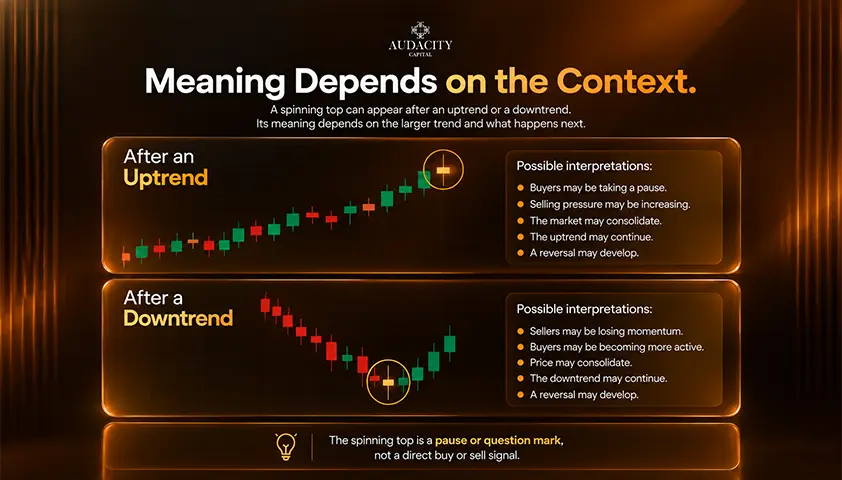
The primary meaning of a spinning top is indecision.
It tells you that the market experienced two-sided price movement but finished without a decisive directional result.
Think of it as a pause or question mark, rather than a direct buy or sell signal.
For example:
Strong uptrend → Spinning Top
Possible interpretations:
- Buyers may be taking a pause.
- Selling pressure may be increasing.
- The market may consolidate.
- The existing trend may continue.
- A reversal may develop.
Strong downtrend → Spinning Top
Possible interpretations:
- Sellers may be losing momentum.
- Buyers may be becoming more active.
- Price may consolidate.
- The downtrend may continue.
- A reversal may develop.
This is why the location of the candle matters more than simply identifying its shape. Zerodha similarly describes the spinning top as an indication of market indecision rather than a standalone entry or exit signal.
Bullish vs Bearish Spinning Top Candlestick
Spinning tops can close either above or below their opening price.
They are sometimes described as bullish or bearish based on candle color, but the distinction should not be overstated.
Type | Candle Close | Common Context | Interpretation |
Bullish spinning top | Close above open | Downtrend/support | Buyers may be gaining interest |
Bearish spinning top | Close below open | Uptrend/resistance | Sellers may be gaining interest |
Neutral spinning top | Open and close very close | Range/consolidation | Market indecision |
The candle color is secondary. The preceding trend, support/resistance, market structure and following candle generally provide more useful information.
Bullish Spinning Top Candlestick
A bullish spinning top generally refers to a spinning top that closes slightly above its opening price or one that appears after a decline and is interpreted in a potentially bullish context.
For example:
Downtrend → Support → Spinning Top → Bullish Confirmation
The spinning top can suggest that sellers are no longer controlling the market as decisively as before.
However, the spinning top itself does not confirm that the market will reverse higher.
A stronger bullish setup could involve:
- Spinning top near established support
- Downtrend losing momentum
- Bullish follow-through candle
- Break above the spinning top's high
- Bullish market structure shift
- Supporting volume or momentum information
The more independent pieces of evidence align, the more informative the pattern may become.
Bearish Spinning Top Candlestick
A bearish spinning top generally refers to a spinning top that closes slightly below its opening price or one that appears after a strong advance and is interpreted in a potentially bearish context.
A common structure is:
Uptrend → Resistance → Spinning Top → Bearish Confirmation
The candle can indicate that buyers pushed price higher but could not maintain those gains.
Potential confirmation could include:
- Spinning top near resistance
- Weakening bullish momentum
- Bearish follow-through candle
- Break below the spinning top's low
- Bearish market structure shift
- Additional technical confluence
Again, the spinning top should be treated as an indication of uncertainty, not an automatic short signal.
Spinning Top Candlestick in an Uptrend
A spinning top appearing during an uptrend can have two broad interpretations.
Scenario 1: Temporary Pause
The market may simply be consolidating before continuing higher.
Uptrend → Spinning Top → Bullish continuation
In this situation, the spinning top represents temporary hesitation rather than a reversal.
Scenario 2: Potential Reversal
The spinning top can also appear when buying momentum is beginning to weaken.
Uptrend → Spinning Top → Bearish confirmation
A subsequent bearish move can provide evidence that the market is transitioning from bullish to bearish conditions.
This is why traders should not automatically interpret every spinning top at the top of a trend as a reversal.
Spinning Top Candlestick in a Downtrend
The same principle applies to a downtrend.
Scenario 1: Continuation
Downtrend → Spinning Top → Bearish continuation
The market pauses before sellers regain control.
Scenario 2: Potential Reversal
Downtrend → Spinning Top → Bullish confirmation
The spinning top may mark a period where selling pressure is weakening before buyers push price higher.
The pattern itself does not determine which outcome will occur.
How to Identify a Spinning Top Candlestick
Use the following checklist:
Step 1: Look for a small body
The opening and closing prices should be relatively close.
Step 2: Look for an upper wick
Price should have moved meaningfully above the body during the period.
Step 3: Look for a lower wick
Price should also have moved meaningfully below the body.
Step 4: Check the surrounding candles
Ask:
- Is the market trending?
- Is it consolidating?
- Has price made a strong move?
- Is the candle near support or resistance?
Step 5: Wait for confirmation
The next candle or subsequent price action can help determine whether the market is continuing or changing direction.
How to Trade the Spinning Top Candlestick Pattern
There is no single universally applicable spinning top trading strategy.
A practical approach is to use the pattern as an early warning signal and combine it with market structure and confirmation.
Step 1: Identify the trend
Determine whether price is:
- Trending higher
- Trending lower
- Moving sideways
Step 2: Locate the spinning top
Mark the candle's:
- High
- Low
- Open
- Close
Step 3: Identify the surrounding level
Look for:
- Support
- Resistance
- Previous swing high
- Previous swing low
- Supply zone
- Demand zone
- Trendline
- Other significant market structure
Step 4: Wait for confirmation
Rather than entering solely because a spinning top has appeared, wait for subsequent price action.
For example:
Potential bullish confirmation:
Price breaks and closes above the spinning top's high.
Potential bearish confirmation:
Price breaks and closes below the spinning top's low.
These are examples of confirmation approaches, not guaranteed signals.
Step 5: Define invalidation
Determine where the trade idea would no longer make sense.
Step 6: Set your risk
Position size should be determined based on your predefined risk rather than simply choosing a fixed number of lots.
Step 7: Define the exit
Before entering, establish how you intend to manage:
- Stop-loss
- Profit target
- Trailing stop
- Partial exits
Spinning Top Candlestick Trading Example
Consider a hypothetical forex market that has been falling for several sessions.
Price approaches an established support area.
A spinning top forms:
- Open: 1.2500
- High: 1.2550
- Low: 1.2440
- Close: 1.2510
The small difference between the open and close indicates that the market finished close to where it started despite moving significantly in both directions.
What does this tell us?
It tells us that:
- Sellers pushed price lower.
- Buyers responded.
- Neither side maintained decisive control.
- The downtrend may be losing momentum.
But it does not tell us that price must reverse higher.
Suppose the next candle closes strongly above the spinning top's high.
That provides additional bullish evidence.
Alternatively, if the next candle breaks below the spinning top's low and continues lower, the market may simply be continuing the existing downtrend.
The reaction after the spinning top is therefore critical.
Spinning Top vs Doji
Spinning tops and doji candles are often confused because both can indicate indecision.
The primary structural difference is the size of the real body.
Feature | Spinning Top | Doji |
Real body | Small but visible | Very small or nearly nonexistent |
Open vs close | Close to each other | Usually extremely close |
Upper wick | Present | May be present |
Lower wick | Present | May be present |
Main message | Indecision | Indecision |
Direction by itself | Neutral | Neutral |
A spinning top has a small real body, whereas a classic doji has an open and close that are virtually identical. StoneX also distinguishes the two primarily by the size of the body.
Spinning Top vs Long-Legged Doji
A long-legged doji can look very similar to a spinning top.
The difference is again the relationship between the opening and closing prices.
Spinning Top
The body is small but visible.
Long-Legged Doji
The open and close are extremely close, resulting in little or no visible body.
Both can indicate significant two-sided movement and uncertainty.
Rather than becoming overly focused on the label, traders should consider the broader chart context.
Spinning Top vs Hammer
A spinning top and hammer can look similar at first glance, but their structures are different.
Spinning Top
- Small body
- Upper wick
- Lower wick
- Two-sided indecision
Hammer
- Small body
- Long lower shadow
- Relatively small upper shadow
- Usually interpreted in the context of a decline
The key distinction is the shape and relative wick structure.
A candle should not be labelled a hammer simply because it has a small body and a lower wick.
Spinning Top vs Shooting Star
A shooting star usually has:
- Small body
- Long upper shadow
- Little lower shadow
- Appearance after an advance
A spinning top has meaningful shadows on both sides.
Therefore:
Spinning Top → two-sided indecision
Shooting Star → stronger rejection of higher prices
The surrounding trend and confirmation still matter for both patterns.
Where Is a Spinning Top Most Useful?
The pattern can appear anywhere on a chart, but context can change its significance.
Near Support
A spinning top can indicate that sellers are struggling to maintain downside pressure.
Near Resistance
A spinning top can indicate that buyers are struggling to maintain upside momentum.
After a Strong Trend
It can indicate a pause or potential loss of momentum.
Inside a Range
It may simply reflect the existing uncertainty of a sideways market.
After a Large Price Move
It can signal that the market is reassessing the previous move.
The pattern therefore becomes more informative when combined with market structure and location, rather than being analysed in isolation.
Spinning Top Candlestick and Support & Resistance
Support and resistance can provide useful context for interpreting a spinning top.
Consider:
Resistance → Uptrend → Spinning Top → Bearish confirmation
The candle suggests that the market is struggling to maintain higher prices at an important level.
Alternatively:
Support → Downtrend → Spinning Top → Bullish confirmation
The candle suggests that selling pressure is being challenged near support.
The level itself does not guarantee a reversal.
The purpose of combining the two concepts is to determine where the market is showing indecision and why that indecision may matter.
Spinning Top Candlestick and Market Structure
Market structure can provide another layer of confirmation.
For example, traders can monitor:
- Higher highs
- Higher lows
- Lower highs
- Lower lows
- Breaks of structure
- Failed breakouts
- Support and resistance
- Swing points
Suppose an uptrend produces a spinning top near a previous swing high.
If price subsequently breaks a key higher low, that provides more information than the spinning top alone.
Likewise, a spinning top during a downtrend becomes more interesting if price subsequently breaks a significant lower high.
Best Timeframe for Spinning Top Candlestick
A spinning top can appear on any timeframe.
However, its usefulness depends on the trading context and the quality of the price data.
You may see spinning tops on:
- 1-minute charts
- 5-minute charts
- 15-minute charts
- 1-hour charts
- 4-hour charts
- Daily charts
- Weekly charts
Lower timeframes generally produce more frequent candles and potentially more noise.
Higher timeframes can provide broader market context, but that does not automatically make every higher-timeframe spinning top a reliable reversal signal.
A practical approach is to analyse the spinning top alongside the timeframe relevant to your trading strategy.
Spinning Top Candlestick in Forex Trading
The spinning top can be used when analysing forex charts.
For example:
EUR/USD
A trader might identify:
- Strong bullish movement
- Price approaching resistance
- Spinning top forms
- Bearish confirmation appears
- Trader evaluates the setup against predefined risk rules
The same pattern can also appear during a downtrend near support.
The important point is that the candle is not forex-specific. It can be used to analyse different financial markets, including stocks, indices, commodities and forex.
Common Mistakes When Trading Spinning Tops
1. Treating Every Spinning Top as a Reversal
A spinning top indicates indecision.
It does not guarantee a trend reversal.
2. Ignoring the Trend
The same candle can mean different things depending on whether the market is trending or ranging.
3. Trading Before Confirmation
Entering immediately after seeing a spinning top can expose a trader to false signals.
4. Focusing Too Much on Candle Color
A green spinning top is not automatically bullish, and a red spinning top is not automatically bearish.
5. Ignoring Support and Resistance
A spinning top near an important level may provide more useful context than one appearing randomly in the middle of a range.
6. Using It as a Standalone Strategy
Candlestick patterns are generally more useful when combined with broader analysis and risk management.
7. Ignoring Position Size
Even a high-conviction setup can produce a loss.
Risk should be defined before entering the trade.
Advantages and Limitations of the Spinning Top Pattern
Advantages
- Easy to identify
- Works across different markets
- Can highlight market indecision
- Can identify potential momentum pauses
- Useful around support and resistance
- Can be combined with other technical analysis tools
- Can be used across different timeframes
Limitations
- Does not provide direction by itself
- Can produce false signals
- Appears frequently in sideways markets
- Does not provide a built-in price target
- Requires contextual analysis
- Confirmation can sometimes occur after part of the move has already happened
This is why the spinning top is better viewed as a contextual price-action signal rather than a complete trading strategy.
Spinning Top Candlestick Checklist

Before acting on a spinning top, ask:
Candle Structure
- Does it have a small real body?
- Are both upper and lower shadows meaningful?
- Are the open and close relatively close?
Market Context
- Is the market trending?
- Is it ranging?
- Has price made a strong move?
- Is the candle near support or resistance?
Confirmation
- What did the next candle do?
- Did price break the spinning top's high or low?
- Is there a market structure shift?
- Are other indicators providing supporting evidence?
Risk
- Where is the setup invalidated?
- How much capital am I willing to risk?
- Is the position size appropriate?
- What is the planned exit?
If several of these questions cannot be answered, the candle may not provide enough information to justify a trade.
Is the Spinning Top Candlestick Pattern Reliable?
A spinning top should not be considered reliable or unreliable in isolation.
Its usefulness depends on:
- Market conditions
- Timeframe
- Location
- Trend
- Volatility
- Support/resistance
- Confirmation
- Trading strategy
- Risk management
Researching a historical pattern can also produce different results depending on the asset, timeframe, market regime and rules used to define the candle.
Therefore, traders should avoid assuming that the spinning top has a fixed win rate across all markets.
Can a Spinning Top Predict a Reversal?
A spinning top can indicate a potential change in momentum, but it cannot predict a reversal with certainty.
For example:
Uptrend → Spinning Top → Bearish continuation
is possible.
So is:
Uptrend → Spinning Top → Bullish continuation
The same applies after a downtrend.
This is why confirmation is so important. Dukascopy's current explanation similarly describes the spinning top as a warning signal rather than an independent trading signal and emphasises the importance of what happens afterward.
Final Thoughts
The spinning top candlestick pattern is best understood as a visual representation of market indecision.
Its small body shows that the opening and closing prices were relatively close, while the upper and lower shadows show that both buyers and sellers moved price significantly during the session.
The most important lesson is that the spinning top itself does not tell you whether to buy or sell.
Instead, look at:
Trend → Location → Market Structure → Confirmation → Risk Management
A spinning top near important support after a sustained decline may tell a different story from the same candle appearing randomly inside a sideways range.
Use the pattern as one part of a broader trading process rather than treating it as a standalone prediction tool.
Frequently Asked Questions
A spinning top is a single candlestick with a small real body and relatively long upper and lower shadows. It generally indicates indecision between buyers and sellers.
Neither. A spinning top is generally considered a neutral pattern. Its interpretation depends on the surrounding trend, market structure and subsequent price action.
It indicates that price moved meaningfully in both directions during the trading period but closed relatively close to its opening price, suggesting uncertainty or balance between buyers and sellers.
It can appear before a potential reversal, particularly after a strong trend, but it is not a guaranteed reversal pattern. Confirmation from subsequent price action is important.
A common approach is to identify the pattern, assess its location and trend, wait for confirmation, define an invalidation level and then apply appropriate position sizing and risk management.
Yes. In an uptrend, it may indicate temporary consolidation or weakening bullish momentum. Further price action is needed to determine which interpretation is more relevant.
Yes. In a downtrend, it may indicate temporary consolidation or weakening selling pressure.
A spinning top has a small but visible real body, while a traditional doji has an open and close that are nearly identical.
Not necessarily. A red spinning top closes below its open, but the color alone does not establish a bearish signal. The surrounding market context is more important.
Not necessarily. A green spinning top closes above its open, but it still primarily represents indecision.
There is no universal best timeframe. The appropriate timeframe depends on the trading strategy. Higher timeframes can provide broader context, while lower timeframes may produce more frequent signals.
Yes. Spinning tops can be analysed on forex charts alongside market structure, support and resistance, trend analysis and other technical tools.
Yes, but traders should account for the additional market noise that can occur on shorter timeframes. The pattern should not be treated as a standalone entry signal.
No. It indicates indecision rather than a guaranteed direction. Subsequent price action is needed to assess whether the market is continuing or changing direction.

¿Listo para aplicar un riesgo disciplinado a las criptomonedas? Explore los nuevos instrumentos de cripto de Audacity Capital y traiga su estrategia de trading.
Aprender másBoletín
Únase a nuestro boletín para mantenerse al día.
Únete a Nuestra Comunidad Social

Comienza Tu Viaje Hoy Con Nuestra Prueba Gratuita
Muestra con orgullo tus habilidades y logros a través de certificados y obtén reconocimiento por tu arduo trabajo y dedicación de posibles inversores y compañeros.
Prueba GratuitaArtículos Relacionados
Double Top Pattern: How to Trade It
Learn how to identify, confirm, and trade a valid double top pattern with precise targets and stops.


Prop Firms That Allow Weekend Holding in 2026 (Compare Firms)
Compare prop firms that allow weekend holding. Explore weekend and overnight rules, news trading, drawdown, markets, profit splits and key restrictions.

Prop Firms With No Minimum Trading Days
Prop firms with no minimum trading days compared, with evaluation rules, payout conditions and who each one suits.

Micro Futures Contracts Explained
What micro futures contracts are, why a smaller size does not mean lower risk, the margin trap that catches small accounts, and what they actually cost.