



RSI Divergence: A Complete Guide to Spotting and Trading Momentum Shifts



Introduction
Price can keep climbing while the energy behind the move quietly drains away. Anyone who has bought a breakout to a fresh high, only to watch the market roll over minutes later, has felt the cost of missing that shift.
RSI divergence is one of the most widely used ways to spot it. When price and the Relative Strength Index stop agreeing with each other, it tells you something about momentum that the candles alone do not. Sometimes it warns that a trend is running out of steam. Other times it confirms that a pullback is just a pause inside a healthy trend.
The catch is that divergence is easy to see and easy to misuse. Plenty of traders spot a divergence, enter immediately, and get run over by a trend that simply keeps going. This guide covers what RSI divergence is, the four main types, how to identify them properly, why they fail, and how to build a structured trade around them with clear confirmation and risk rules.
What Is the RSI?
The Relative Strength Index is a momentum oscillator developed by J. Welles Wilder and introduced in his 1978 book New Concepts in Technical Trading Systems. It measures the speed and size of recent price changes and plots the result on a scale from 0 to 100.
The calculation compares average gains with average losses over a set lookback period:
RSI = 100 − (100 ÷ (1 + RS)), where RS = average gain ÷ average loss
The default setting is 14 periods, which most charting platforms apply automatically. Readings above 70 are traditionally considered overbought, and readings below 30 are considered oversold. The 50 line acts as a midpoint: readings consistently above 50 tend to reflect bullish momentum, and readings below 50 reflect bearish momentum.
One important point before going further: "overbought" does not mean "about to fall", and "oversold" does not mean "about to rise". In a strong trend, RSI can stay above 70 or below 30 for long periods. That is exactly why divergence is often more useful than the raw readings. It focuses on the relationship between price and momentum rather than on a single level.
Check A Complete Guide about RSI Indicator
Read about Best RSI Settings for the 1-Minute Nasdaq 100 Chart
What Is RSI Divergence?
RSI divergence occurs when price and the RSI move in different directions across two comparable swing points.
In a healthy trend, momentum and price tend to move together. When price makes a higher high, RSI usually makes a higher high too. When that relationship breaks, it suggests the move behind the price is weaker (or stronger) than it appears.
Divergence comes in two families:
- Regular divergence: a potential reversal signal. Price pushes to a new extreme, but momentum fails to confirm it.
- Hidden divergence: a potential continuation signal. Price holds its trend structure during a pullback, while momentum resets more deeply.
Each family has a bullish and a bearish version, giving four types in total.
What Are the Four Types of RSI Divergence?

Regular Bullish Divergence
What it looks like: price makes a lower low, while RSI makes a higher low.
What it suggests: sellers managed to push price to a new low, but they did it with less force than before. Downside momentum is fading, and a reversal or meaningful bounce may follow.
Where it matters most: at the end of an extended downtrend, near a higher-timeframe support zone, or after a sharp sell-off into a level where buyers have previously stepped in.
A classic example is a currency pair that drops into a weekly support area, bounces, then breaks slightly lower to a new low during the London session. If RSI prints a noticeably higher low on that second push, the sell-off is losing conviction.
Regular Bearish Divergence
What it looks like: price makes a higher high, while RSI makes a lower high.
What it suggests: buyers pushed price to a new high, but with weaker momentum. The rally is running out of fuel, and a pullback or reversal may be developing.
Where it matters most: after a prolonged uptrend, into a higher-timeframe resistance zone, or at a prior high where stop orders and breakout buyers are likely to be clustered.
Regular bearish divergence is one of the most common signals traders look for on indices and gold after long rallies, because those markets often grind higher on thinning momentum before correcting.
Hidden Bullish Divergence
What it looks like: price makes a higher low, while RSI makes a lower low.
What it suggests: the uptrend is intact. Price is respecting its structure by holding above the previous low, yet the pullback has pushed momentum to a deeper reading. That reset often gives the trend room to resume.
Where it matters most: during pullbacks inside an established uptrend, particularly into a discount area, a previous breakout level or a moving average the market has respected.
Hidden divergence is underused by many retail traders, partly because it is less intuitive. It is worth learning, though, because trading in the direction of the trend generally carries better odds than calling tops and bottoms.
Hidden Bearish Divergence
What it looks like: price makes a lower high, while RSI makes a higher high.
What it suggests: the downtrend is intact. The rally has stalled below the previous high, even though momentum bounced more strongly. Sellers are likely to regain control.
Where it matters most: during retracements inside an established downtrend, especially into a premium zone, a broken support level now acting as resistance, or a supply area.
A simple way to remember the difference: regular divergence compares the extremes (highs in an uptrend, lows in a downtrend), while hidden divergence compares the pullbacks (lows in an uptrend, highs in a downtrend).
RSI divergence type | Price action | RSI movement | Potential signal |
|---|---|---|---|
Regular bullish | Lower low | Higher low | Potential bullish reversal |
Regular bearish | Higher high | Lower high | Potential bearish reversal |
Hidden bullish | Higher low | Lower low | Potential bullish continuation |
Hidden bearish | Lower high | Higher high | Potential bearish continuation |
How to Identify Divergence Correctly
Many false divergence signals come from poor identification rather than from the concept itself. A few rules keep your analysis honest:
1. Compare swing points, not random candles. Divergence should be drawn between clear swing highs or swing lows on price, matched with the corresponding peaks or troughs on RSI. If you have to squint to find the swing, it probably is not one.
2. Keep the points vertically aligned. The RSI peak or trough you use should sit directly beneath (or very close to) the price swing you are comparing. Connecting a price high to an RSI peak several candles away creates divergences that do not really exist.
3. Compare like with like. Highs connect to highs, lows connect to lows. For bearish setups, you look at the tops. For bullish setups, you look at the bottoms.
4. Use reasonably recent swings. Comparing two highs that are dozens of candles apart weakens the signal. As a rough guide, many traders look for swings within about 5 to 30 candles of each other on their chosen timeframe.
5. Check the slope. Draw a line across the two price swings and another across the two RSI swings. If the lines clearly point in opposite directions, you have divergence. If they are nearly parallel, you probably do not.
6. Wait for the second swing to complete. A divergence is only confirmed once the second swing has formed. Until price actually turns, the "lower high" on RSI can still become a higher high as the candle develops.
Why Divergence Fails (and How to Filter It)
Divergence is a warning, not a trigger. Here are the main reasons it fails:
Strong trends override momentum signals. In a powerful trend driven by a central bank decision or a major data release, price can print divergence after divergence while continuing in the same direction. Fading a trend like that on divergence alone is one of the quickest ways to rack up losses.
Multiple divergences. Sometimes you will see a second or even third divergence form before price finally turns. If you entered on the first, you may have been stopped out twice before the actual reversal.
Low-volatility conditions. During quiet sessions, such as the late New York afternoon or the Asian session on pairs that are not active then, RSI can drift and create shallow divergences that carry little meaning.
Lower-timeframe noise. Divergence on a one-minute chart appears constantly. Most of it is noise.
The filters that help most are context and confirmation: trade divergence at meaningful levels, in line with higher-timeframe structure where possible, and only once price itself shows evidence of turning.
Confirmation: Turning Divergence Into a Trade Setup
A divergence tells you to pay attention. Confirmation tells you when to act. Common confirmation tools include:
Market structure shift. For a bearish divergence, wait for price to break below the most recent higher low on your entry timeframe. For a bullish divergence, wait for a break above the most recent lower high. This is often the single most reliable filter, because it proves that the other side of the market has actually stepped in.
Trendline break. A break of a short-term trendline connecting the swings that formed the divergence can act as an early trigger.
Candlestick reaction. Engulfing candles, pin bars and strong rejection wicks at the second swing point add weight to the signal, particularly at key levels.
RSI crossing 50. Some traders wait for RSI to cross back through the 50 line in the direction of the expected move as a momentum confirmation.
Location. A divergence at a higher-timeframe support or resistance zone, a round number, or a previous day's high or low is far more meaningful than one in the middle of a range.
You do not need all of these. Pick one or two that suit your style and apply them consistently.
Using Multiple Timeframes
Divergence becomes far more useful when you frame it across timeframes.
A practical approach is:
- Higher timeframe (daily or 4-hour): identify the overall direction and key zones. Is the market trending, ranging, or extended into a major level?
- Setup timeframe (1-hour or 4-hour): look for divergence forming at those key zones.
- Entry timeframe (15-minute or 5-minute): wait for confirmation, such as a structure break, before entering.
When a 4-hour regular bearish divergence forms at a daily resistance zone, and the 15-minute chart then breaks structure to the downside, you have alignment across three timeframes. That stacked context is what separates a considered trade from a guess.
Combining RSI Divergence With Liquidity and Market Structure

For traders who use smart money concepts, RSI divergence pairs naturally with liquidity sweeps.
Consider a common pattern: price runs above a prior swing high, taking out the buy stops resting above it. That sweep produces a new higher high on the chart. If RSI prints a lower high at the same moment, you have regular bearish divergence forming exactly where liquidity has just been collected. When price then drops back below the swept high and breaks short-term structure, the sequence often signals that the move higher was a stop run rather than genuine buying strength.
The same applies in reverse for bullish setups: a sweep of sell-side liquidity below an equal low, a higher low on RSI, then a market structure shift upward.
Divergence on its own says "momentum is weakening". A liquidity sweep plus a structure shift explains why, and gives you a defined level for your stop.
Risk Management for Divergence Trades
Because divergence trades often lean against the recent move, risk control is essential.
Place stops beyond the divergence extreme. For a bearish setup, the stop typically goes above the higher high that formed the divergence, with a small buffer for spread and volatility. For a bullish setup, it goes below the lower low. If price breaks that extreme, the idea behind the trade is invalidated.
Define risk per trade in advance. Many traders risk between 0.5% and 1% of their account on a single position. This keeps a run of failed divergences survivable.
Target logical levels. Previous swing points, the opposite side of a range, or areas of resting liquidity make sensible targets. Aim for a reward-to-risk ratio of at least 2:1 so the strategy can be profitable even with a modest win rate.
Manage partials and break-even thoughtfully. Some traders take partial profits at the first target and move their stop to break-even. Others prefer to let the full position run. Either works if applied consistently.
Be wary around high-impact news. A divergence that forms an hour before a central bank rate decision or a major employment report carries extra risk, because the release can override any technical signal.
Common Mistakes to Avoid
- Entering as soon as divergence appears. Without confirmation, you are guessing where the turn will happen.
- Fighting strong trends with regular divergence. In a clear trend, hidden divergence in the trend's direction is usually the better trade.
- Drawing divergence between poorly matched points. Misaligned swings produce false signals.
- Relying on very low timeframes. The lower you go, the more noise you see.
- Ignoring location. Divergence in the middle of nowhere rarely matters.
- Tweaking RSI settings to force a signal. If you need to change the period to make a divergence appear, it is not there.
- Using wide or undefined stops. The divergence extreme gives you a natural invalidation point. Use it.
Worked Example: Bearish Divergence on GBP/USD
The figures below are illustrative and are used only to demonstrate the process.
Context. GBP/USD has rallied steadily for two weeks and is approaching a daily resistance zone around 1.2780 to 1.2800, an area where price reversed sharply several months earlier.
The divergence. On the 4-hour chart, price prints a swing high at 1.2740, with RSI peaking at 76. Price pulls back to 1.2690, then rallies again during the London session and pushes to a new high at 1.2785, briefly clearing the previous high and the buy stops above it. On this second high, RSI peaks at only 64. Price has made a higher high, RSI has made a lower high: a regular bearish divergence, forming inside daily resistance and immediately after a liquidity sweep.
Confirmation. Rather than selling straight away, the trader drops to the 15-minute chart. As the New York session opens, price falls back below 1.2740 and breaks the most recent higher low at 1.2722. That market structure shift is the trigger.
Entry. The trader places a sell limit on the retracement into the area where the breakdown began, at 1.2748.
Stop loss. Above the divergence high with a small buffer, at 1.2795. That is a risk of 47 pips.
Target. The previous 4-hour swing low that started the final leg up sits at 1.2620. That is a potential reward of 128 pips, giving a reward-to-risk ratio of roughly 2.7:1.
Position sizing. On a 100,000accountrisking1%(1,000), with a pip value of about $10 per standard lot on GBP/USD:
$1,000 ÷ (47 pips × $10) ≈ 2.12 standard lots
Outcome scenarios.
- If the target is reached: roughly 128 pips × $21.20 per pip ≈ $2,714 profit.
- If the stop is hit: a loss of roughly $1,000, which is the pre-defined 1% risk.
The example shows how the pieces fit together: context (daily resistance), signal (bearish divergence), trigger (liquidity sweep and structure shift), defined invalidation (above the high) and a logical target. The divergence alone did not justify the trade. The combination did.
Key Takeaways
- RSI divergence occurs when price and the RSI disagree across two comparable swing points, revealing a shift in momentum.
- Regular divergence suggests possible reversals; hidden divergence suggests possible trend continuation.
- Always compare clear, vertically aligned swing points, and connect highs to highs and lows to lows.
- Divergence is a warning, not an entry signal. Wait for confirmation, such as a market structure shift.
- Location matters. Divergence at higher-timeframe levels and after liquidity sweeps carries far more weight.
- Strong trends can produce several divergences before turning, so avoid fading momentum blindly.
- Place stops beyond the divergence extreme, size positions to a fixed percentage risk, and target logical levels with at least a 2:1 reward-to-risk ratio.
Related Articles
SMT Divergence in Trading: Bullish and Bearish Examples
Frequently Asked Questions
The default 14-period setting is the most widely used and works well for most traders. Shorter settings produce more signals but more noise, while longer settings produce fewer, slower signals. Consistency matters more than finding a "perfect" number.
Divergence on the 1-hour, 4-hour and daily charts tends to be more reliable than on very low timeframes. Many traders spot divergence on a higher timeframe and use a lower one for entry confirmation.
Not really. Used alone, divergence produces many premature signals, particularly in strong trends. It works best when combined with key levels, market structure and a clear confirmation trigger.
Yes. The concept applies to any liquid market with clear swings. Markets with strong trending behaviour, such as gold and major indices, may produce more failed regular divergences during powerful moves, so hidden divergence and confirmation become even more important there.
Regular divergence compares the extremes of a move (new highs or new lows) and points to a possible reversal. Hidden divergence compares the pullbacks within a trend and points to possible continuation.
Yes. MACD, the Stochastic oscillator and other momentum indicators can all show divergence. The principles of identification and confirmation remain the same, whichever tool you use.

Prêt à appliquer un risque discipliné aux cryptos ? Explorez les nouveaux instruments crypto d'Audacity Capital et apportez votre stratégie de trading.
En savoir plusNewsletter
Rejoignez notre newsletter pour rester informé.
Rejoignez Notre Communauté Sociale

Commencez Votre Voyage Aujourd'hui Avec Notre Essai Gratuit
Affichez fièrement vos compétences et réalisations grâce à des certificats et obtenez la reconnaissance de votre travail acharné et de votre dévouement auprès d'investisseurs potentiels et de pairs.
Essai GratuitArticles Connexes

Market Profile Trading: How to Read TPO Charts
Learn Market Profile Trading with TPO charts, value area, POC, initial balance, day types, practical examples, and risk controls.

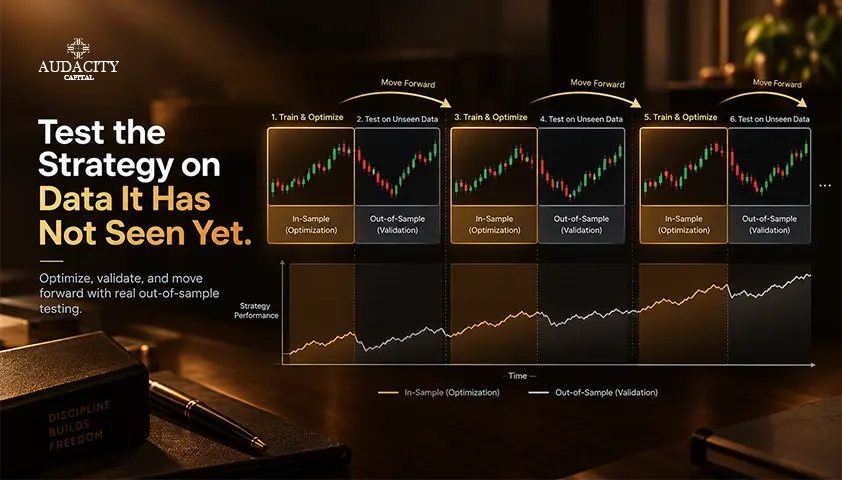
Walk-Forward Analysis in Trading: A Practical Guide
Learn how walk-forward analysis works in trading: in-sample and out-of-sample windows, rolling vs anchored designs, a worked example, and how to read results.
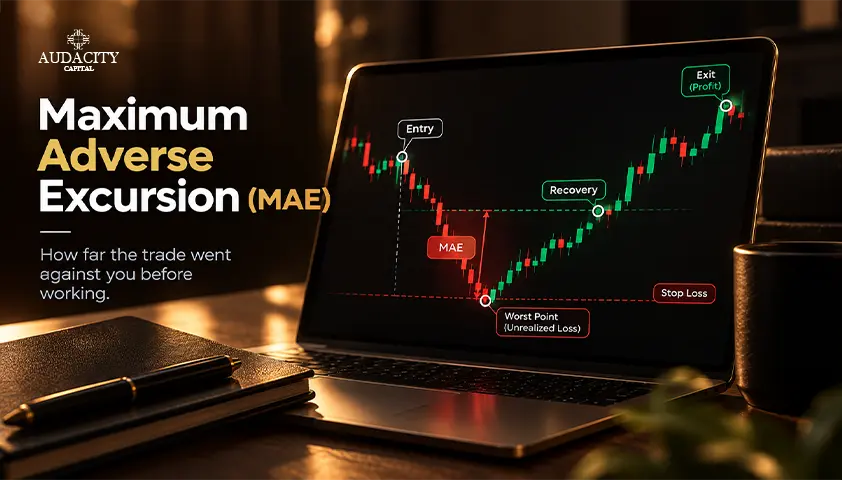
Maximum Adverse Excursion Explained for Traders
Learn how maximum adverse excursion measures a trade's worst open loss, how to calculate MAE, read charts, test stops, and avoid common errors.
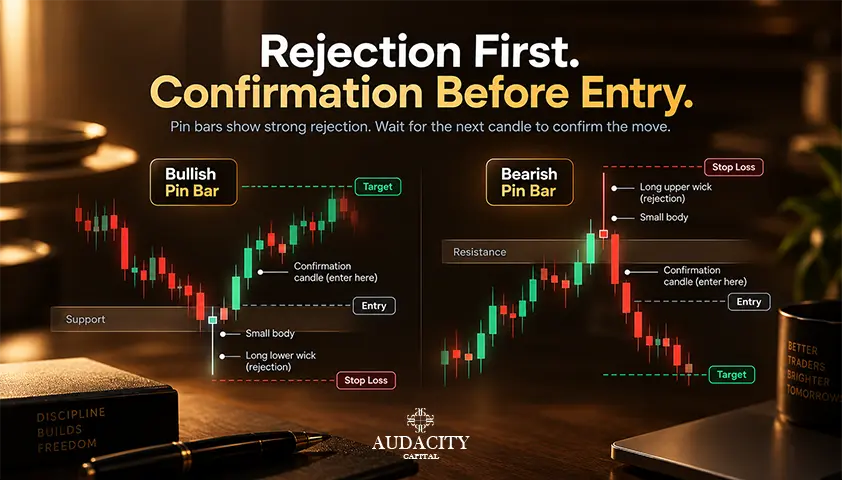
Pin Bar Candlestick: How to Identify and Trade It
What a pin bar candlestick is, how it differs from a hammer, the two entry methods compared, and why location does most of the work.