


SMT Divergence in Trading: Bullish and Bearish Examples


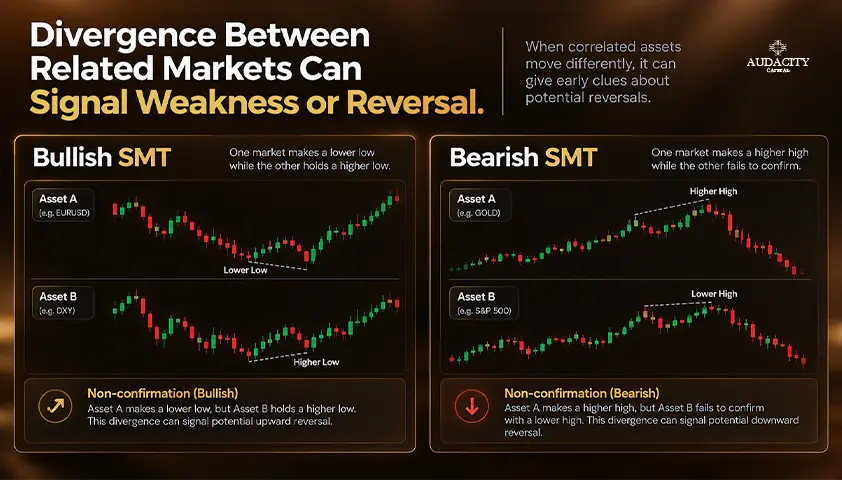
You are watching two markets that usually move together. One pushes to a fresh low, and the other refuses to follow. That mismatch has a name: SMT divergence. Traders use it as context for a possible shift in direction, not as proof that price must reverse.
This guide covers the definition, bullish and bearish patterns, a repeatable identification process, one hypothetical trade, and the most common failure points.
What Is SMT Divergence
SMT divergence is a price-structure mismatch between two historically related instruments viewed on the same timeframe and over a comparable market window.
In positively correlated markets, it appears when one instrument makes a new swing high or swing low while the other fails to confirm that new extreme.
The term comes from the ICT and Smart Money Concepts community. Many trading sources expand SMT as Smart Money Technique, while others use Smart Money Tool. Neither expansion is universally standardized.
That is why this guide focuses on the observable pattern rather than the acronym. Whether you call it ICT SMT divergence or Smart Money Technique divergence, you are looking at the same thing: two related charts that disagree at an extreme.
A divergence also has clear limits. It does not reveal who traded, why the mismatch happened, or whether the next move will reverse. It is a setup condition. A complete approach still needs context, confirmation, entry, exit, and position-sizing rules.
How SMT Divergence Works
1. Start With the Relationship
Positive correlation means two instruments have tended to move in the same direction over a defined window. It does not mean they always move together.
Correlation can weaken, reverse, or break during news events, sector rotation, and changing market regimes. If you need a refresher on how these relationships are measured, read our guide to forex correlation basics.
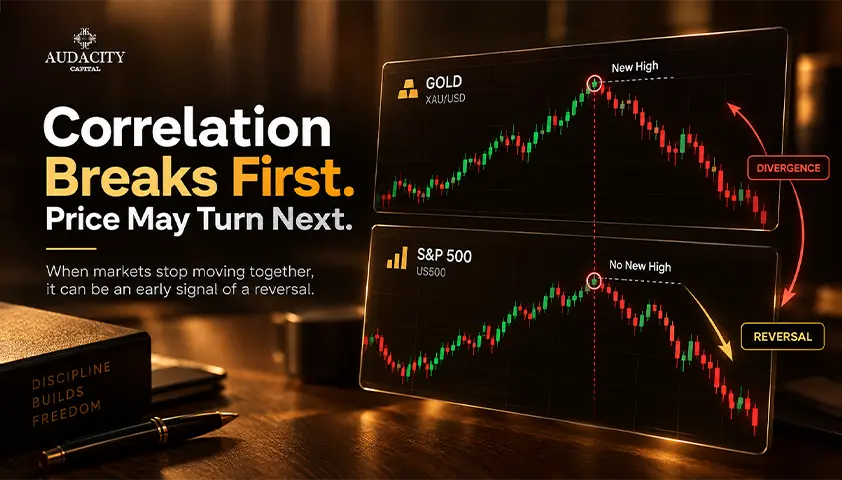
2. Look for Non-Confirmation
The core of SMT trading is comparing like with like. Both charts need the same timeframe, an aligned clock, the same session segment, and an equivalent swing window.
If Instrument A trades above its prior swing high while Instrument B stays below its comparable prior swing high, the new high is not confirmed across the pair. That failure to confirm is the divergence.
3. Interpret It Carefully
The mismatch suggests that strength or weakness is uneven across the pair. It may support a reversal idea, a pullback idea, or no trade at all. The later price response determines whether the observation becomes useful.
4. A Note on Inverse Pairs
Negatively correlated markets require inverse logic. When one makes a new high, you would expect the other to make a new low. A divergence appears when that expected opposite extreme fails to print.
This is easier to misread, so document the expected relationship before marking any signal.
Note: The examples in this guide use positively correlated markets to keep the logic clear.
Bullish vs Bearish SMT Divergence
Both definitions below use positively correlated instruments. The labels bullish and bearish describe the expected direction after the non-confirmation, not the direction of the two swings being compared.
Bullish SMT Divergence
A bullish SMT divergence forms at comparable lows. Instrument A makes a lower low, while Instrument B holds above its prior low or prints a higher low. Traders read the failure to confirm downside as a possible weakening of the selloff. A later trigger is still required before considering a long entry.
Bearish SMT Divergence
A bearish SMT divergence forms at comparable highs. Instrument A makes a higher high, while Instrument B stays below its prior high or prints a lower high. Traders read the failure to confirm upside as a possible weakening of the rally. Again, a later trigger is required before considering a short entry.
Type | Instrument A | Instrument B | Possible reading | Still needed |
Bullish SMT | Makes a new extreme: a lower low | Failed confirmation: holds above its comparable low | Downside is not confirmed across the pair | Bullish price response and entry rule |
Bearish SMT | Makes a new extreme: a higher high | Failed confirmation: holds below its comparable high | Upside is not confirmed across the pair | Bearish price response and entry rule |
Wick or Close: Decide in Advance
Precision matters here. A wick beyond the prior level can count as a new extreme only if you chose that rule before the signal appeared. Do not switch between wick-based and closing-price definitions after seeing the result. That habit makes every chart look like a clean example and every test look better than it is.
SMT Divergence vs Classic Divergence
A common source of confusion is how this pattern relates to RSI or MACD divergence. Classic oscillator divergence compares one instrument with a momentum indicator calculated from that same instrument. SMT divergence compares the price structure of two different instruments. The closer traditional idea is intermarket non-confirmation, where related markets fail to agree on a new extreme.
Method | What is compared | Observation | Main limit |
SMT divergence | Price swings in two related instruments | One market fails to confirm a new extreme | The relationship can change |
Oscillator divergence | Price and an indicator on one instrument | Price and calculated momentum move differently | Indicator settings change the signal |
Correlation reading | Returns from two instruments over a window | Measures the direction and strength of co-movement | Correlation is not causation or a trade trigger |
The two divergence types can appear on the same chart at the same time. They remain separate observations and should be tested separately.
How to Identify SMT Divergence Step by Step
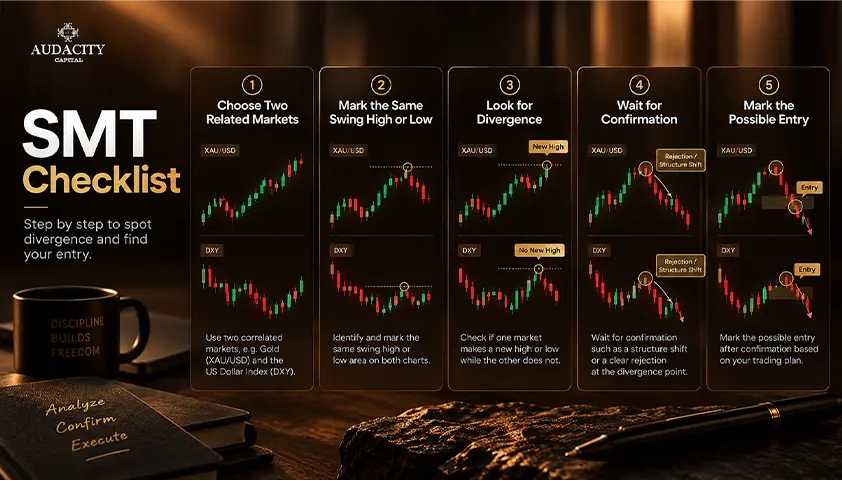
This process turns a visual impression into something you can record and review.
Step 1: Choose the Pair
Start with instruments that have shown a meaningful historical relationship. Write down the pair, the expected direction of correlation, and the lookback window you checked. Do not pick the comparison market after seeing which one creates a cleaner signal.
Step 2: Align the Charts
Use the same timeframe, time zone, and market window on both charts. Align regular and extended sessions. For futures, use comparable contracts and note your continuous-contract method, since a futures roll can shift historical prices. For forex and crypto, note the broker or venue data feed.
Step 3: Fix the Swing Rule
Define a valid swing before reviewing any setup. One example is a pivot with a set number of bars on each side. Compare swings created during the same move or session phase, not unrelated highs and lows.
Step 4: Mark the Non-Confirmation
At highs, check whether one market makes a higher high while the other fails. At lows, check whether one makes a lower low while the other fails. Record which instrument created the new extreme.
Step 5: Wait for a Response
Look for your preselected confirmation, such as a close back through the swept level, a market structure shift, or displacement. The divergence is the context. The response is the confirmation.
Step 6: Define the Trade
Write down the entry, invalidation, stop, target, and maximum planned loss before entering. If you cannot state those rules clearly, you do not have a complete setup.
How to Trade SMT Divergence With Confirmation
Knowing how to trade SMT divergence means keeping each part of the process separate. A mismatch on the chart is only the first layer of an SMT divergence strategy.
The Signal
The signal is the cross-market mismatch. It answers one question: did related markets confirm the same new extreme?
The Location
Give the pattern context at a planned area, such as a prior session high or low, a defined support or resistance level, or a liquidity level. Avoid marking every small mismatch in the middle of a range.
The Confirmation
Use one testable response rule. Examples include a close back inside the prior range, a break of a defined short-term swing, or displacement away from the extreme. Some traders also watch for a Fair Value Gap left by that displacement as added confluence.
Entry and Invalidation
Specify whether entry happens at the confirmation close, on a retracement, or with a stop order. Place invalidation where the original idea no longer holds. Do not move it because the trade is losing.
Target and Size
Choose the target from structure or from a fixed, tested rule. Calculate position size from stop distance and acceptable account risk. Order type, spread, slippage, and gaps can all change the realized result.
SMT Divergence Trading Example
This walkthrough is hypothetical and uses two positively correlated instruments, labeled A and B.
The Setup
Both instruments approach their prior session lows. Instrument A has a prior low at 99.30 and trades down to 99.20. Instrument B has a comparable prior low at 201.00 but holds at 201.10. Only A makes a lower low, so this is a possible bullish SMT divergence.
The Trigger
Instrument A closes back above 99.30, then breaks a preselected short-term lower high. For this illustration, entry is at 99.40, the stop is at 99.10, and the target is 100.00. Risk is 0.30 and potential gain is 0.60, or 2R before costs. R refers to the amount risked on the trade.
Two Possible Outcomes
Item | Target reached first | Stop reached first |
Entry | 99.40 | 99.40 |
Planned stop | 99.10 | 99.10 |
Planned target | 100.00 | 100.00 |
Illustrative exit | 100.00 | 99.10 |
Gross result | +2R | -1R |
This example excludes spread, commissions, and slippage, and it assumes fills at the prices shown. The same valid pattern can lose. Of all the SMT divergence examples you study, the losing ones teach just as much as the winners.
Best Markets, Pairs and Timeframes for SMT Divergence
1. Commonly Watched Pairs
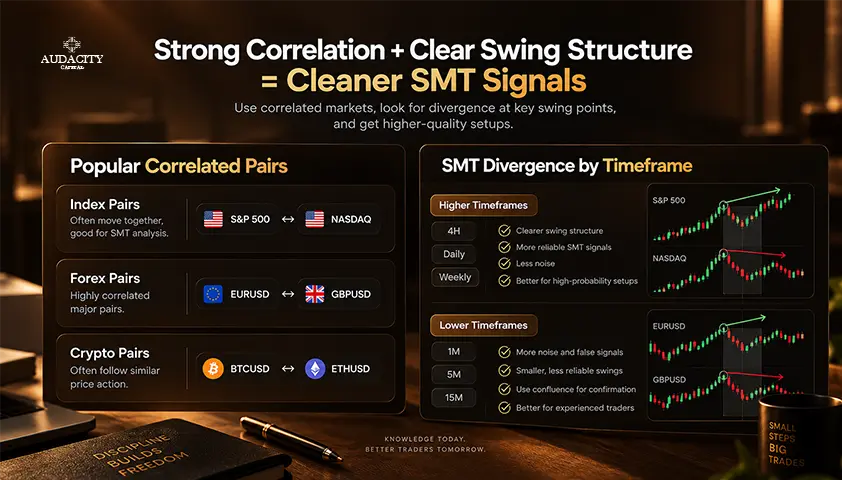
Traders often compare EUR/USD with GBP/USD, equity index futures such as ES with NQ or YM, and BTC with ETH. Treat these as commonly watched examples, not permanently correlated or universally best pairs. Verify the current relationship yourself, using data you can trade or accurately observe.
2. Timeframes
No timeframe is objectively best. Lower timeframes produce more signals and more noise. Higher timeframes produce fewer signals and wider stops. Your analysis timeframe, confirmation timeframe, and holding period should all fit one tested plan.
3. Alignment Warning
Compare the same sessions and equivalent data. Cash indices, index futures, and exchange-traded products can have different trading hours. Futures rolls, forex broker feeds, and crypto venues can each produce different highs and lows on what looks like the same market.
Common SMT Divergence Mistakes and Risks
Mistake #1: Assuming the relationship still exists: Traders often compare instruments because they are popular together, without checking whether the relationship holds over the chosen window.
Mistake #2: Matching the wrong swings. Unrelated swings, different sessions, or mismatched time zones create false signals. Both extremes must belong to the same market move.
Mistake #3: Treating every mismatch as a reversal. News, sector concentration, contract rolls, and asset-specific flows can make a divergence persist for longer than expected.
Mistake #4: Reading intent into the chart. A divergence is not proof of manipulation or institutional activity. A chart shows prices, not participant identity or motive.
Mistake #5: Changing rules after the fact. Switching the pair, timeframe, swing rule, or confirmation after seeing the outcome creates hindsight bias and an untestable method.
Even a correctly identified setup can fail or gap through a stop. Position size, total correlated exposure, costs, and a predefined loss limit still control account risk.
Conclusion
SMT divergence is a non-confirmation clue, not a prediction. Its value depends on the rules you build around it. Choose one pair, one session, one swing rule, and one confirmation rule.
Then collect every signal in replay or simulation, including backtesting and out-of-sample testing, before risking capital.
Frequently Asked Questions
Smart Money Technique is the most common expansion in trading guides, although Smart Money Tool also appears. The terminology is not fully standardized. In practice, SMT describes cross-market non-confirmation, where related instruments fail to agree on the same new high or low.
It can support a reversal idea, but it does not guarantee one. It shows only that related instruments did not confirm the same extreme. Before trading it, you still need a planned location, a defined price response, and clear entry and invalidation rules.
There is no permanent best pair. Traders often compare major forex pairs with shared drivers, related equity indices, or large crypto assets. Verify the current relationship, align sessions and data feeds, and test the exact pair before using it in live decisions.
No. SMT compares price swings in two related instruments. RSI divergence compares price with a momentum calculation derived from a single instrument. The two can appear at the same time, but they are different observations and should be tested separately.

Prêt à appliquer un risque discipliné aux cryptos ? Explorez les nouveaux instruments crypto d'Audacity Capital et apportez votre stratégie de trading.
En savoir plusNewsletter
Rejoignez notre newsletter pour rester informé.
Rejoignez Notre Communauté Sociale

Commencez Votre Voyage Aujourd'hui Avec Notre Essai Gratuit
Affichez fièrement vos compétences et réalisations grâce à des certificats et obtenez la reconnaissance de votre travail acharné et de votre dévouement auprès d'investisseurs potentiels et de pairs.
Essai GratuitArticles Connexes
Turtle Soup Trading: Rules, Examples and ICT Variations
Learn turtle soup trading with original rules, ICT variations, bullish and bearish examples, risk controls, and a practical backtesting checklist.


GTC in Trading: What Good Till Cancelled Orders Mean and How to Use Them Properly
Learn what GTC means in trading, how Good Till Cancelled orders work, when to use them, and the risks of leaving pending orders active.

Market Profile Trading: How to Read TPO Charts
Learn Market Profile Trading with TPO charts, value area, POC, initial balance, day types, practical examples, and risk controls.
Cup and Handle Pattern: Criteria, Entry and Real Data
The cup and handle pattern explained: the criteria sources disagree on, how to trade it, and what the performance data actually says.