


Stock Drawdown: Meaning, Calculation & How It Works


Introduction
Stock markets can experience significant price fluctuations, and understanding how much an investment or portfolio declines from its previous peak is an important part of managing risk. Stock drawdown provides a way to measure this decline and assess the potential downside during a period of market weakness.
In this guide, we’ll explain what stock drawdown is, how it is calculated, why it matters in trading, and how historical market drawdowns can affect traders and investors.
Key Highlights
- Stock drawdown measures the percentage decline from an investment or portfolio's peak value to its subsequent trough before reaching a new peak.
- Drawdowns can result from market volatility, large losses, overleveraging, poor risk management, or changing market conditions.
- Understanding drawdown can help traders assess downside risk and capital preservation during periods of declining prices.
- Traders can manage drawdown through appropriate position sizing, stop-loss strategies, diversification, and disciplined risk management.
What Is a Stock Drawdown?
A drawdown refers to a phase in the stock markets that represents the highest potential for loss in the value of a portfolio or investment. A stock drawdown, on the other hand, refers to the difference between the peaks in the financial markets and the following trough within a specified period. However, this should not be taken to mean the same thing as a loss incurred by a trader due to purchase and selling price differentials.
It’s, therefore, safe to say that a stock drawdown is a concept that tells a trader the extent to which the value of the stocks may decline. Often expressed as a percentage, this level is calculated as the difference between the highest value attained by a stock and its lowest price. These two price points are known as the peak and trough points.
Understanding Stock Drawdown with an Example
Spend a few weeks trading in the stock markets, and you’ll soon come to realize that being too patient may have its downfall. And this is why it pays to understand all the variables that can signal when it’s time to exit the markets.
Consider this: you invest $100,000 in a stock-heavy portfolio, unaware that tech stocks are among the most volatile in the market. During trading, the trading account will likely experience all kinds of whipsaws as the share prices fluctuate in reaction to changing market conditions.
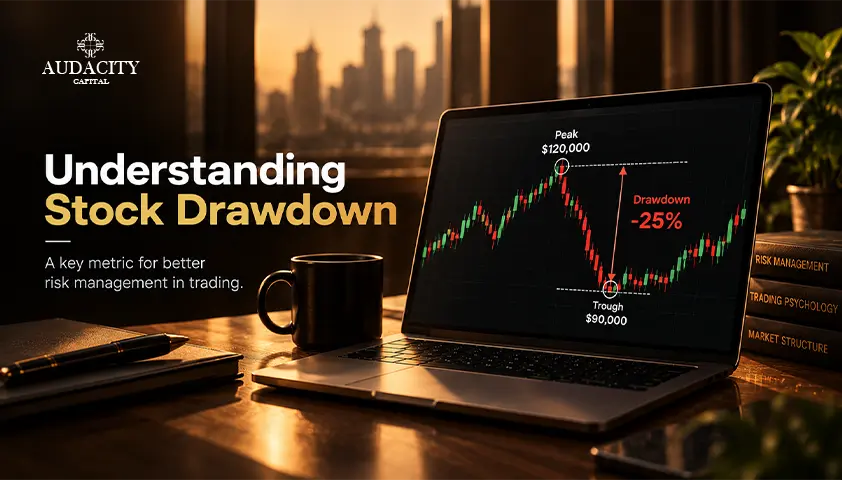
In the course of your trading, prevailing volatility causes the account to dip to the $90,000 market. However, a previous uptrend had helped push this account to a new peak of $120,000.
Now, to calculate the stock drawdown for this account, you’ll need to consider the peak it attained ($120,000) and not the starting capital of $100,000. Your stock drawdown will now be $120,000 – $90,000 = $30,000. And remember, this level is typically measured over a certain duration, and can either be expressed as a percentage or as a dollar amount.
Thus, the formula for calculating the stock drawdown and expressing it as a percentage is as follows:
Drawdown (DD) % = ((Pmax – Pmin) / Pmax)) * 100
Based on our example above:
Pmin = Trough (Historical Low Point within the Specified Period)
Pmax = Peak (Historical High Point within this Same Duration)
Stock Drawdown vs. Stock Loss: What's the Difference?
Although stock drawdown and stock loss both describe a decline in value, they are measured differently.
Stock Drawdown | Stock Loss |
|---|---|
Measured from a previous peak to a subsequent trough | Usually measured from the purchase or entry price to the current or selling price |
Can include unrealized losses while an investment is still held | Can refer to a realized loss after an investment is sold |
Can measure the decline of an individual stock, portfolio, or trading account | Usually refers to the loss on a specific investment or trade |
Focuses on the decline from a high-water mark | Focuses on the difference between the entry price and exit/current price |
Often expressed as a percentage to assess downside and risk | Can be expressed as a dollar amount or percentage of the original investment |
Example
Suppose you purchase a stock for $100. The stock rises to $150 and then falls to $120.
The investment has experienced a $30 drawdown from its peak, or:
($150 − $120) ÷ $150 × 100 = 20%
However, compared with your original purchase price of $100, you still have a $20 gain, or 20%, if you sell at $120.
This illustrates why a drawdown is not necessarily the same as a loss. Drawdown measures the decline from a previous peak, while a loss generally measures a decline relative to the investment or trade's entry price.
How Much Return Is Needed to Recover From a Stock Drawdown?
A stock drawdown does not require the same percentage gain to recover. As the drawdown becomes larger, the return required to bring the investment back to its previous peak increases disproportionately.
For example, if a portfolio falls 10%, it needs to gain approximately 11.1% from its reduced value to return to its original level. A 50% drawdown, however, requires a 100% gain to recover.
Stock Drawdown | Gain Needed to Recover |
|---|---|
10% | 11.1% |
20% | 25% |
30% | 42.9% |
40% | 66.7% |
50% | 100% |
60% | 150% |
The calculation is:
Required Recovery % = Drawdown % ÷ (1 − Drawdown %) × 100
Example
Suppose a stock portfolio reaches a peak of $100,000 and subsequently falls by 30%.
- Peak value: $100,000
- Drawdown: 30%
- Portfolio value after drawdown: $70,000
- Amount needed to recover: $30,000
- Required gain from $70,000: 42.9%
Therefore, a 30% stock drawdown requires a 42.9% gain to return the portfolio to its previous $100,000 peak.
This is why managing drawdown is an important part of risk management. Limiting the size of losses can reduce the amount of recovery required to return to a previous portfolio high.
What Is Maximum Stock Drawdown?
Maximum drawdown (MDD) measures the largest peak-to-trough decline in the value of a stock, portfolio, or trading account over a specified period. It shows the worst decline experienced before the investment or account reaches a new peak.
For example, suppose a portfolio grows from $100,000 to $150,000 and then falls to $105,000 before reaching a new high. The maximum drawdown is:
$150,000 − $105,000 = $45,000
As a percentage:
($150,000 − $105,000) ÷ $150,000 × 100 = 30%
Therefore, the portfolio experienced a 30% maximum drawdown during that period.
Maximum drawdown is useful when evaluating the downside risk of an investment or trading strategy because it shows the largest decline an investor or trader would have experienced from a previous peak during the measurement period.
Important: Maximum drawdown should not be confused with a permanent loss. If the portfolio subsequently recovers and reaches a new peak, the drawdown has been recovered.
Why Does a Stock Drawdown Matter in Trading?

Risk management is a crucial aspect of any trading or investment-related activity. Having a proper risk management plan is what will help keep you in the game when the market conditions suddenly go into a downturn. When creating a trading strategy, go for one that will give you a competitive edge.
For example, a risk management plan that aims for 80% success does not actually imply that 8 out of every 10 trades made must be profitable. You must realize that losses are common in the financial markets, which means a time will come when you’ll find yourself faced with a losing streak.
When this day or moment in time comes, this is when the stock drawdown will kick in. You need to start viewing this drawdown as a part of your everyday trading activities. Consequently, any risk management plan you create today must take into account how you’ll deal with the various drawdowns.
Failure to include drawdowns in your risk management will endanger your portfolio and subsequently your trading account!
Historical Stock Market Drawdowns
Case Studies: Two Important Lessons from the Financial Market Drawdowns
The 2008 Financial Crisis
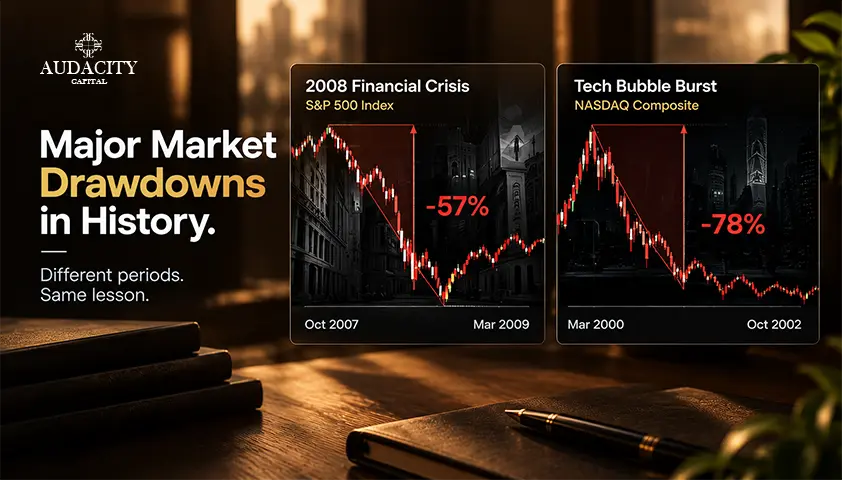
The global stock markets experienced notable drawdowns during the 2008 financial crisis. For example, the S&P 500 Index was able to decline by a record 57% from the period between October 2007 and March 2009. For many, this fall was not only dramatic but also unprecedented, and it helped showcase the importance of portfolio diversification and risk management. During this crisis, the investors who had concentrated in equities or failed to diversify and hedge their risk were the hardest hit, with many recording substantial losses.
The Tech Bubble Burst (2000 – 2002)
The collapse of the tech bubble, which happened in the early 2000s, caused significant drawdowns, especially among traders and investors who had overly focused on tech-based investments. If you look at the NASDAQ Composite Index, you’ll note that it was heavily weighted with tech-related stocks during this period. It subsequently fell by around 78% from its highest peak in March 2000 to its lowest in October 2002. All traders and investors who had failed to sufficiently diversify their assets, or those who found themselves with too much exposure to high-growth tech stocks, wound up suffering untold losses. And this is yet another example of the dangers of focusing too much on one sector and failing to adequately cover your bases.
Conclusion
Historical events like the tech bubble burst and the 2008 financial crisis are good indicators of how drawdowns in the financial markets can significantly affect unprepared traders and investors. If you’re to succeed in prop trading, you’ll need to understand the stock drawdown metrics, making sure to learn what the different types of drawdown mean and how each works. Failure to do so will expose you to potential losses and account termination, as each of these metrics plays a crucial role in evaluating the risk profile of your portfolio. Audacity Capital is a premier prop trading firm where you can learn valuable risk management strategies and even get funding to trade various financial assets, such as stocks, CFDs, and more.
FAQs
The answer to this question will depend entirely on your personality type and tolerance for risk. For example, an aggressive trader can easily tolerate a high drawdown. A conservative trader will, on the other hand, prefer a lower level. Generally, it’s recommended to keep it below 20% for peace of mind.
Proprietary trading firms historically use strict drawdown measures to help safeguard their capital. You’ll be considered to have violated the drawdown level if the account equity dips below a certain level, and this will lead to immediate account termination.
A stock drawdown duration refers to the amount of time it will take your trading account to recover from the drawdown and attain a new peak. For example, many traders would rather work with a shallow, short drawdown as opposed to a shallow, long-lasting one.
No. Every trading strategy will experience a drawdown, no matter how profitable it is. And managing the existing drawdown is more vital than trying to avoid it altogether.
By using a combination of tactics such as stop loss orders, diversification to avoid overexposure, and position sizing.

Prêt à appliquer un risque discipliné aux cryptos ? Explorez les nouveaux instruments crypto d'Audacity Capital et apportez votre stratégie de trading.
En savoir plusNewsletter
Rejoignez notre newsletter pour rester informé.
Rejoignez Notre Communauté Sociale

Commencez Votre Voyage Aujourd'hui Avec Notre Essai Gratuit
Affichez fièrement vos compétences et réalisations grâce à des certificats et obtenez la reconnaissance de votre travail acharné et de votre dévouement auprès d'investisseurs potentiels et de pairs.
Essai GratuitArticles Connexes

What Is a Daily Drawdown in a Prop Trading Firm?
Understand daily drawdown in trading, how it is calculated, and why managing daily losses is crucial for funded traders.

What Is Equity Drawdown in Prop Trading and How Is It Calculated?
Learn what equity drawdown is, how it differs from balance drawdown, how it is calculated, and how traders can manage equity drawdown and risk effectively.

What Is Static Drawdown? How It Works + Examples
Learn what static drawdown means in trading and funded accounts. Audacity Capital explains how static drawdown works and how traders manage risk.

7 Balance-Based Drawdown Prop Firms in 2026 : Honest Review
Compare the 7 best balance-based drawdown prop firms in 2026. Explore drawdown models, profit splits, trading rules, and funding options to find the right prop firm.