


Trading Expectancy: Definition & Formula



Even a strategy that wins 8 out of 10 times can drain your trading account to zero. Another might lose more often than it wins and still compound over months. A simple win rate is not going to be of much help here. That's why expectancy is one of the very first metrics to grasp.
Trading expectancy is the average profit or loss a strategy generates per trade over a sufficient number of trades (taking into account the size and number of wins and losses). This is a diagnostic method, not a prediction tool. When used correctly, it shows the true value of your typical trade.
What Is Trading Expectancy?
Expectancy is the average profit of one trade in the repeated execution of the same trading strategy. It is an estimation based on historical data rather than a prediction of your next trade.
Expectancy can be positive, negative or close to zero.
Positive expectancy is when the historical sample shows average profit made per trade after all losses and gains are taken into consideration.
Negative expectancy occurs when a past series of trades has an average loss.
Near-zero expectancy is an extremely fragile situation, since even slight variations in cost or execution can reverse the number.
Expectancy combines the frequency of winning with the average value of wins and losses per trade. This enables comparison of strategies that have significantly different win rates. A 30% win-rate strategy and an 80% win-rate strategy can both be used to represent a dollar or R value per trade.
Trading Expectancy Formula Explained
The trading expectancy formula is simple:
Expectancy = (Win rate × Average win) − (Loss rate × Average loss)
Consider the average loss to be a positive amount while subtracting.
The meaning of each variable is as follows:
- Win rate = winning trades divided by total trades.
- Loss rate = 1 – win rate, without taking into account breakeven trades.
- Average win = average net profit for your winning trades.
- Average loss = the mean net loss magnitude of your losing trades.
Make sure to use net values after commissions and slippage. The gross values may show the strategy being more profitable than it actually is. Net results reflect what you actually retained as a result of the trade.
How to Calculate Trading Expectancy Step by Step
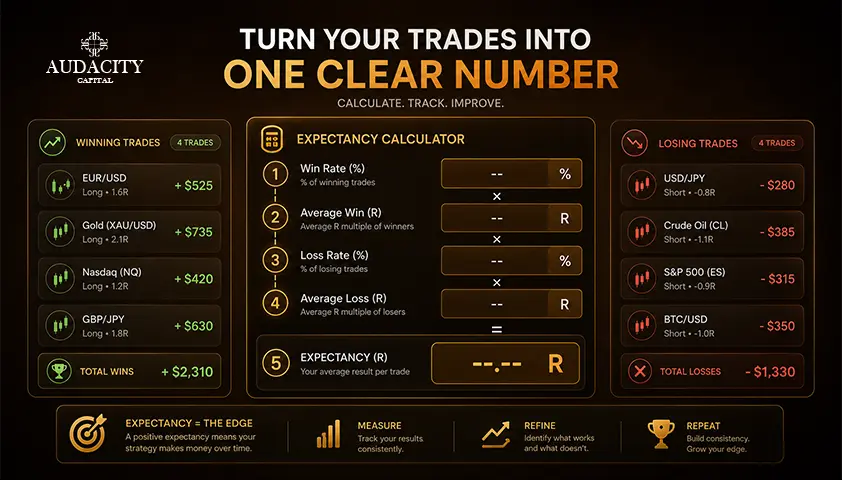
For this example, use a 100-trade sample.
For example, we have a strategy which yielded 45 winners and 55 losers with an average winning trade of $220 and an average losing trade of $150.
- Win rate = 45 / 100 = 0.45
- Loss rate = 55 / 100 = 0.55
- Expectancy = (0.45 × 220) − (0.55 × 150)
- Expectancy = 99 − 82.50 = $16.50 per trade
The above $16.50 is just the historical average expected profit per trade. This figure does not represent how much the next trade will make. That next trade might generate a profit of $400, a loss of $180, or break even. Expectancy refers to the average profit, not the individual outcome.
Let's take a second strategy which seems more promising: 80 winners at +$100 each and 20 losers at −$500 each.
- Expectancy = (0.80 × 100) − (0.20 × 500)
- Expectancy = 80 − 100 = −$20 per trade
Despite an 80% win rate, it has negative expectancy. This is the reason why the win rate alone is misleading for traders.
System | Win Rate | Avg Win | Avg Loss | Expectancy per Trade | Verdict |
A | 45% | $220 | $150 | +$16.50 | Positive edge in sample |
B | 80% | $100 | $500 | −$20.00 | Negative edge despite high win rate |
Note on “breakeven trades”. Do not quietly omit them. Trades that close at zero after commission are actually a small loss. Add the actual net outcome to your list of trades. If you exclude breakeven trades, use the same rule throughout your journal.
Positive vs Negative Trading Expectancy
Positive expectancy trading is one where the sample generated positive profit on average per trade. This is an indication of an edge but is not proof of future profitability.
A higher expectancy does not necessarily mean that one strategy is better than another. Volatility, drawdown and frequency of trades should be considered too.
Negative expectancy is a diagnosis and not a judgement of the trader. It informs you that the current win frequency, payoff layout and cost is not favorable in the sample. This will assist you in deciding what changes need to be made.
Near-zero expectancy deserves particular caution. A strategy that appears to be slightly profitable prior to a trade could be completely ineffective once spreads, commissions, slippage, and trading errors are all taken into account.
A simple case in point: Assuming that the gross expectancy value is $4 per trade, and total trading costs average $6 per trade, the net expectancy value equals -$2. So, the strategy is not profitable when the trading costs are taken into account.
Avoid using general thresholds. If the threshold of +0.3R is taken as good, it will be based on the number of trades, drawdown, variance and sample size.
There is no universal figure to be memorized.
Expectancy based on historical data represents an average, not the next trade expectancy.
Win Rate vs Risk-Reward vs Expectancy
Although related, these measures actually describe different elements of a trading approach.
- Win rate tells us how frequently trades exit with a profit.
- Risk-reward or payoff ratio tells us how big is the average winning trade compared to average losing trade.
- Expectancy takes both and combines them into one single measure of average performance per trade.
Neither 70% win rate nor a planned 1:3 payoff ratio guarantees profits. The target is only a plan. The important numbers are actual win rate, average win and average loss.
Metric | What It Measures | What It Does Not Measure | Best Use |
Win rate | Frequency of winners | Size of wins vs losses | Evaluating consistency of trade selection |
Payoff ratio | Win vs loss size relationship | How often wins occur | Evaluating trade management |
Expectancy | Average value of a trade | Sequence risk, drawdown depth | Evaluating strategy edge |
The expectancy combines the win rate with the payoff ratio. This is helpful when testing a trading strategy overall.
Trading Expectancy in R-Multiples
1R is the initial amount risked on a trade. For example, if one risks $100 and the trade yields $250, the outcome is +2.5R. If it hits your stop for a $100 loss, that is −1R.
Results are easier to compare across account sizes, instruments and position sizes when expressing outcomes in R. The strategy can then be evaluated without tying its results to a specific dollar amount.
Example: a strategy shows 40% winners averaging +2R and 60% losers averaging −1R.
- Expectancy = (0.40 × 2) − (0.60 × 1)
- Expectancy = 0.80 − 0.60 = +0.2R per trade
For example, a trader risking $100 per trade would have an expectancy of about $20 per trade. R-multiples are often more relevant than dollars when studying the strategy.
Dollar expectancy varies with the position size, whereas R is always relevant to the first risked money.
Why Sample Size, Costs and Outliers Matter?
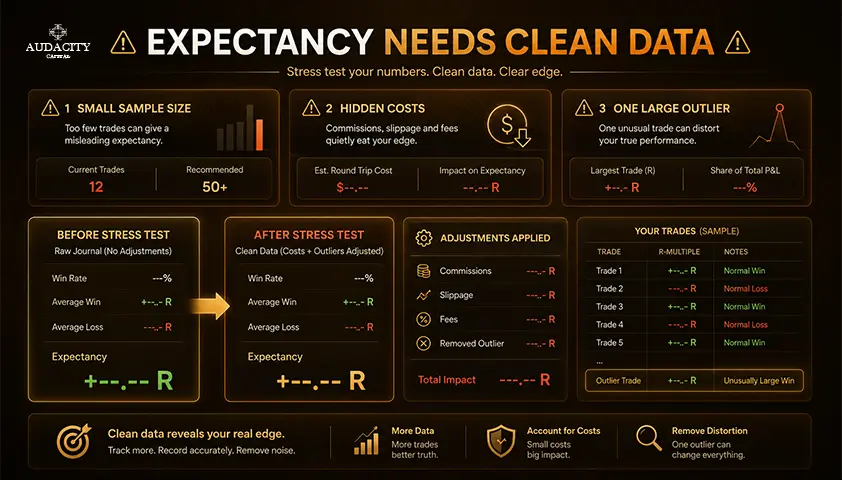
A small or unrepresentative sample can make expectancy look better than it really is. Four limitations deserve attention every time you calculate expectancy.
1. Sample size
An expectancy figure based on ten or twenty trades could have come about entirely through luck. There isn’t a specific minimum sample size requirement, but the larger the number of trades considered, the better.
Even a 30-trade sample is largely affected by luck, while a 300-trade sample in various regimes provides a stronger basis for evaluation.
2. Market regime
A trend-following strategy might show strong expectancy during trending months and weak or negative expectancy during ranges. One overall average can hide this difference. If your strategy depends on market direction, break the sample down by market regime.
3. Costs
Use net trade results wherever possible. High-turnover strategies are especially sensitive to commissions and slippage. A scalping approach that looks profitable in a backtest often collapses live because per-trade costs eat the edge.
4. Outliers
One unusually large winner can inflate the average win and pull expectancy above where the typical trade sits. Look at the full distribution of results, not just the mean.
If the edge depends on rare large winners, you need enough trades to see whether that pattern is repeatable.
Expectancy also says nothing about sequence risk. Two strategies can have the same expectancy but very different losing streaks and drawdowns. Track expectancy alongside drawdown, trade count, average R, win rate and payoff ratio.
Do not use expectancy as a standalone measure.
Before you trust any expectancy number, run this check:
- Enough trades across relevant conditions
- Net of commissions, spreads and slippage
- Multiple market regimes represented
- Outliers reviewed, not smoothed over
- Drawdown pattern examined alongside the number
How to Use Expectancy to Improve a Trading Strategy
Calculating expectancy once is only the starting point. Use your trading journal to track how it changes across different setups and market conditions.
Step 1: Calculate net expectancy for a clearly defined strategy. Do not measure ‘my trading’ as a whole. Focus on a specific setup with a specific set of rules.
Step 2: Your journal may contain several different setups that should be analyzed separately. Segment those trades by setup type, market, direction, session or volatility regime.
Step 3: Compare expectancy and trade count for each segment. A segment with high expectancy but only eight trades needs more evidence before you can draw a reliable conclusion.
Step 4: Identify what is driving weak expectancy. Is it low win rate, oversized losses, undersized winners or costs? Each cause requires a different fix.
Step 5: Change one rule at a time, collect a new sample and retest. Optimizing several variables at once is how traders confuse noise for improvement.
Two patterns can help diagnose weak expectancy. A setup with a solid win rate but negative expectancy may have oversized losses or winners that are being cut too early.
If the average payoff is strong but expectancy remains negative, the win rate may be too low for that payoff structure.
Expectancy is only one part of evaluating a trading edge. It shows whether the overall math is working, while your journal helps explain why.
Conclusion
Expectancy combines win rate with the size of wins and losses to estimate what one trade is worth on average across a sample.
It also helps correct two common mistakes: putting too much weight on win rate and assuming planned reward-to-risk targets will match actual results.
Calculate the net results after deducting the trading expenses from them. Express the results in terms of R in order to compare various strategies. Then check whether the sample size is sufficiently big and diverse enough to trust. Lastly, use your journal to determine where you earn or lose an edge.
Positive historical expectancy means that there might be an edge present but does not guarantee any future results. The conditions on the market change and so does execution, which means you should keep track of your journal.
Frequently Asked Questions
There is no universal threshold. A positive net expectancy is necessary for a strategy to have an edge in the sample. Whether it is useful in practice depends on variance, drawdown, trade frequency and sample quality. Compare expectancy with the rest of the strategy's performance rather than using one number as a benchmark.
As much as needed to reflect the real trading environment. Smaller samples of 20, or even 30, trades can be impressive due to luck. The higher the number of trades used, the more confident you are about your expectancy. Many traders use a couple of hundred trades as a sample size.
Yes. A strategy winning 35% of the time with an average winner three times the size of the average loss produces positive expectancy. Trend-following systems often live in this territory. The math works when large winners outweigh the higher frequency of small losses.
No. Risk-reward measures the size of the average win relative to the average loss. Expectancy combines that ratio with the actual win rate to produce an average outcome per trade. Two strategies can share the same risk-reward ratio but have very different expectancy figures once realized win rates are included.
Yes. While the gross expectancy might be positive, net expectancy might turn out to be negative or very low. Strategies that require frequent trading will be more sensitive to spreads and broker charges. Include them in your calculations in order to have accurate results.
It means that, on average across the sample, each trade produced 0.2 times the initial risk unit as profit. Risking $100 per trade would translate to an average of roughly $20 per trade in that sample. It does not mean the next trade will return 0.2R.
Yes. Expectancy describes the long-run average, not the sequence of outcomes. A strategy with a 40% win rate and positive expectancy can still string together six, eight or more losing trades in a row. Sequence risk is why drawdown must be tracked alongside expectancy.

Prêt à appliquer un risque discipliné aux cryptos ? Explorez les nouveaux instruments crypto d'Audacity Capital et apportez votre stratégie de trading.
En savoir plusNewsletter
Rejoignez notre newsletter pour rester informé.
Rejoignez Notre Communauté Sociale

Commencez Votre Voyage Aujourd'hui Avec Notre Essai Gratuit
Affichez fièrement vos compétences et réalisations grâce à des certificats et obtenez la reconnaissance de votre travail acharné et de votre dévouement auprès d'investisseurs potentiels et de pairs.
Essai GratuitArticles Connexes
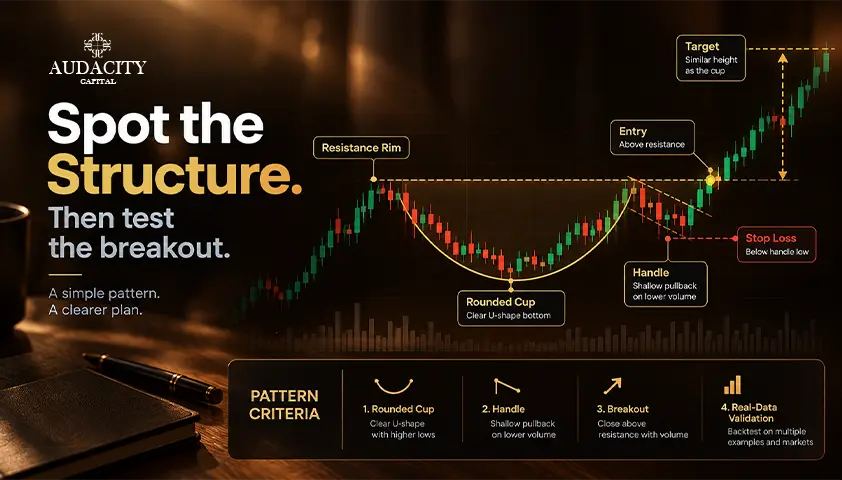
Cup and Handle Pattern: Criteria, Entry and Real Data
The cup and handle pattern explained: the criteria sources disagree on, how to trade it, and what the performance data actually says.

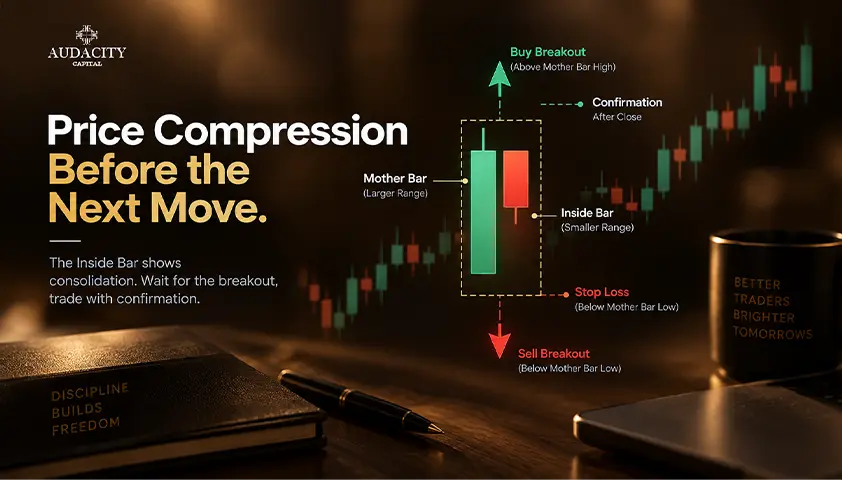
Inside Bar Pattern: Meaning, Examples and Trading Rules
Learn how to identify the inside bar pattern, compare entry and stop rules, and assess false breakouts before testing a trading strategy.

How Many Trading Days in a Year?
How many trading days are there in a year? See the number of U.S. stock market trading days in 2026, monthly totals, holidays and how markets differ.

Trade Deficit Explained: Causes, Effects and Markets
What a trade deficit is, what actually causes it, why it can widen in a strong economy, and why the textbook currency rule often fails.