


Volume Profile Trading Strategy Guide: Setups & Nodes


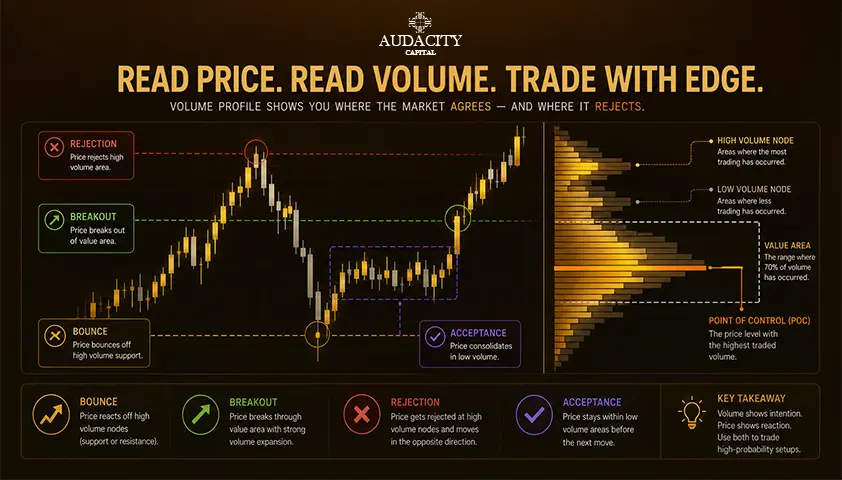
A Volume Profile trading strategy starts from one simple shift in how you read a chart. Instead of guessing where price will find support or resistance, you look at where the market has already spent the most volume.
Volume Profile displays the total traded volume at each price level over a period, so the busiest prices and the empty ones show up as clear, tradeable zones rather than lines you drew by eye.
If you already trade price action, order blocks, or FVGs, this is another institutional-flow lens on the same problem, not a replacement for what you use.
Today we will discuss application, not definitions. We will cover
- the four components (POC, value area, HVN, and LVN)
- four setups you can deploy on ES, NQ, or EURUSD
- the profile types most traders misuse,
- how to combine Volume Profile with your existing tools,
- the best markets and timeframes,
- And some common mistakes.
One thing up front: Volume Profile is a context tool, not a signal generator. It tells you where a level is worth watching. It does not tell you the trade is a winner. Treat it as one input among several, and expect it to fail regularly on its own.
What is Volume Profile and how does it differ from regular volume?
Volume Profile is a chart tool that displays the total traded volume at each price level over a defined period, drawn as a horizontal histogram along the price axis.
The longer the bar, the more contracts or shares changed hands at that price.
That is the key difference from the volume bars at the bottom of your chart.
Standard volume shows volume over time: how much traded during each candle.
Volume Profile shows volume at price: how much traded at each level regardless of when.
One answers "how busy was this bar," the other answers "which prices did the market actually care about."
The concept is not a modern retail invention. It comes from Market Profile and auction market theory, developed by Peter Steidlmayer at the CBOT in the 1980s.
The framework treats the market as a continuous auction searching for a fair price where both buyers and sellers agree to transact.
The core principle follows from that: prices where the market spends a lot of volume represent two-sided agreement, a kind of fair value, and tend to act as support and resistance.
Prices where the market spent little volume represent disagreement, and price tends to move through them quickly.
The Key Components of a Volume Profile
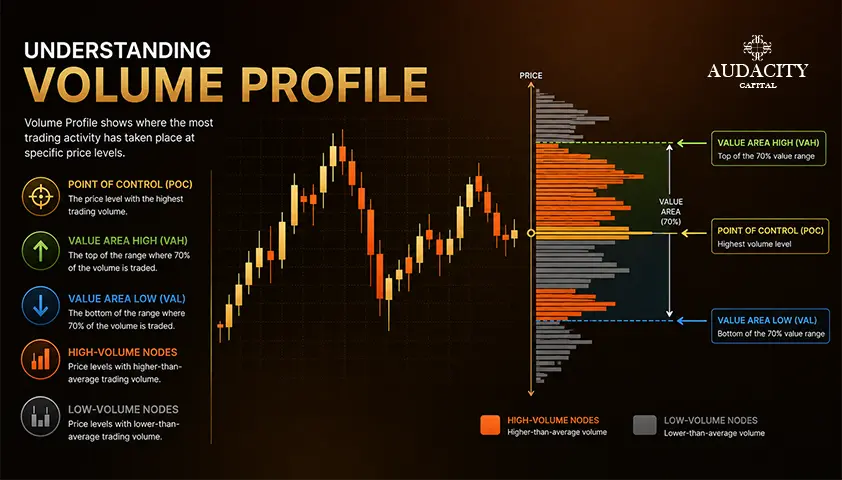
Four features do most of the work. Read them in the order a trader actually uses them: the point of control first, then the value area with its high and low, then high volume nodes, then low volume nodes.
1. Point of Control (POC)
The point of control (POC) is the single price with the highest traded volume in the period. It is the market's center of gravity for that session or range. Price often rotates back to it like a magnet, and it tends to act as a strong support or resistance level once set.
One practical point: The point of control (POC) of an ongoing session recomputes as new volume prints, so an intraday POC shifts through the day. The POC of a completed session is fixed, and that fixed level is what most setups are built around.
2. Value Area, Value Area High (VAH), and Value Area Low (VAL)
The value area is the price range containing roughly 70 percent of the period's total volume. It is bounded by the value area high (VAH) and value area low (VAL), the top and bottom of that range.
The standard calculation, per TradingView's documentation, starts at the POC and expands outward one row at a time, always adding whichever adjacent row above or below has the higher volume, until 70 percent of volume is captured. The top edge becomes the VAH, the bottom edge becomes the VAL.
In practice, prices inside the value area are treated as fair value, and price tends to rotate through them. Prices outside are treated as unfair and tend to get pulled back inside, unless the market starts building volume at the extreme.
When that happens, it signals acceptance and often a new range forming, which is exactly when the value area high (VAH) and value area low (VAL) stop acting as boundaries and start acting as the middle of a fresh distribution.
3. High Volume Node (HVN)
A high volume node (HVN) is a local peak in the profile, a price where a large amount of trading happens. HVNs tend to act as consolidation zones and strong support or resistance on the retest.
A lot of positioning sits at that price, so both sides have to be worked through before the market can move on.
Use HVNs as reversal or consolidation levels. They are poor breakout targets, because price tends to slow and grind once it enters a high volume node (HVN) rather than punch through it.
4. Low Volume Node (LVN)
A low volume node (LVN) is a valley in the profile, a price where very little trading happened. LVNs form during breakouts and breakdowns, when price moved through fast and did not linger.
On the retest, price tends to move through them quickly again, which is why traders call them air pockets, or it rejects cleanly off the edge.
Use LVNs as breakout continuation zones and clean rejection levels. A low volume node (LVN) rarely produces slow consolidation, so it is the wrong place to expect a level to hold and chop sideways.
Four Volume Profile Trading Setups
Here is a toolkit of four setups, not a ranking. Each has a market condition it needs, an entry, a stop, a target, and an honest tradeoff.
Treat the specific entry, stop, and target rules as illustrative. Exact values depend on the market, timeframe, and volatility, so backtest them before you trade them live.
Setup 1: Value area rotation (fade the extreme)
This is the classic mean-reversion play.
When the market is in a range with a balanced, normal-shaped profile, price that pushes above the VAH or below the VAL and fails to build volume at the extreme usually rotates back into the value area.
Enter short at or just above the VAH in a range, or long at or just below the VAL, on a confirmation candle. Place the stop beyond the recent swing outside the value area. Target the POC first, then the opposite value area boundary as a stretch.
Tradeoff: this gets stopped out badly when price genuinely breaks out and builds a new value area at the extreme. It needs a confirmed range, not a trending day. If you cannot see a balanced profile, skip it.
Setup 2: Low volume node breakout (ride the air pocket)
The momentum-continuation play.
When price approaches an LVN with expanding volume, a common filter is relative volume at least 1.5 times the recent session average, per JournalPlus, entering in the breakout direction on the close through the level.
Place the stop beyond the last minor swing or the near edge of the LVN. Target the next HVN or the POC.
Tradeoff: LVNs also produce clean rejections when the level holds. Half-size the position and be quick to cut if price does not accelerate through the air pocket. A failed low volume node (LVN) breakout is one of the fastest ways to lose in this setup, so treat hesitation from price as your cue to exit.
Setup 3: High volume node rejection or acceptance
The support-resistance plays on the retest of a known HVN.
When price approaches a prior HVN from below in an uptrend, it often acts as resistance on the first test, then flips to support once broken and retested from above. The mirror holds in a downtrend.
Enter long on a confirmation candle above a retested and broken HVN in an uptrend, or short on rejection at an HVN in a downtrend. Stop beyond the high volume node (HVN). Target the next HVN or the POC.
Tradeoff: HVNs are consolidation zones, so entries often chop for a while before the move develops. Patience helps, and small size is safer than aggressive size here.
Setup 4: Naked POC retest
The specialist plays.
A naked POC is a prior session's point of control that price has not yet returned to. Traders treat unfilled POCs as strong magnets and as support or resistance on the first retest.
Enter in the direction of the higher-timeframe trend when price retests a naked POC on a confirmation candle. Stop beyond the level. Target the current session's POC or a value area boundary.
Tradeoff: a naked POC can sit unfilled for weeks. This is a patience setup, and it works best when the level also lines up with a price-action reference, a swing point, an order block, or an FVG. A naked POC on its own is a location, not a reason.
Volume Profile types (session, composite, fixed range, VWAP-anchored)
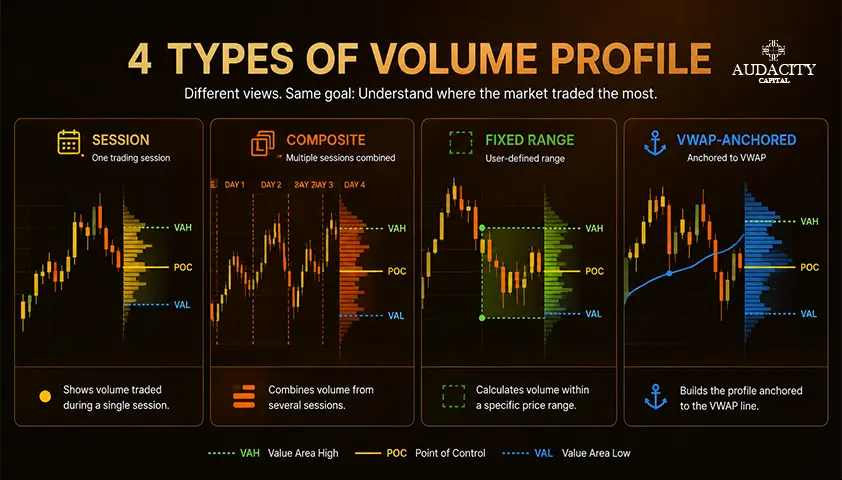
There are four common profile types, and the right one depends entirely on the question you are asking.
1. Session volume profile: It builds one profile per trading session. It is best for intraday setups on futures and equities, and it is what most day-trading guides quietly assume you are using.
2. Composite volume profile: It covers a longer period you choose, such as a week, a month, or a whole trend. It is useful for swing setups and for finding longer-term POCs that intraday charts miss.
3. Fixed range volume profile: It lets you select an arbitrary bar range by hand. Use it to analyze a specific swing, a consolidation, or an event-driven move on its own terms.
4. VWAP-anchored profile: It combines the volume-weighted average price with volume distribution, and they are standard on futures desks for a blended fair-value read.
The rule that ties it together: Do not use the same profile type for every timeframe. A session profile answers an intraday question. A composite answers a swing question.
Match the profile to the question, and half the common mistakes disappear.
Combining Volume Profile with price action, order blocks, and FVGs
Volume Profile gives you the location. Price action tells you whether the location is doing anything.
Here are three combinations worth trading.
1. POC, VAH, or VAL with candlestick confirmation.
Never enter on the touch alone. Wait for a confirming candle at the level, a bullish engulfing, a pin bar, or a lower-timeframe break of structure.
The level defines where you look. The candle defines when you act. Skipping the confirmation is the most common way traders turn a good zone into a bad trade.
2. A POC or naked POC with an order block.
When a naked POC coincides with a same-direction order block from the higher timeframe, the combination is stronger than either concept alone. Both are describing meaningful zones from different angles.
Use the order block for your stop placement and the POC as your target, so the structure gives you the risk and the volume gives you the objective.
3. An LVN with a fair value gap.
An FVG that sits inside a low volume node (LVN) is a high-probability breakout continuation candidate, because both concepts describe the same untraded zone through different lenses, one from candle structure and one from volume distribution.
When they overlap, you have two frameworks agreeing that price wants to move through fast.
Mark your POC and value area on the higher timeframe, a daily or 4-hour composite, for bias. Refine the actual entry on the lower one, a 5-minute or 15-minute chart. Bias on the map, execution on the zoom.
Best markets and timeframes for Volume Profile
Volume Profile is strongest where the volume data is reliable and reflects most participants. That means high-volume, exchange-traded markets: US index futures like ES and NQ, commodity futures like GC and CL, and large-cap US equities.
In these markets, the profile is built on real traded volume reported by the exchange, so the nodes mean what they appear to mean. It works on forex majors on some brokers, with an important caveat.
Retail forex Volume Profile is built on tick-volume, a count of price changes used as a proxy for actual traded volume. There is no central exchange reporting real forex volume, so tick-volume is a rough estimate rather than the truth.
It still produces useful relative levels on the major pairs, but it is less precise than on futures. Treat forex profiles as directional guidance, not gospel.
It is weaker on illiquid crypto and small-cap stocks, where thin, patchy volume distorts the nodes. Reflecting broader institutional order flow and supply and demand zones is only possible when there is genuine liquidity behind the numbers.
On timeframes, use a session profile for intraday work on 5-minute to 1-hour charts, and a composite or weekly composite for swing setups. Do not force a session-profile setup onto a daily-chart swing question. The tool has to match the question.
Volume Profile for prop firm and funded traders
If you are trading a challenge or a funded account, prop firm rules change how you should apply a Volume Profile approach.
Audacity Capital being a proprietary trading firm provides simulated funded accounts on MT5 and DXTrade, so the levels you draw run against real evaluation rules with real thresholds.
Daily drawdown limits mean you cannot afford several LVN-breakout stops in a row. That makes setup selectivity more important than it is on a personal account.
Favor value area rotations on confirmed ranges, HVN rejections with candle confirmation, and naked POC retests that align with the trend, and pass on the marginal breakouts.
Consistency-rule programs discourage the occasional oversized home run, so a steady 1:2 continuation approach at HVNs and naked POCs is usually more evaluation-friendly than aggressive LVN chases.
Size every position from the stop distance, not a fixed lot, because Volume Profile levels sit at different distances from price, and a fixed lot will quietly blow up your risk on the wide setups.
Conclusion
Volume Profile shows how much traded at each price, and the four components, POC, value area, HVN, and LVN, map where the market has spent time and where it has not.
The four setups turn those zones into trade locations, and combining them with price action, order blocks, and FVGs is where the edge sharpens, because agreement beats any single read.
It is a context tool, not a signal, and it will fail on its own. Build the skill on a demo chart first, then test it under real rules with Audacity Capital's free trial. Nothing here is financial advice.
FAQ
No. Volume Profile identifies support and resistance from where the market traded the most volume, while classic support and resistance comes from where price reacted before. The two often line up, and the strongest levels are usually the ones both methods agree on.
With a caveat, yes. Retail forex Volume Profile uses tick-volume as a proxy for actual traded volume, so it is a rough estimate rather than the truth. It still gives useful relative levels on the majors, but it is less precise than on exchange-traded markets like index futures.
It is a prior session's point of control that price has not yet returned to. Traders treat these unfilled levels as strong magnets and often use them as support-resistance targets on the first retest.
VWAP gives you a single average price weighted by volume, useful as a fair-value line and a mean-reversion reference. Volume Profile shows the full distribution of volume across every price, useful for locating specific zones. VWAP is a line, Volume Profile is a map.
Match the profile to the question. Session profiles suit intraday setups on 5-minute to 1-hour charts, while composite or weekly-composite profiles suit swing setups on 4-hour or daily charts. Using a session profile to answer a weekly swing question is the classic misapplication.
Dependable enough to be useful, not dependable enough to trade blind. They are probability zones where price often reacts, especially on ranging days, but they get run cleanly on trending days, so they need candlestick or structure confirmation before you enter.
Yes, and that is where it shines. A naked POC that aligns with a same-direction order block, or an LVN that sits at a fair value gap, is a stronger setup than either concept alone, because both frameworks describe the same untraded zones from different lenses.
It shows total traded volume at each price, which includes institutions, algorithms, and retail all mixed together. It does not separate them, so calling it an institutional footprint is marketing language rather than fact. It is a useful volume lens, not an order-book X-ray.

Prêt à appliquer un risque discipliné aux cryptos ? Explorez les nouveaux instruments crypto d'Audacity Capital et apportez votre stratégie de trading.
En savoir plusNewsletter
Rejoignez notre newsletter pour rester informé.
Rejoignez Notre Communauté Sociale

Commencez Votre Voyage Aujourd'hui Avec Notre Essai Gratuit
Affichez fièrement vos compétences et réalisations grâce à des certificats et obtenez la reconnaissance de votre travail acharné et de votre dévouement auprès d'investisseurs potentiels et de pairs.
Essai GratuitArticles Connexes
Opening Range Breakout Strategy: Rules, Setups and Examples
Learn how the opening range breakout strategy works, including ORB rules, 5, 15 and 30-minute setups, entry signals, stop losses and risk management.

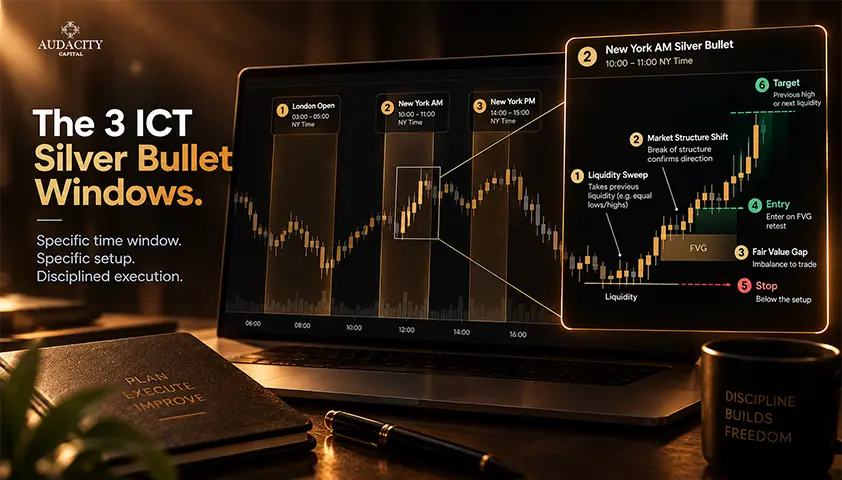
ICT Silver Bullet Strategy: Windows, Setup and Execution Rules
The ICT Silver Bullet windows, the setup step most guides skip, entry and stop rules, and what the published win rates rest on.
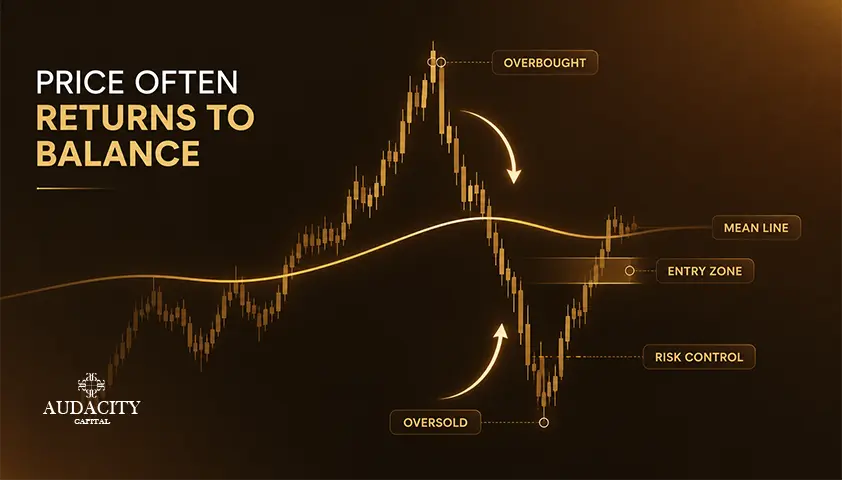
Mean Reversion Trading Strategy Explained (2026)
Prices that stretch too far tend to snap back to an average, but only in the right market. Learn the tools, the setup, and the trend risk.

Martingale Strategy in Trading
How the martingale trading strategy works, what the doubling arithmetic actually costs, why position sizing cannot create an edge, and where it is banned.