



What Is BOS in Trading? A Complete Guide to Break of Structure (2026)


Introduction
If you have spent any time in trading communities over the past few years, you have almost certainly seen the abbreviation BOS scrawled across a chart. It sits next to horizontal lines, arrows and boxes, usually in the middle of a setup that someone claims was obvious in hindsight.
BOS in trading stands for Break of Structure. It is one of the core building blocks of smart money concepts, and it is also, at heart, a very old idea dressed in modern language. Traders have been watching for higher highs and lower lows since long before anyone called it BOS.
The reason the concept has stuck around is simple. Price does not move in straight lines. It moves in swings, and those swings leave behind reference points. When price takes out one of those reference points with conviction, it is telling you something about which side of the market is currently in control. Learning to read that message properly is the difference between reacting to noise and trading with the trend.
This guide walks through what BOS actually is, how to spot a valid one, how it differs from a change of character, and how to build a repeatable trade plan around it. It includes a full worked example with numbers, and covers the mistakes that cause traders to mark up every small break on the chart and end up with nothing tradeable.
What Is BOS in Trading?
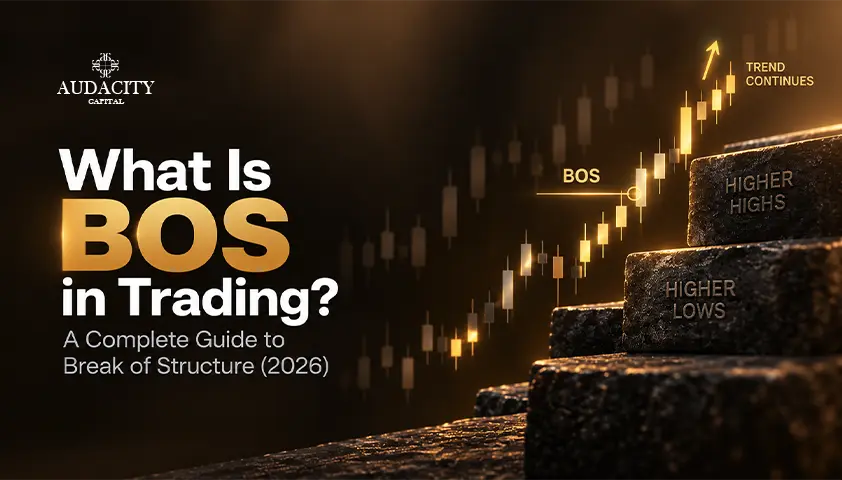
A Break of Structure occurs when price closes decisively beyond a previous swing point in the direction of the existing trend, confirming that the trend is continuing.
Break that down into its two parts:
Structure refers to the sequence of swing highs and swing lows that price prints as it moves. Those swing points are the skeleton of the chart.
Break means price has pushed through one of those points and closed beyond it, rather than just poking at it and reversing.
In an uptrend, a BOS is a close above the most recent significant swing high. In a downtrend, a BOS is a close below the most recent significant swing low.
That is genuinely all it is. The complexity comes not from the definition but from the judgement involved in deciding which swing points matter, and whether a break is real or a trap.
One thing worth clearing up early: BOS is a continuation signal. It confirms what is already happening. It does not predict a reversal. Traders who use BOS as a reversal signal are usually confusing it with a change of character, which we cover shortly.
Market Structure: The Foundation You Need First
You cannot read a break of structure if you cannot read structure. So start here.
Swing highs and swing lows
A swing high is a candle whose high is higher than the candles either side of it. A swing low is a candle whose low is lower than the candles either side of it.
That is the mechanical definition, and it produces far too many swing points to be useful. On a five minute chart you might get dozens per session. The skill lies in filtering.
A significant swing point is one that produced a meaningful move away from it. If price bounced from a low and rallied for two hundred pips, that low matters. If price bounced from a low and drifted sideways for three candles, it does not. Ask yourself whether the level caused a reaction that other market participants would have noticed.
The three structural states
Uptrend (bullish structure): price prints higher highs and higher lows. Each pullback holds above the previous low, and each push forward exceeds the previous high.
Downtrend (bearish structure): price prints lower lows and lower highs. Each bounce fails below the previous high, and each drop exceeds the previous low.
Range (no clear structure): price oscillates between a ceiling and a floor without making progress in either direction. Highs and lows sit roughly level with each other.
That third state is important and frequently ignored. Ranges produce a lot of small breaks that look like BOS but lead nowhere. If you cannot describe the current structure in one sentence, you are probably in a range and should be treating breaks with more suspicion.
Internal structure vs swing structure
There is a further layer worth knowing. Within a larger swing leg, price prints its own smaller sequence of highs and lows. That is called internal structure, and breaks within it are internal BOS.
A four hour uptrend might contain a fifteen minute downtrend during its pullback phase. Both are valid readings of structure at their respective scales. Problems arise when traders mix the two without realising it, treating a fifteen minute break as though it invalidates a four hour trend. It does not.
Bullish BOS vs Bearish BOS
Bullish BOS
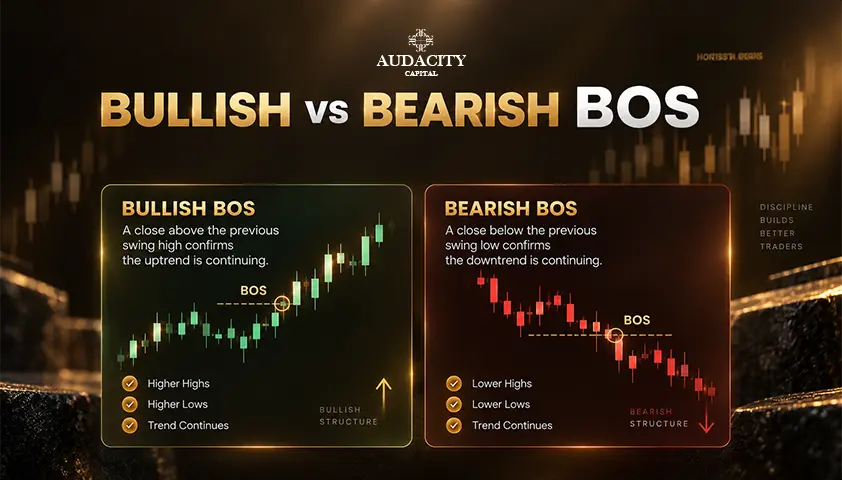
Price is in an uptrend, printing higher highs and higher lows. It pulls back from the most recent high, finds support above the prior low, and then rallies. When a candle closes above that most recent swing high, you have a bullish BOS.
What it confirms: buyers absorbed the pullback and had enough strength to push through the level where sellers previously halted the advance. The uptrend is intact.
What it sets up: a potential long entry on the retracement that typically follows, targeting the next structural level above.
Bearish BOS
Price is in a downtrend, printing lower lows and lower highs. It bounces from the most recent low, stalls below the prior high, and then sells off. When a candle closes below that most recent swing low, you have a bearish BOS.
What it confirms: sellers absorbed the bounce and pushed through prior support. The downtrend is intact.
What it sets up: a potential short entry on the retracement, targeting the next structural level below.
A note on symmetry
The two are mirror images mechanically, but they do not always behave identically. Downside moves in equity indices tend to be faster and more emotional than upside moves, which means bearish BOS on indices often gives you less time to enter on a retracement. In forex the asymmetry is milder. In gold, upside breaks during risk-off periods can be extremely fast. Adjust your expectations by instrument rather than assuming both directions play out the same way.
BOS vs CHoCH: The Difference That Trips Most Traders Up

This is where most of the confusion in smart money concepts lives, so it is worth being precise.
BOS (Break of Structure) is a break in the direction of the existing trend. It confirms continuation.
CHoCH (Change of Character) is a break against the existing trend. It is the first signal that the trend may be ending.
Take an uptrend making higher highs and higher lows. Price pulls back, and instead of holding above the prior higher low, it breaks below it. That break is a CHoCH. It is the first structural evidence that buyers have lost control. It does not confirm a downtrend on its own, but it puts you on alert.
If price then rallies, fails to make a new high, and breaks the low again, that second break is a bearish BOS. The downtrend is now confirmed. Structure has flipped.
So the typical sequence at a trend reversal runs: BOS, BOS, BOS in the old direction, then CHoCH, then BOS, BOS in the new direction.
You will also see the term MSS (Market Structure Shift) used, sometimes interchangeably with CHoCH and sometimes to mean a CHoCH accompanied by strong displacement. Terminology varies between educators. What matters is that you are consistent within your own framework and clear about whether a given break is with the trend or against it.
A simple test: ask which way the trend was going immediately before the break. If the break goes the same way, it is a BOS. If it goes the opposite way, it is a CHoCH.
How to Identify a Valid Break of Structure
Not every push through a level counts. Here are the filters that separate a genuine BOS from noise.
1. Require a candle body close
A wick through the level is not a break. Liquidity sits just beyond swing points precisely because that is where stop losses cluster, and price routinely spikes through to collect those stops before reversing.
Wait for a candle to close beyond the level on your working timeframe. This single rule eliminates a large share of false signals. It also means you will occasionally miss the very best entry on fast moves, which is a trade worth making.
2. Look for displacement
Displacement is a strong, one directional move with large candle bodies and small wicks. A BOS accompanied by displacement is far more reliable than one that creeps through on small indecisive candles.
Ask whether the break looks urgent. Genuine institutional participation tends to leave obvious footprints: expanded ranges, few pullbacks within the leg, and often a fair value gap left behind.
3. Confirm the swing point was significant
Go back to the filtering discussion earlier. If the swing high you are marking only held price for two candles and produced no real reaction, breaking it means very little.
4. Check the context
A BOS in the middle of a tight range is far weaker than a BOS out of a well defined accumulation area or from a higher timeframe level. Structure means more when it aligns with location.
5. Beware of BOS into major news
A break that occurs in the sixty seconds after a central bank decision or a nonfarm payrolls release is often mechanical rather than structural. Spreads widen, liquidity thins, and price can move hundreds of pips before settling into a completely different direction. Let the dust settle before marking structure around scheduled high impact events.
Why BOS Matters: What It Tells You About Order Flow
The theory behind BOS is that large participants cannot enter and exit positions the way a retail trader can. A fund needing to build a substantial position cannot simply buy at market without moving price against itself. It needs liquidity, and liquidity sits where orders cluster.
Orders cluster around obvious levels: previous highs, previous lows, round numbers, session extremes. When price sweeps through a previous low and then rallies hard enough to break the previous high, one reading is that the sweep provided the liquidity for larger buyers to fill, and the break confirms they are now driving price.
Whether or not you accept that narrative in full, the practical value of BOS does not depend on it. The concept works as a trend following filter regardless of the mechanism, because it does something useful and objective: it stops you from taking counter trend trades in a market that is still trending.
That alone is worth a great deal. A large share of retail losses come from trying to pick tops and bottoms. A rule that says "I only go long while structure is bullish" removes a whole category of bad trades from your day.
How to Trade a BOS Step by Step
Here is a repeatable process. Adapt the timeframes to your style, but keep the sequence.
Step 1: Establish higher timeframe bias. Mark structure on the daily or four hour chart. Write down in plain language which way it is going. If you cannot, stand aside.
Step 2: Identify the relevant swing point. On your trading timeframe, mark the most recent significant swing high (for longs) or swing low (for shorts).
Step 3: Wait for the break with a body close. No anticipation. The candle must close beyond the level.
Step 4: Mark the origin of the move. Look back at the candles that caused the break. The last opposing candle before the impulsive leg, or the fair value gap left within the leg, gives you a zone to work with.
Step 5: Wait for the retracement. Most BOS moves pull back into that origin zone. This is where you get a favourable entry rather than chasing the break.
Step 6: Look for entry confirmation. On a lower timeframe, wait for a small structural shift in your direction within the zone, or a rejection candle. This reduces the chance of catching a falling knife.
Step 7: Place your stop beyond the invalidation point. For a long, that is below the swing low that formed before the break. If price trades there, your read was wrong.
Step 8: Set targets at the next structural level. The next opposing swing point, or a higher timeframe level, is a logical objective.
Step 9: Manage the position. Move to break even after the trade reaches a set multiple of risk, or scale out partially at the first target and trail the remainder using subsequent BOS levels.
Worked Example: A Bullish BOS on GBP/USD
The numbers below are illustrative and chosen to make the mechanics clear. They are not live prices or a recommendation.
Context. GBP/USD is in a four hour uptrend. The last two swing lows are 1.2610 and 1.2705, both higher. The last swing high is 1.2780.
The setup. Price pulls back from 1.2780 down to 1.2705, holding above the prior low. It then rallies. A four hour candle closes at 1.2812, comfortably above the 1.2780 swing high. That close is the bullish BOS. Structure is confirmed as still bullish.
Finding the entry zone. Looking back through the impulsive leg, the last bearish four hour candle before the rally sits between 1.2735 and 1.2752. That is the zone to watch on a retracement.
The entry. Price retraces over the following sessions into 1.2745. On the fifteen minute chart, price sweeps a minor low, then prints a small bullish structural break. Entry is taken at 1.2745.
The stop. Placed at 1.2695, ten pips below the 1.2705 swing low. If price closes below that low, structure has changed and the idea is invalid. Risk is 50 pips.
The target. The next significant four hour swing high above sits at 1.2895. That is 150 pips from entry, giving a risk to reward ratio of 1:3.
Position sizing. On a 50,000 account, risking 1 percent means 500 at risk. With a 50 pip stop and a pip value of 10 per standard lot on GBP/USD, the calculation is:
500 ÷ (50 × 10) = 1.0 standard lot
Outcome scenarios.
If price runs to 1.2895, the trade returns 1,500, or 3 percent of the account.
If price returns to 1.2695 and stops you out, the loss is 500, or 1 percent.
At a 1:3 ratio, a strategy needs to win only about 25 percent of the time to break even before costs. That is the real argument for structure based entries. You are not trying to be right often. You are trying to be positioned where being right pays several times more than being wrong costs.
What would have made this a no trade. If the four hour close above 1.2780 had come as a long upper wick with a body still below the level, there would be no BOS. If the retracement had continued straight through 1.2705 without pausing at the zone, the setup would have been cancelled before entry. If a Bank of England decision had been scheduled inside the holding period, position size or the decision to trade at all would need reconsidering.
Multi-Timeframe BOS Alignment
Structure exists on every timeframe simultaneously, and those readings frequently disagree. The resolution is hierarchy, not argument.
A practical three tier approach:
Bias timeframe (daily or four hour): determines direction. You only take trades in this direction.
Setup timeframe (one hour or fifteen minute): where you identify the BOS and the entry zone.
Trigger timeframe (five minute or one minute): where you refine entry and place the stop.
The most reliable trades occur when a lower timeframe BOS happens inside a higher timeframe structure pointing the same way. A fifteen minute bullish BOS occurring during a four hour uptrend, at a discount price within the four hour range, is a considerably better proposition than the same fifteen minute BOS occurring against a four hour downtrend.
Traders who skip the bias step end up taking a technically valid BOS straight into a higher timeframe supply zone, and wonder why the move dies after twenty pips.
Confluences That Improve BOS Trades
BOS on its own is a filter. Combined with other elements, it becomes a setup.
Liquidity sweeps. A sweep of a previous low followed immediately by a bullish BOS is a strong combination. The sweep clears out stops, the break confirms direction.
Order blocks. The last opposing candle before an impulsive move that caused the BOS often acts as support or resistance on the retracement. That gives you a defined entry zone rather than a guess.
Fair value gaps. Rapid moves frequently leave three candle imbalances where price skipped past a range. These gaps often get partially filled on the retracement, giving another entry reference.
Premium and discount. Divide the current range in half. In a bullish structure, entries taken in the lower half (discount) offer better reward relative to risk than entries in the upper half (premium). A BOS followed by a retracement into discount is the textbook version.
Session timing. Structural breaks that occur during the London open or the London to New York overlap carry more weight than those during the Asian session, simply because participation is higher. A break during thin Asian hours is more prone to reversing once London arrives.
Fundamental alignment. If the Federal Reserve is signalling cuts while the European Central Bank holds, a series of bullish BOS on EUR/USD has a macro tailwind behind it. Structure and fundamentals pointing the same way is a meaningfully better trade than structure alone.
BOS Across Sessions and Asset Classes
Forex majors. The cleanest structure of any market, largely because of continuous liquidity. GBP/USD and EUR/USD respect four hour structure well. Watch for the London open to set the structural tone for the day.
Gold. Structure works, but volatility is higher and false breaks are more frequent. Wider stops are necessary, and position sizing must reflect that. Gold also reacts sharply to real yields and geopolitical headlines, which can invalidate a technically clean structure in minutes.
check our guide about gold trading strategies
Crude oil. Structure holds well on higher timeframes but is vulnerable to inventory data and OPEC+ announcements. Intraday BOS during the weekly inventory release is rarely worth trading.
Indices. Strong trending structure, especially on daily charts. The main complication is the gap between the cash session close and the next open, which can leave structure looking broken on the futures chart in a way that does not reflect genuine order flow. Decide in advance which chart you are marking up and stay consistent.
Cryptocurrencies. Twenty four hour trading with no session structure means swing points form differently. Weekend liquidity is thin and breaks there are unreliable.
Common BOS Mistakes and How to Avoid Them
Marking every minor high and low. If your chart has fifteen BOS labels on it, none of them mean anything. Be ruthless about significance.
Trading wick breaks. Wait for the close. This is the single most valuable discipline in the whole approach.
Confusing BOS with CHoCH. Always ask which way the trend was going before the break.
Ignoring the higher timeframe. A perfect five minute BOS into a daily resistance level is a losing trade waiting to happen.
Chasing the break. The whole point of identifying a BOS is to position on the retracement with a tight, logical stop. Entering at the break itself means a wider stop and worse reward relative to risk.
Forcing structure in a range. Ranges are the natural enemy of structure based trading. Recognise them and either stand aside or switch to a range appropriate approach.
Retrofitting. Scrolling back through history and marking BOS labels where the move already happened teaches you nothing. Practise on a replay tool with the future hidden, or forward test on a demo account.
Assuming BOS guarantees continuation. It shifts probability. It does not remove the possibility of an immediate reversal. Every BOS trade needs a stop.
Managing Risk Around a BOS
Structure gives you an unusually clear invalidation point, which is one of its practical strengths. Use it.
Your stop belongs beyond the swing point whose break would flip structure against you. For a long entered after a bullish BOS, that is below the most recent higher low. If price closes below it, the bullish read is dead and you want to be out.
A few practical points:
Size from the stop, not the other way round. Decide your risk percentage first, measure the distance to invalidation, then calculate lot size. Never widen a stop to fit a position size you have already decided on.
Cap risk per trade at a modest percentage. For most traders, somewhere between half a percent and two percent is reasonable, with the lower end appropriate if you take multiple positions per day.
Watch correlation. Long GBP/USD, long EUR/USD and short USD/CHF after three separate bullish BOS signals is essentially one large short dollar position. Structure looking bullish across a basket often means the same driver is behind all of it.
Trail using subsequent BOS levels. As price makes new structural breaks in your favour, move your stop to below each new higher low. This lets winners run while progressively removing risk.
If you are trading under evaluation or funded account rules, the daily and overall drawdown limits change the calculation. A high probability BOS setup you would happily size at two percent on a personal account may need to be halved when a daily loss limit is in play, because two consecutive stops could put you uncomfortably close to a breach. Structure based trading suits these accounts well because of the clear invalidation, but size for the rules you are actually trading under.
Key Takeaways
- BOS in trading stands for Break of Structure: a candle closing decisively beyond a previous significant swing point in the direction of the prevailing trend.
- It confirms trend continuation. It is not a reversal signal.
- CHoCH is the opposite: a break against the trend, signalling a possible change in control.
- A valid BOS requires a body close beyond the level, not a wick, and is stronger when accompanied by displacement.
- The tradeable opportunity is usually the retracement after the break, not the break itself.
- Multi-timeframe alignment matters more than any single break. Higher timeframe bias determines direction.
- Confluences such as liquidity sweeps, order blocks, fair value gaps and discount pricing turn a filter into a setup.
- Structure provides a clean invalidation point, which makes position sizing straightforward and disciplined.
- Ranges produce false breaks. Recognising when structure is absent is as valuable as reading it when present.
Frequently Asked Questions
Break of Structure. It describes price closing beyond a prior swing high or swing low in the direction of the existing trend, confirming that trend is continuing.
Break of Structure. It describes price closing beyond a prior swing high or swing low in the direction of the existing trend, confirming that trend is continuing.
They overlap but are not identical. A breakout usually refers to price leaving a defined range or chart pattern. A BOS specifically refers to breaking a swing point within an established trend sequence. Every BOS is a break of something, but not every breakout is a BOS.
Direction relative to the trend. BOS goes with the trend and confirms continuation. CHoCH goes against the trend and warns of a potential reversal.
There is no single best timeframe. Most traders use the daily or four hour chart for bias, the one hour or fifteen minute for the setup, and a lower timeframe for entry. Higher timeframes produce fewer but more reliable signals.
Yes, because it is based on price behaviour rather than any instrument specific feature. That said, thinner liquidity produces more false breaks, so structure on a small cap stock or a low volume crypto pair is less reliable than on a forex major.
No. It is a pure price action concept and requires only a clean chart. Some traders add volume or a moving average for context, but neither is necessary. Automatic structure indicators exist, though they tend to mark every minor swing and produce more noise than signal.
You never know with certainty in advance. What improves the odds is requiring a body close, looking for displacement in the breaking move, checking the break aligns with higher timeframe direction, and avoiding breaks that occur in thin liquidity or immediately around scheduled news. Anything left after those filters still needs a stop loss.
Yes, on lower timeframes, though signal quality drops as timeframe decreases and transaction costs take a larger share of each move. Scalpers using structure typically work the five minute or one minute chart within a clear fifteen minute or one hour trend, and are selective about session timing.
On a fifteen minute forex chart during active sessions, perhaps two to five per pair, of which maybe one meets full criteria including higher timeframe alignment and a favourable retracement. If you are finding a dozen tradeable ones a day, your filtering is too loose.
If price breaks structure and then immediately reverses back through the level, that failure is itself information. It often indicates the break was a liquidity grab, and the subsequent move in the opposite direction can be forceful. Some traders specifically watch for failed breaks as reversal signals, though this requires more experience than trading BOS in the standard way.

Pronto ad applicare un rischio disciplinato alle criptovalute? Esplora i nuovi strumenti crypto di Audacity Capital e porta la tua strategia di trading.
Scopri di PiùNewsletter
Iscriviti alla newsletter per restare aggiornato.
Unisciti Alla Nostra Community Social

Inizia Il Tuo Viaggio Oggi Con La Nostra Prova Gratuita
Mostra con orgoglio le tue abilità e i tuoi risultati attraverso certificati e ottieni riconoscimenti per il tuo duro lavoro e dedizione da potenziali investitori e colleghi.
Prova GratuitaArticoli Correlati

Averaging Down: Explained
What averaging down does to your breakeven and your exposure, the one question that settles whether to do it, and why leverage changes the answer entirely.


What Is a Breaker Block in Trading? A Complete Guide for 2026
Learn what a breaker block is in trading, how bullish and bearish breaker blocks form, how to identify them, and how traders use them in SMC and ICT.

Spread Betting vs CFD Trading
Spread betting vs CFD trading for UK traders: how each is priced, the real tax difference and its conditions, expiry costs, and which suits which trader.

Trailing Stop Loss: How to Use It
How a trailing stop loss works, three ways to set the distance, the MetaTrader setting most traders get wrong, and what the trail costs you in return.