


Inside Bar Trading Strategy: Rules, Entries and Risk Guide


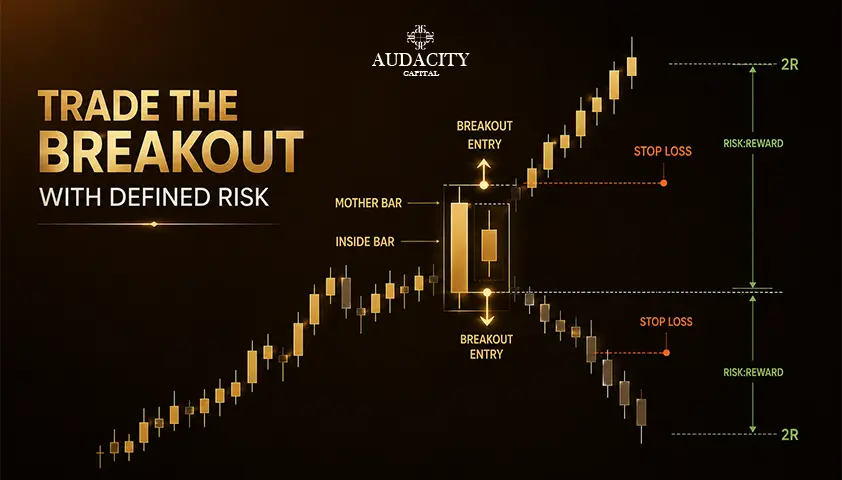
An inside bar trading strategy is a rules-based way to trade a simple two-candle pattern. The current candle forms within the high-low range of the previous candle, which traders call the mother bar. It shows that price has temporarily tightened up, but it does not tell you which way the market will move next.
This guide explains how to consistently recognize the pattern, filter potential setups, choose an entry, set invalidation and target levels, and test the rules. The pattern itself is simple. The harder part is deciding when it makes sense to trade.
What Is an Inside Bar and How Do You Identify It?
An inside bar is a candle that forms within the range of the previous candle. Its high is lower than the previous candle's high, while its low is higher than the previous candle's low. The previous candle is called the mother bar, and the smaller candle inside its range is the inside candle.
Different people have their own definitions.
Some allow for equal highs or equal lows to still be inside bars while others only compare candle bodies rather than the full high-low range. Neither way is wrong. But different definitions will result in different outcomes during backtesting. Choose one definition and use it consistently in your backtesting and live trading.
The candle color is the second characteristic. The bullish or bearish nature of the inside candle does not influence the direction of the breakout itself. People who pay too much attention to candle color may ignore the bigger picture of the market.
What Does an Inside Bar Actually Tell You?
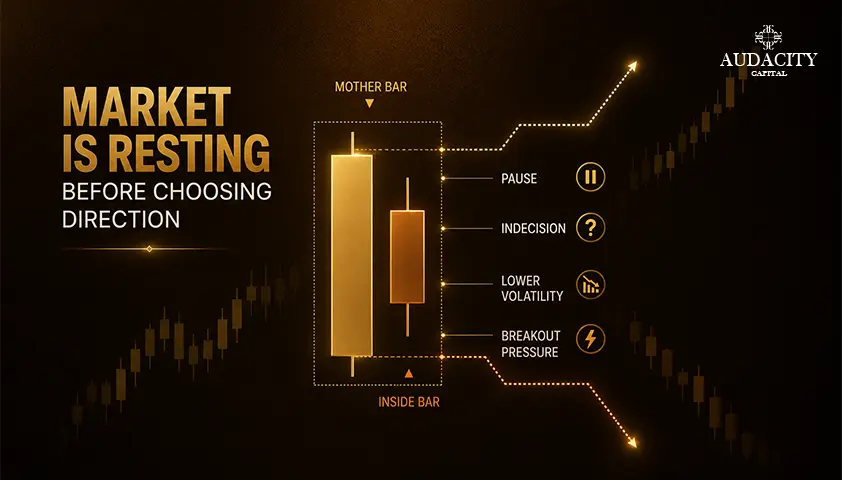
The simplest interpretation is that volatility has compressed. The buyers and sellers were unable to push prices outside of the range of the mother bar on the following timeframe. Price is simply consolidating on that timeframe.
The compression does not give you any indication of where price will move next. Price may continue the existing trend or reverse at a key level. It can also break one side of the range and quickly fail. Sometimes, the price simply remains inside the range for several more bars.
Any of these outcomes can happen. This is why the market structure around the situation and your execution rules are important.
The context around the inside bar is more important than the candle formation itself. An inside bar following a clear retracement into a trending market is telling a completely different story compared to the exact same formation appearing in the middle of a range-bound market environment.
What Makes an Inside Bar Setup Worth Trading?
Not all inside bar setup are worth trading. Evaluate each potential trade against these five factors before deciding to make a trade.
1. Pattern definition.
Check whether the candle fulfills the exact high-low pattern definition that is used in your strategy. You shouldn’t modify the pattern definition mid-session after viewing the close of a candle.
2. Market context.
Start by categorizing the pattern as either a continuation trade or reversal trade. In case you can’t categorize it, just skip it.
3. Location.
Prioritize trade setups formed at significant points on the chart: a retracement area in a trending market, a previous breakout area, or an existing support/resistance level. An inside bar floating in open space carries less information.
4. Room to the target.
Look for the next opposing structure. A clean pattern is still worth skipping if the next major level is too close to support a reasonable risk-to-reward ratio.
5. Execution requirements.
Spread, liquidity, session timing, and risks related to upcoming scheduled events should be considered. Breakout systems react completely differently when spreads and price gaps increase after any news.
How to Trade the Inside Bar Pattern: Step-by-Step Rules
Trading becomes much easier when the same process is followed every time. The following process can be used to trade the inside bar pattern regardless of whether the setup is bullish or bearish.
Step 1. Put labels on the highs and lows of the mother-bar. Decide your direction based on the bigger picture, rather than on the basis of the inside bar candle formation alone.
Step 2. Select your specific trading trigger prior to entering the trade. You can enter based on breakouts, close confirmation, or a combination of breakout and retest.
Step 3. Set the stop loss level and take profit targets for the inside bar trading before entering the trade. Write down what will cause you to abandon your trade so that you do not second-guess yourself during the trade.
Step 4. Size your position based on your stop distance so your planned risk stays consistent across trades.
Bullish example. In a rising market, the price retraces to a former breakout point, creates a mother bar and an inside candlestick. The idea is a continuation of the trend.
Open trade on a closing price above the mother-bar high. Set the stop-loss below the mother-bar low. The next swing high may become your target in case the risk-to-reward ratio is acceptable.
Bearish example. After a strong downtrend to a lower-high region, an inside bar pattern develops under resistance. The thesis is the continuation of the downtrend. Entry point is a break of the inside-bar low with a confirmed close.
The stop loss should be placed above the mother-bar high. Target is the previous swing low.
This set of examples illustrates only the mechanics, not the profitability proof. Every chart can be crafted to appear convincing.
Inside Bar Entry Methods: Breakout, Close Confirmation or Retest?
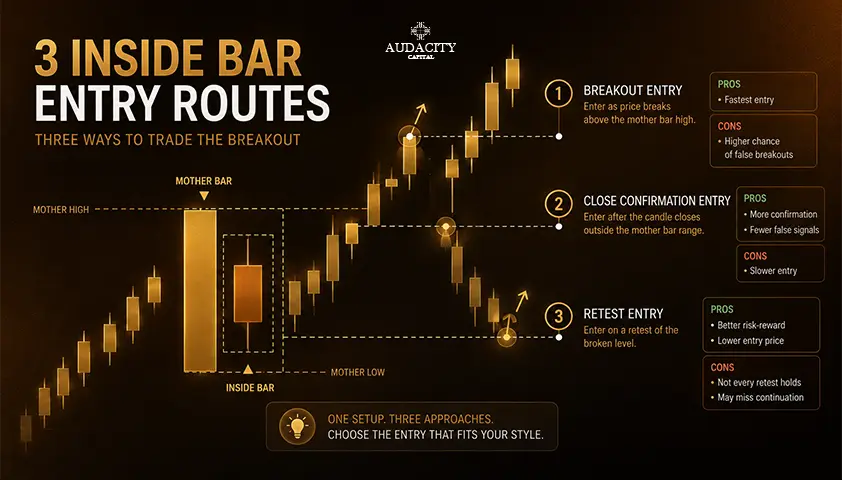
There are usually three approaches used by traders to make an entry into an inside bar breakout. All have their pros and cons.
1. Breakout trigger.
You make an entry immediately after the price moves out of your selected boundary. This provides early entry, however, it increases the risk of false breakout during the candle.
2. Close confirmation.
You only make an entry once the breakout candle closes outside the boundary. You enter late, however, you have additional confirmation that the price has truly moved out of the range. This is a common form of breakout confirmation.
3. Breakout and retest.
You allow the price to break the boundary, retest it, and then hold it before trading. The structure has improved, but you will miss trades because there are many valid setups that fail to retest.
It is important to be clear on what your boundary is. There are two different systems; one that requires a mother-bar breakout, and another that requires an inside bar entry trigger.
Backtest the system of your choice; otherwise, you will not know which entry technique will work for you.
Where to Place the Stop Loss and Profit Target?
Start with invalidation, rather than reward. Your stop indicates where your setup was invalidated.
For the mother-bar breakout strategy, the cleanest structural level for a stop will be at the opposite side of the mother bar. A tighter stop can be placed at the inside candle, but that will be breached much quicker than the bigger move develops. There is no perfect stop placement for all setups.
As for the targets, there are 3 different options that could be compared: the next support or resistance level, a fixed R-multiple, or a trailing exit.
A 1:2 risk-to-reward ratio is very popular, but there is no ratio which is ideal for all markets and timeframes. The key thing is that the target must have enough space left after commissions and spreads.
Position size should be based on the same stop distance. The narrower mother bar provides the tighter stop and hence allows taking a bigger position for the same money risk. For a wider mother bar, the position has to be smaller. The money risk for each trade has to be always calculated on the basis of the stop distance not from a fixed lot or share count.
How to Filter False Breakouts and Fakey Setups
A false breakout happens when price breaks out of a range but fails to continue past the boundary. False breaks belong to breakout strategies. No filter can eliminate them completely.
The fakey setup is a derivative of this concept. First, price breaks out of one side of an inside-bar formation and then re-enters the range from the other side. The key lies in understanding the characteristics of failed breakouts, not learning a new pattern name.
Practical filters worth testing include:
- Trend alignment on a higher timeframe
- Location at meaningful support and resistance
- Requiring a breakout close rather than a wick poke
- Volume confirmation on markets with reliable volume data
- Skipping setups where the next structural barrier is too close
Every added filter comes with a trade-off. More confirmation typically means fewer signals and later entries. The strategy has to be evaluated as a complete system, not filter by filter.
Inside Bar Continuation vs Reversal Setups
The candle pattern is the same, but the trading idea behind each setup is different.
Continuation setup.
The market is already trending. Price pauses or pulls back, and an inside bar forms inside that pause. The thesis here is that the previous direction structure is preserved and the breakout of the inside bar will continue it.
Reversal setup.
The inside bar forms near a major level after an extended move. This is a reversal setup, and it demands more evidence than continuation. The candle itself does not prove the trend has turned.
Countertrend setups should be tracked and tested separately from continuation ones because their behavior and expectancy usually differ.
Multiple inside bars, sometimes called coiling or an inside bar squeeze, describe deeper compression where several nested inside candles print in sequence. A longer sequence of inside bars does not guarantee a larger breakout.
Treat the number of nested bars as another variable to test rather than assuming it improves the setup.
How to Backtest an Inside Bar Trading Strategy?
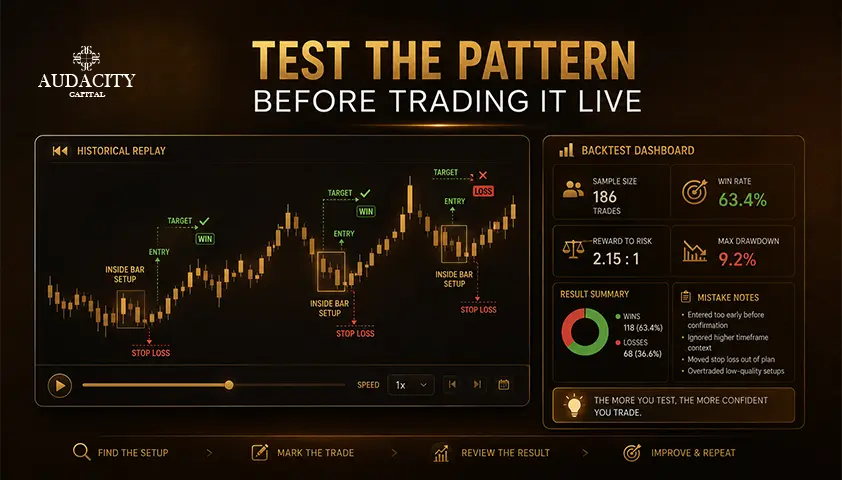
First, test the pattern using fixed rules before drawing conclusions about its potential edge in your market. This is where you will discover whether the pattern has any real value for your trading rules.
Determine all parameters prior to getting any results. The list includes:
- Strict or lenient inside-bar definition
- Market and instrument
- Timeframe
- Trend or level filter
- Trigger type (mother-bar breakout, inside-bar breakout, close, or retest)
- Stop location
- Target or exit rule
- Trading hours
- Assumed spread and commissions
At a minimum, track statistics such as the number of setups, win percentage, average win, average loss, expectancy, maximum drawdown, and results broken out by market condition.
A high win percentage itself is not enough to claim the edge. A strategy with 40% win rate and good ratio between average win and average loss can beat a 65% strategy with poor payoff.
After testing the system using in-sample data, test the rules on data you did not use to build the strategy. Then further forward-test the rules on demo or with a small live position.
There is no special trade count that will make a backtest statistically valid. The data should represent different market conditions and volatility. The same holds true for price action trading in general and inside bars in particular.
Common Inside Bar Trading Mistakes
Most losing streaks with this pattern come from a short list of avoidable errors.
- Trading every inside bar simply because the pattern appeared, without context or filters.
- Changing the pattern definition, entry trigger, or stop method after seeing how the trade develops.
- Assuming the inside bar has a built-in direction and entering before price confirms the trade idea.
- Using the same position size across setups when the mother-bar range, stop distance, or market volatility varies.
- Assuming higher timeframes, unusually tight inside bars, or a favorite indicator automatically improve the setup, without testing the claim.
- Judging the strategy from a few memorable charts instead of a consistent journal of backtested and live trades.
Conclusion
An inside bar trading pattern is more than a simple candle. It requires specific rules when it comes to context, entries, risks, and exits.
Consistently define the pattern, evaluate the market context, choose one entry rule, invalidate and set your target, manage the position size based on stop distance, and keep a consistent journal of your results.
The pattern itself is rather easy to recognize. Any potential edge in trading this pattern will most likely result from the way you filter and trade it rather than from simply recognizing two candles.
The only thing that can make it unique is the consistency of following those rules. Without the discipline, an inside bar becomes just another chart pattern. Test your rules, journal your trades, and let the data decide whether the setup earns a place in your playbook.
Put Your Skills Into Practice
Join our Free Monthly Trading Competition and compete with traders from around the world. High-performing participants have the opportunity to earn a Free Funded Account and take the next step toward becoming a funded trader.
Frequently Asked Questions
The mother bar is the first candle in the pattern. The inside bar is the smaller candle that forms completely within its high-low range. The mother bar defines the boundaries the pattern is measured against. Without a mother bar, there is no valid inside bar.
No. An inside bar signals that short-term volatility has compressed, not that price is about to move in a specific direction. Breakouts can occur, but so can failed breaks, extended consolidation, and full reversals. Its meaning depends on where it forms and how price behaves around it.
Both are valid, and neither is universally best. A mother-bar breakout requires a larger move to trigger and typically pairs with a wider stop. An inside bar breakout triggers earlier with a tighter stop but exposes you to more false breaks. Choose one rule and test it rather than switching between them.
Place the stop where the trade idea is no longer valid. For a breakout entry, this is often beyond the opposite side of the mother bar. A tighter stop at the inside-bar boundary is possible but tends to be tested more often. The correct choice depends on the rules your backtest was built on.
Higher timeframes typically produce fewer signals with wider stops and slower feedback, while lower timeframes produce more signals with more noise. Neither is automatically better. Test the same rules across timeframes on your chosen market and compare expectancy, not just win rate.
A fakey occurs when price initially breaks one side of the inside-bar structure and then reverses back through the range in the opposite direction. It is essentially a failed breakout with follow-through, and it can be traded as its own setup with defined rules. False breaks remain possible in either direction, so the setup still requires clear invalidation.
Fix every variable in advance: pattern definition, market, timeframe, filters, trigger, stop, target, hours, and costs. Record setup count, win rate, average win, average loss, expectancy, and drawdown across a sample that includes different volatility conditions. Run an out-of-sample check and forward test before assuming the results will hold live.

Pronto ad applicare un rischio disciplinato alle criptovalute? Esplora i nuovi strumenti crypto di Audacity Capital e porta la tua strategia di trading.
Scopri di PiùNewsletter
Iscriviti alla newsletter per restare aggiornato.
Unisciti Alla Nostra Community Social

Inizia Il Tuo Viaggio Oggi Con La Nostra Prova Gratuita
Mostra con orgoglio le tue abilità e i tuoi risultati attraverso certificati e ottieni riconoscimenti per il tuo duro lavoro e dedizione da potenziali investitori e colleghi.
Prova GratuitaArticoli Correlati

Momentum Trading Strategy: A Comprehensive Guide
Master the core principles of a momentum trading strategy. Learn how to use key indicators, manage sharp-reversal risks, and master exit timing.

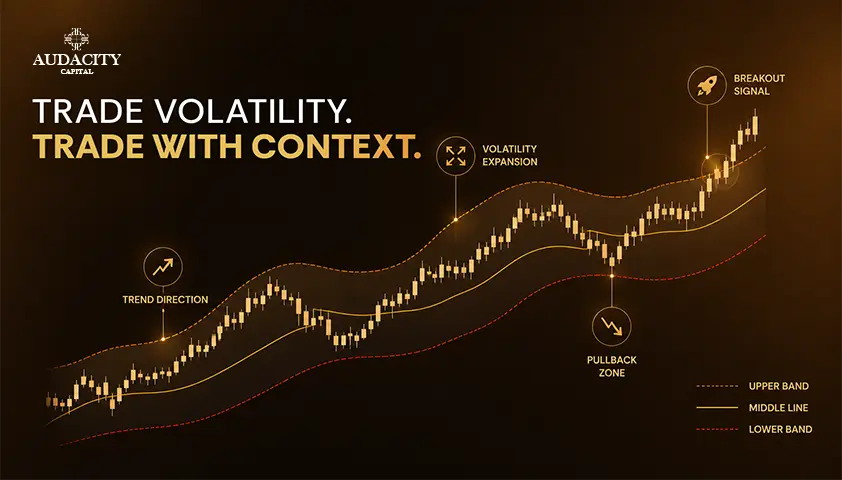
Keltner Channel Trading Strategy: How to Read Volatility With Context
Discover how Keltner Channels measure market volatility, spot trend pullbacks, and confirm breakouts. Includes setup rules, settings, and testing methods.
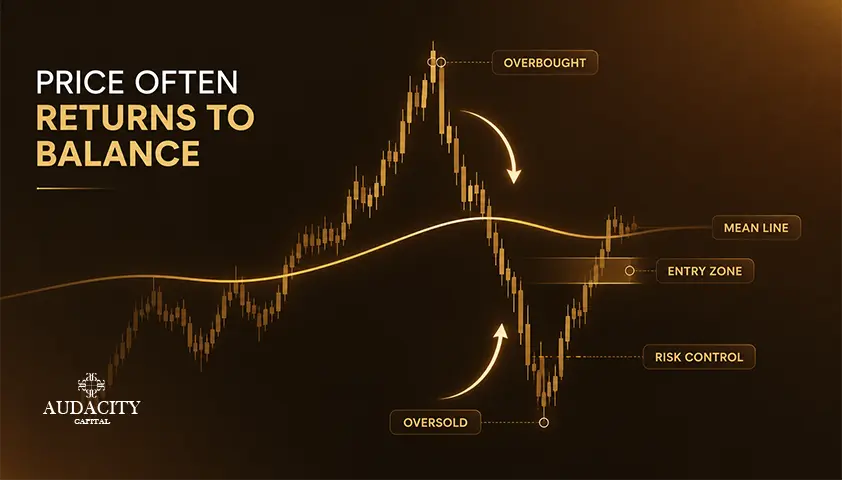
Mean Reversion Trading Strategy Explained (2026)
Prices that stretch too far tend to snap back to an average, but only in the right market. Learn the tools, the setup, and the trend risk.
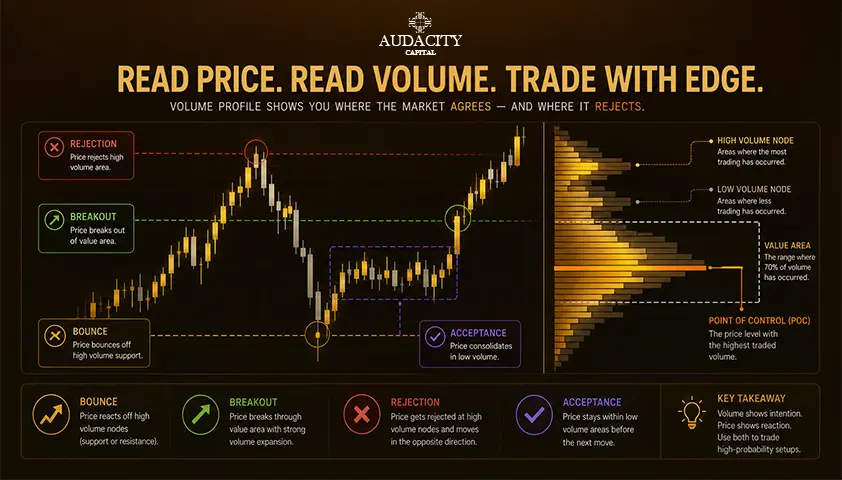
Volume Profile Trading Strategy Guide: Setups & Nodes
A Volume Profile trading strategy shows where the market spent the most volume. Learn POC, value areas, volume nodes, and 4 setups for ES, NQ, and forex.