


ADX Indicator: How to Read Trend Strength


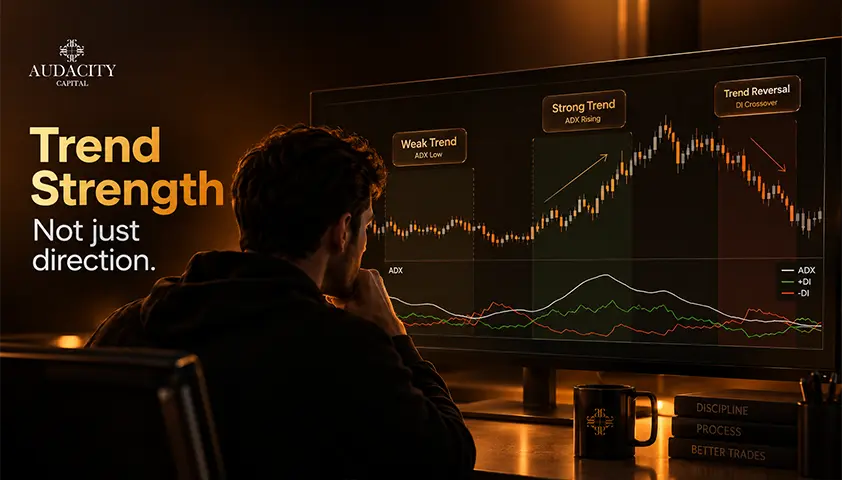
The ADX indicator measures how strongly an instrument is trending. The indicator doesn’t tell you about the direction of this trend; it has never done so.
That’s the entire definition, and that’s why nearly all tutorials about this indicator contain the same description. The issue is even if this indicator is installed correctly, it can function in a manner that is not covered in any tutorial.
The readings may remain high throughout a trend reversal; the values may vary depending on the platform; confirmation may occur after the trend move has brought profits.
That doesn't mean that the tool is faulty. It simply means that the conventional explanation ignores three things.
This article is for educational purposes only and trend trading can be risky.
What the ADX Indicator Actually Measures
The ADX indicator shows the extent of direction in the range from 0 to 100. Strength is persistence: how consistent the price has been at extending one way as opposed to the other within the period of lookback. There is no sign on the reading.
Take a look at its implications in practice. An ADX value of 35 during an uptrend implies that the buying force has kept pushing the price higher without any meaningful opposition coming from the downside. The same goes for ADX being 35 in a downtrend.
The two charts are completely different. The number is the same. With this indicator, the difference between trend strength and trend direction is not an afterthought, it is the design.
The Average Directional Index was invented by J. Welles Wilder Jr. In his book New Concepts in Technical Trading Systems, published in 1978, he describes the Directional Movement System, along with RSI, ATR, and Parabolic SAR.
Wilder himself traded commodities and currencies and made his calibrations from daily commodity charts. This information will be useful later because some of the common calibration problems traders can encounter are associated with it.
A quick correction: This is NOT a momentum indicator. Momentum is the trend of a price change and is measured using momentum tools. The ADX is a measure of the one-sidedness of the movement, a very different number, quite literally.
The Three Lines, and How One Produces the Next
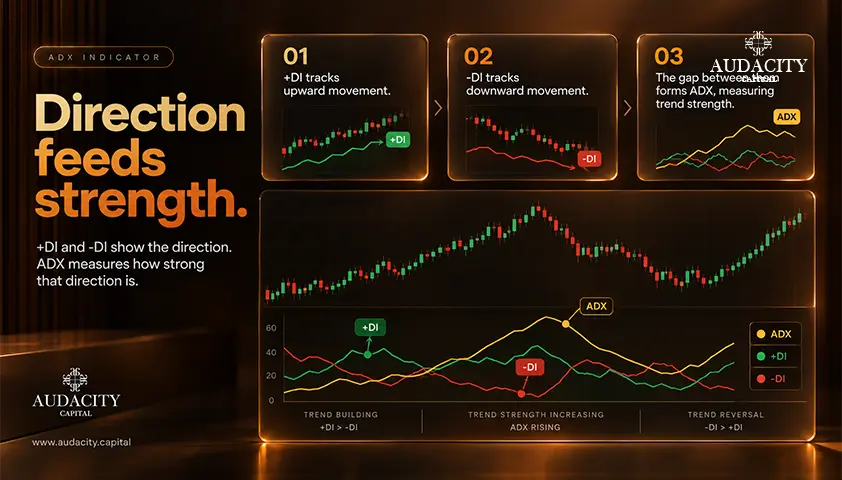
The purpose of this is to understand the derivation process, as it will provide an understanding of the rest of this article. The ADX indicator explained here is in technical terms rather than a rule-based one.
Directional Movement is computed bar by bar. You need to find out how far the present high is extended from the previous high compared to the present low from the previous low. The larger positive extension will be that bar's directional movement, either up or down.
These raw values are further smoothed and divided by the smoothed true range to create the +DI and -DI lines. In simple terms, +DI equals the value of the smoothed up-movement divided by the smoothed true range, while -DI equals the value of the smoothed down-movement divided by the smoothed true range.
Then there is the DX value: The absolute difference between +DI and -DI divided by the sum of both. ADX is a smoothed average of DX.
This is something not many other websites tell you outright. The DX is based on the disparity between the two lines, not on the size of the move. A violent two-sided move may lead to low ADX levels since there is no clear winner.
An ordered one-sided move can cause ADX to be high. This is how the system operates and is the reason that many traders experience the weird effects.
Naming point: +DI and -DI lines put together are called DMI (Directional Movement Index). Some plot ADX as one line, others plot ADX with the other two lines under a DMI label, which can lead to chart interpretation errors.
Reading the ADX Number, and Why the Thresholds Disagree
Wilder postulated the existence of a good trend when the ADX was greater than 25 and non-existent if ADX was less than 20. He left the 20–25 range unresolved.
Since then, many analysts have cited 20 as the "working line". Other publications refer to the strong trend at 40 (or even 50).
Don't think this is settled. These are not rules inherent to the market trader, but the rules the traders decide to apply. That's the exact information you need to get from the disagreement of credible sources.
The indicators are also not easily interpreted across instruments. Wilder used the levels based on the daily charts of commodities and currencies.
An indicator of lower volatility will seldom be higher than 25 on those parameters, while an intraday chart will frequently spend the whole day above it.
Using the level from an article written on a totally different market and timeframe will give traders a filter that is either never triggered or works all the time.
What to do: check your chart, observe the behavior of ADX over the last couple hundred bars, and familiarize yourself with the range ADX works in. That distribution is your baseline, not a number from a tutorial.
ADX reading | Common interpretation | What it still does not tell you |
Below 20 | Weak trend or range conditions | Whether a trend is about to begin |
20 to 25 | Unresolved. Sources disagree on this band | Which way the market will resolve |
25 to 50 | There has been a persistent imbalance in direction | Whether that trend is up or down |
Above 50 | A strong, sustained one-sided move | How much of the move is left to capture |
Above 60 | Uncommon on most instruments | That a reversal or trend exhaustion is due |
Why Your ADX Value May Not Be the Right One
There are two distinct factors that might render the value displayed on your screen incorrect. Both of these factors can be addressed, and neither is covered in most explanations of how ADX works.
Problem one: not enough history
The algorithm used by Wilder in his calculations is recursive.
This means each point contains the whole history before it. As ADX is smoothed twice, once during the directional indicator stage and again from DX, it will take about 150 bars until the values stabilize at their correct levels.
It does make a difference, because an instrument which is just being introduced to the market, or the very beginning of a chart, or even a backtest of a small sample will result in the ADX values which are incorrect.
If you've ever tried comparing a backtest with a live trading and noticed the difference, it could be the reason.
Problem two: platforms smooth differently
The Wilder smoothing method is an exponential moving average with a one-over-N weighting scheme, which weights data points in a way different from a normal exponential moving average of the same period. Platforms haven't standardized on this.
In MetaTrader 5, there are two distinct indicators in its list: one called ADX and the other called ADX Wilder. The two have different smoothing and ranges, and they give different results with the same period on the same chart.
TradingView comes with a built-in ADX indicator that does the Wilder smoothing. When the same trader tries to run the same parameters on both platforms, they get different results.
Nothing wrong here. It is a configuration issue, not a scandal. Ensure what you have in place before using someone else's threshold.
Where the value comes from | Smoothing approach | Practical consequence |
Wilder's 1978 original | Recursive running sum, one over N weighting | The reference definition all other versions are judged against |
TradingView built-in | Wilder's smoothing | Tracks the original closely |
MetaTrader 5 "ADX" | Exponential smoothing on true range | Responds faster and reads differently from the original |
MetaTrader 5 "ADX Wilder" | Smoothed moving average on average true range | The variant that matches Wilder |
Any chart with under roughly 150 bars | Any method | Values have not stabilized and should not be trusted |
A High ADX Reading Does Not Protect Your Position
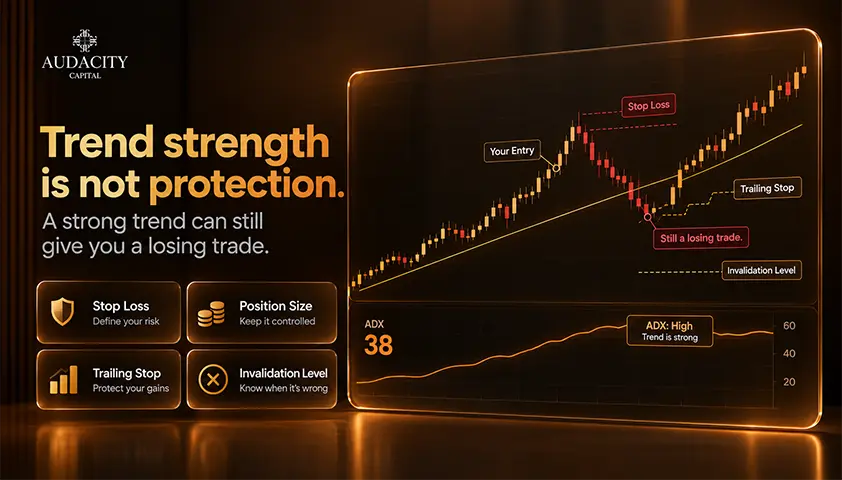
This is by far the costliest misinterpretation of the indicator, and it logically follows the argument made above about strength versus direction.
When traders see ADX high and rising, they assume that it is an indicator that their open trade is positioned well in relation to the underlying trend.
However, since the ADX reading fails to take direction into consideration, the market can change course from being in a strong trend one way to a strong trend the other way, while still having high ADX.
From the indicator's point of view, nothing happened at all. The directional imbalance was still there. It was only the sign that changed and ADX does not carry the sign.
Direction comes from the direction lines. The interaction of +DI and -DI is what changes at the turning point while ADX keeps its value constant. Interpreting ADX as the trend strength indicator without using the DMI lines ignores precisely the information which will indicate the change.
However, it does not mean that the direction lines are reversal indicators themselves. They are not. Instead, they have the information which ADX does not.
What Wilder's Original System Actually Said
Nearly every page on this topic quotes the same fragment: wait for ADX above 25, buy when +DI crosses above -DI, sell when -DI crosses above +DI.
That is roughly a third of what Wilder documented, and the missing parts are the ones that deal with the whipsaw problem traders complain about.
Wilder's full rule set required ADX to confirm that prices were trending before any crossover counted. On a buy signal, the initial stop went at the low of the signal day.
The signal then remained in force as long as that low held, even if +DI crossed back below -DI. The signal was abandoned only when the low was broken.
On a sell signal, the high of the signal day did the same job.
That is the piece the truncated version drops. Strip out the extreme-point rule and every re-crossing becomes an exit, which manufactures the whipsaws people then blame on the indicator. Wilder's version filters those re-crossings by design.
This is documentation of what the original Directional Movement System specified, not a strategy recommendation. No claim is being made here about how it performs.
Where ADX Is Genuinely Weak
The double smoothing that makes ADX stable is the same thing that makes it late. That trade-off is not a flaw to be tuned out; it is structural. By the time the reading confirms a trend, a meaningful portion of the move has usually already happened.
Trading forums are blunt about this. A recurring complaint across long-running threads is that ADX is too much of a lagging indicator to be useful for entries.
A more interesting counterpoint appears in the same discussions: ADX may be poor at flagging the start of a trend but more informative when a trend begins losing its grip. Treat both as trader opinion rather than tested fact, because that is what they are.
The published references are more measured than the marketing. StockCharts ChartSchool describes ADX as heavily smoothed and notes that it tends to filter out roughly as many good signals as bad ones.
That is a long way from the “ultimate trend gauge” framing several ranking pages use.
None of this resolves into a verdict. It defines the range of informed opinion, and the next section gives you something to do with it.
How to Use the ADX Indicator as a Regime Filter, Not a Signal
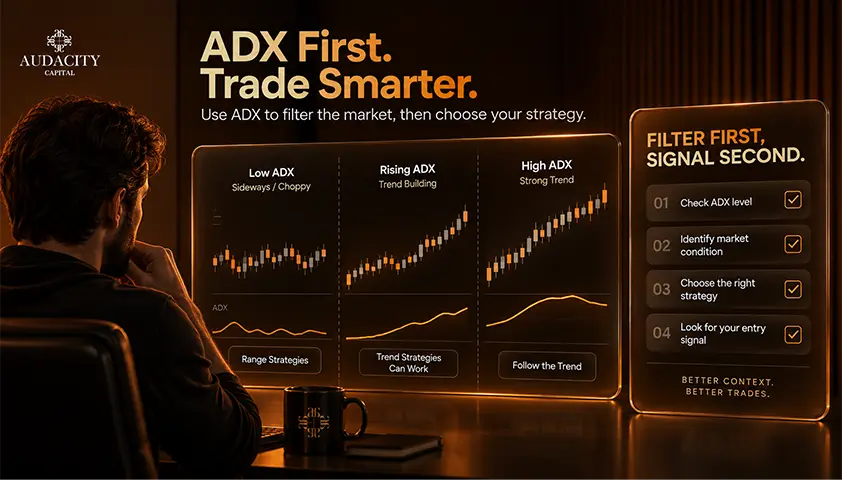
Late, unidirectional, and heavily smoothed makes for a poor entry trigger. It makes for a reasonable answer to a different question: what kind of market am I in right now, and is my strategy built for it?
That reframe is the practical payoff. A trend-following approach run through a stretch of ADX below 20 can produce a string of small losses.
A mean-reversion approach run through a stretch of ADX above 25 can produce a few large ones.
Neither result means the strategy is failing. It is the strategy being deployed in conditions it was never designed for. Used as a regime filter, or more specifically a ranging market filter, the value of this tool sits in the trades it keeps you out of.
Be clear about the boundary. ADX tells you whether to be hunting trend setups at all. Something else has to find the setup, and the directional lines or price structure have to supply the direction.
An observation exercise, not a strategy: tag two weeks of your own trades with the ADX reading at entry. Then compare how the low-band trades performed against the high-band ones.
That is how you calibrate a threshold to your instrument and timeframe instead of borrowing one. It is worth saying plainly that most retail traders lose money and most evaluation challenges fail. No filter changes that, and this one makes no such claim.
Conclusion
The ADX indicator answers a narrow question well and a broad one badly. It reports how persistently one side has been winning, with a delay built into the math, and it stays silent on which side that is.
Nearly every complaint traders raise about it traces back to asking it for direction, for timing, or for a reading it has not had enough history to calculate.
Two checks take only a few minutes. First, confirm which ADX variant your platform has loaded. Then make sure your chart has enough history for the values to stabilize. Finally, look at where the reading actually sits on your instrument.
Most traders using this indicator have done neither. Audacity Capital's simulated evaluation accounts run on MT5 and DXTrade. On MT5, the two ADX variants sit side by side in the indicator list, making it easy to check which one you are running.
You can then see how it behaves under a defined daily loss limit before your own capital is involved.
Frequently Asked Questions
You can, but the conventional thresholds do not survive the change. Shortening the period makes ADX respond sooner and produce more readings above any given level, so a filter set at 25 will trigger far more often. Any move away from the 14-period setting means you have to re-derive your own levels from the instrument you trade.
DMI usually refers to the pair of directional lines, +DI and -DI. ADX is the smoothed strength line derived from the gap between them. Platforms label the combined plot inconsistently, which is why the same chart setup can appear under either name.
ADXR is Wilder's Average Directional Movement Rating: the average of the current ADX value and the ADX value from a set number of periods earlier. That extra averaging smooths the line further and slows it further still. If you already find ADX late, ADXR will be later.
Both come from Wilder, and both are built on true range, but they report different things. ATR tells you how much an instrument is moving. ADX tells you how one-sided that movement has been. A market can show high ATR and low ADX at the same time, which describes a volatile range.
No, not for closed bars. Each completed bar's value is fixed once the bar closes. Only the currently forming bar updates in real time, which is normal behavior for any calculation that uses the live price.
It means the downward imbalance is strengthening. That is a completely normal reading and carries no bullish implication. ADX has no sign, so a rising line during a decline is confirming the sell-off's persistence, not hinting at a turn.

暗号資産に規律あるリスクを適用する準備はできていますか?Audacity Capitalの新しい暗号資産商品を探索し、あなたの取引戦略を持ち込んでください。
詳細を見るニュースレター
ニュースレターに登録して最新情報を入手。
ソーシャルコミュニティに参加

関連記事
How to Stress-Test a Trading Strategy With Monte Carlo
Learn how Monte Carlo simulation reshuffles trades, estimates drawdown and losing-streak ranges, and tests a strategy beyond one backtest.

All About the Shooting Star Candlestick Pattern – Learn to Decode It
Learn what the shooting star candlestick pattern means, how to identify it, confirm bearish reversal signals, and manage trading risk.
Maximum Favorable Excursion: How MFE and MAE Read a Trade
Learn how Maximum Favorable Excursion and MAE reveal a trade's best and worst open moves, exit giveback, and possible entry or exit problems.
Bullish RSI Divergence: How to Spot, Confirm and Trade It
Learn how to identify bullish RSI divergence, confirm reversal signals, choose entries, set stop losses, and manage risk effectively.