


Volume Spread Analysis (VSA) Explained


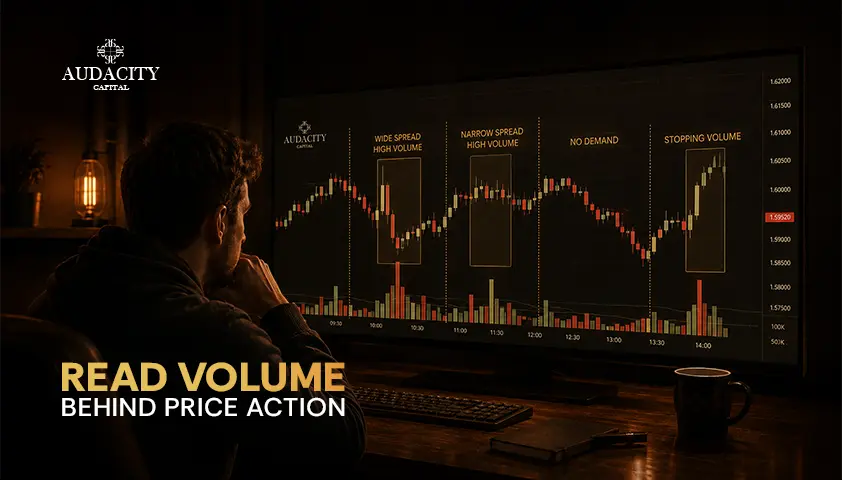
Volume Spread Analysis is a chart-reading technique that analyzes the relationship between a bar's volume, spread (the high-to-low range), and closing price to assess supply and demand as well as interpret possible professional activity.
What makes VSA unique from most other technical methods is not the identification of various patterns but rather one simple rule: Effort must be proportional to results.
The volume is the effort while the price action is the result. When these two are in conflict it means something is happening beneath the surface.
This article describes VSA's origins, the one basic principle, the signals that are commonly known among traders, how to interpret a bar in context, and where this method has its honest limitations.
Before we continue, there is one important fact to remember. This is educational material only, not financial advice. While VSA gives an analytical model of supply and demand, it does not identify the trader or reasons for the trade.
It is also highly dependent on the quality of volume data used. Trading is not risk-free, and most individual traders are losing money.
What Volume Spread Analysis Is
Volume Spread Analysis is the study of the interaction between volume, spread, and close within the context of each bar to discover changes in supply and demand.
The technique was derived from the research work of Richard Wyckoff during the early 20th century; his theories of accumulation, distribution, and cause-and-effect form the basis of modern volume analysis.
The concept was further developed and expanded upon by Tom Williams through his book called 'Master the Markets', which draws inspiration from earlier concepts of Wyckoff regarding price, volume, accumulation, and distribution.
In all these references, the basic premise is that big markets are driven by professional money and that the footprints left behind by them can be seen in volume. The latter point is crucial. VSA is a way of reading footprints left behind, not the way of proving what happened and why.
The One Principle Behind It All: Effort vs Result
All the indicators generated by VSA are based on one test: effort vs result. In this case, volume represents the effort made in the price move, spread is the price result, and the closing price reveals where price finished within that range.
The key idea: If there is no agreement between the effort and the price result, then VSA considers this inconsistency a potential basis for analyzing supply and demand dynamics.
In a strong trend, effort and result usually coincide. For example, a strong uptrend may generate an extensive up-bar on increasing volume, which closes near its high.
In turn, a strong downtrend may generate an extensive down-bar on increasing volume, which closes near its low. The price movement and volume are broadly telling the same story.
This signal is an anomaly. When effort and result disagree, VSA tries to find a possible answer in the relationship between supply and demand.
If there is high volume on a small bar, it means high activity but no price change. In addition, if there is a wide bar but on unusually low volume, this may cast doubt on the strength of the move.
Example: Heavy volume, limited downside
Let’s consider a market that has been moving down for several sessions. A bar forms with unusually high volume, while the range is narrow and its closing is away from the low.
It is a high effort signal, while the downside is limited. VSA could explain this as demand absorbing selling pressure, although confirmation from the next bars is needed.
Example: Heavy volume, weak close
Now think about the reverse of that scenario. Price rises into previous resistance and forms a wide up-bar at its weekly peak in terms of volume, but the closing price is located in the lower third of the bar.
This price rise generated high interest, yet sellers managed to drive price action down closer to the bottom of its range. VSA could take this as a sign that supply is reacting to the price rise.
Rather than learning a set of pattern names, begin by asking yourself the questions posed by each individual bar. Is this volume reasonable relative to the price movement? Where did the bar close within its range?
Then consider those clues in the context of the overall market situation rather than a single reading.
The Core VSA Signals
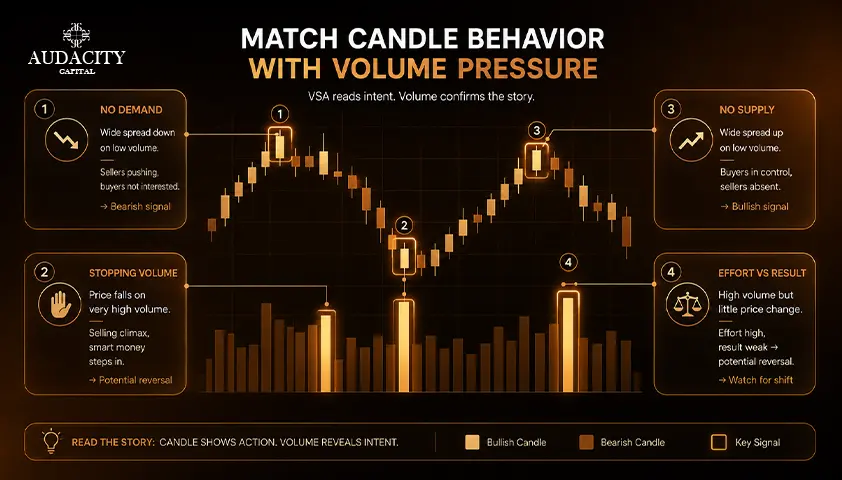
The VSA signals we’ve mentioned above are simply the expressions of the effort-versus-result principle. When you look at them as volume and close questions, the list becomes much easier to remember.
1. No demand
Narrow up-bar on low volume. Price moved up; however, there was no backing for it. In an uptrend, this situation of lack of professional buying indicates that the price movement is weak.
2. No supply
This is a reverse case. A narrow down-bar on low volume. The price moved lower, but the limited activity suggests that that selling pressure is weak. In a developing uptrend, it may suggest that selling pressure is drying up.
3. Upthrust
A wide push higher that closes down on high volume. The price moves upward, and the buys placed above an earlier high are triggered and then sold. The close near the low, with high volume, indicates distribution and a setup for late buyers to be caught in.
4. Spring or shakeout
This is the opposite of the upthrust. The price falls below support to make a lower low, then moves back up through support on heavy volume. The stops get triggered, and the supply gets absorbed by the professionals.
5. Test
A dip on low volume that closes up in the upper part of its range. It shows that supply has dried up on the pullback and confirms underlying strength.
6. Stopping or climactic volume
Ultra-high volume that halts a trend. Selling climax occurs during an extended downtrend, while buying climax occurs during an extended uptrend, signaling exhaustion when one side becomes dominant.
Each of these readings derives from the same three factors and not from the pattern name.
How to Read a Bar in Context
No bar is read alone. Volume is always relative, judged against the last several bars rather than measured as an absolute number. A bar that would be heavy in a quiet session may be average in an active one.
What matters is whether the current bar is unusually high or low compared to its recent neighbors.
Context matters just as much. A no demand bar in the middle of a range means very little. The same bar printed at a prior high, after a long rally, in a market that has already shown signs of distribution, carries far more weight. VSA is a weight-of-evidence method, not a one-bar trigger.
A practical routine helps. First, read the background. Is the market in strength or weakness, is it likely in accumulation or distribution, and where is price sitting relative to structure.
Second, apply the effort-versus-result test to the current bar. Third, wait for the following bars to confirm or refute the read before you act.
Traders who lean on VSA also sometimes cross-check with indicators that summarize buying and selling pressure over time, such as on-balance volume (OBV), though these are supporting tools rather than replacements for reading each bar.
The Limits of VSA
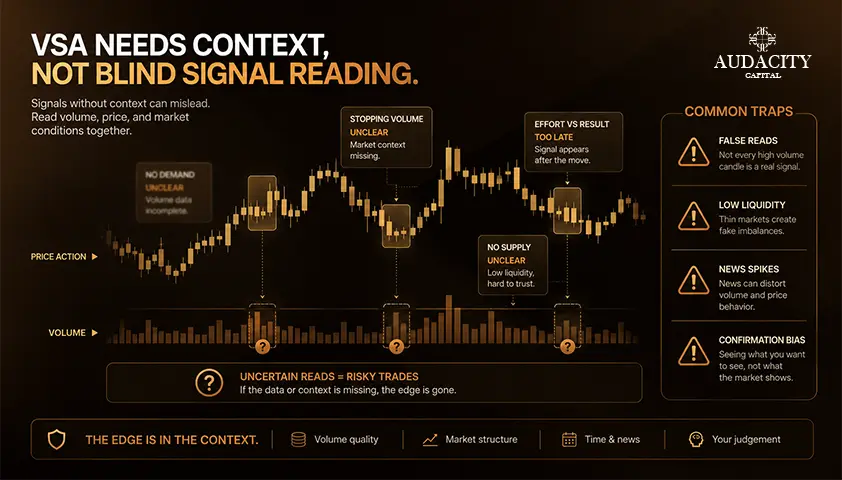
1. VSA is subjective
VSA has real value as a lens, but its readings remain subjective. A chart can reveal unusual relationships between volume and price, yet it cannot tell you with certainty who was responsible for the activity or what they intended.
Two experienced traders can study the same sequence and reach different conclusions. That subjectivity is part of the method.
2. Volume quality matters
It depends on real volume. VSA is strongest on exchange-traded stocks and futures, where transactions are reported through a centralized market. Spot forex is different. There is no single centralized volume feed, so trading platforms generally provide tick volume or broker-specific volume.
These measures can still offer useful clues, but they are proxies rather than a complete picture of market participation.
3. VSA takes time to learn
It also takes time to learn. Reading effort versus result across different market conditions is a discretionary skill, not a checklist. Automated VSA indicators can highlight potential signals, but they cannot replace context and judgment.
Any advertised win rate attached to a VSA course or tool should be tested independently rather than accepted at face value.
4. VSA works best as part of a broader framework
VSA also needs a broader trading framework. Position sizing, market structure, entry criteria, exits, and risk control still determine how much damage a wrong interpretation can cause.
The method should therefore be treated as one source of evidence rather than a standalone trading system.
The takeaway is straightforward. VSA can help traders study supply and demand through the relationship between volume, spread, and the close.
It is most useful when applied to markets with reliable volume data and combined with sound structure and risk management. Study it on historical charts and test the approach before putting real capital behind it.
Conclusion
Volume Spread Analysis reads volume against a bar's spread and close to judge supply and demand, and the entire method flows from one principle. Effort should match the result. When it does not, something is happening beneath the surface.
The signals with familiar names, no demand, no supply, upthrust, spring / shakeout, test, and climactic volume, are expressions of that principle rather than a list to memorize.
VSA is a discretionary method, strongest on markets with reliable volume data and weaker in spot forex. Treat it as interpretation used alongside structure and risk management, and study and test it on your own charts before you commit real capital to any reading it produces.
Frequently Asked Questions
It can help traders interpret supply and demand, particularly in markets with reliable volume data. Its readings are discretionary, however, so different traders may interpret the same price and volume sequence differently. VSA should be tested as part of a broader trading approach rather than relied on as a standalone edge.
Wyckoff provides the overarching theory of accumulation, distribution, and market cycles that explains how markets move over time. VSA, refined by Tom Williams, provides the bar-by-bar signals and named readings used to interpret that framework in real time.
It is weaker in spot forex because there is no centralized volume feed. Forex platforms show tick volume or broker volume, which are proxies rather than true market participation, so VSA is generally more reliable on stocks and futures that have genuine exchange-reported volume.
A no demand bar is a narrow-spread up-bar on unusually low volume, meaning price rose but no professional buying backed the move. VSA reads it as a sign of weakness, especially when it prints during what looks like an uptrend or near a prior high.
An upthrust is a wide push higher that closes down on high volume, signaling distribution and a trap for buyers chasing a breakout. A spring breaks below a support level then closes back above it on high volume, signaling accumulation and a trap for sellers who shorted the break.
Effort versus result is the core principle that volume, the effort behind a bar, should match the price movement, the result on the chart. When the two disagree, such as heavy volume producing only a small range, VSA reads the mismatch as evidence of professional activity absorbing or withholding beneath the surface.
They share the Wyckoff lineage and the idea of reading professional activity, but they work differently in practice. VSA focuses on volume against spread and close on each bar, while Smart Money Concepts focuses on market structure, liquidity pools, and zones like order blocks.
Practitioners typically describe a learning curve of several months at minimum, and often longer, before readings become consistent. Reading effort versus result in context takes deliberate screen time across different markets and conditions, and there is no fixed shortcut to that experience.

暗号資産に規律あるリスクを適用する準備はできていますか?Audacity Capitalの新しい暗号資産商品を探索し、あなたの取引戦略を持ち込んでください。
詳細を見るニュースレター
ニュースレターに登録して最新情報を入手。
ソーシャルコミュニティに参加

関連記事
All About the Shooting Star Candlestick Pattern – Learn to Decode It
Learn what the shooting star candlestick pattern means, how to identify it, confirm bearish reversal signals, and manage trading risk.

Sortino Ratio in Trading: How It Measures Downside Risk
Learn what the Sortino Ratio means, how to calculate it using downside deviation, and how traders use it to compare risk-adjusted performance.
How to Stress-Test a Trading Strategy With Monte Carlo
Learn how Monte Carlo simulation reshuffles trades, estimates drawdown and losing-streak ranges, and tests a strategy beyond one backtest.
Sharpe Ratio: Formula, Calculation, Uses and Limitations
Learn how the Sharpe ratio works, how to calculate it, what a good score means, and where it can mislead investors, portfolios, and trading strategies.