
Best Timeframe for Swing Trading: The Complete 2026 Guide to Picking the Right Chart

For most swing traders, the Daily chart (D1) is the best primary timeframe because it provides reliable signals, cleaner price action, and manageable trade frequency. Professional swing traders often combine the Weekly chart for trend context and the 4-Hour chart for entry timing, creating a three-timeframe framework that balances accuracy and risk management.
What Makes a Timeframe "Right" for Swing Trading?
Swing trading occupies the sweet spot between day trading and long-term investing. You're holding positions for several days to a few weeks, targeting meaningful price movements — not intraday ticks, not year-long macro trends.
Because of this, your timeframe does a specific job: it must capture swings that are large enough to be profitable after spreads and costs, but short enough that you're not locked into a position for months.
Every timeframe is a filter. A shorter timeframe shows you more detail but floods you with noise. A longer timeframe silences the noise but hides the entry precision you need. The Best Timeframe for Swing Trading gives you both clarity and opportunity — and that's why most professionals converge on just three: the Weekly, the Daily, and the 4-Hour chart.
But the right choice for you depends on five things:
- Your schedule — how many hours per day or week can you genuinely monitor markets?
- Your holding period preference — 2–5 days or 2–3 weeks?
- Your risk tolerance — how wide a stop-loss are you comfortable managing?
- The market you trade — stocks, forex, and crypto each have different optimal rhythms
- Your experience level — shorter timeframes demand faster, more disciplined decision-making
This guide gives you an honest, detailed answer for every one of those variables — something most competitor articles completely skip.
The Best Timeframe for Swing Trading Explained
Before we rank them, here's what each timeframe actually means in the context of swing trading:
Timeframe | Candle Duration | Typical Trade Holding Period | Screen Time Required |
Weekly (W1) | 1 week per candle | 3–8 weeks | Minimal (once/week) |
Daily (D1) | 1 day per candle | 5–15 trading days | Low (once/day) |
4-Hour (H4) | 4 hours per candle | 3–7 days | Moderate (2–3x/day) |
1-Hour (H1) | 1 hour per candle | 1–4 days | Active (every few hours) |
30-Min (M30) | 30 minutes per candle | Less than 2 days | High — borderline day trading |
Swing trading's natural home is the Daily and 4-Hour charts. The Weekly adds macro context. The 1-Hour sharpens your entries. Anything below the 1-hour starts pulling you into day-trading territory where the noise overwhelms swing setups.
The Daily Chart: Why It Is the Gold Standard
Ask any seasoned swing trader what chart they trust most, and the answer is almost always the same: the daily chart (D1).
Each candle on the daily chart represents one full trading day — all the intraday noise of opens, lunches, dips, and rallies compressed into a single, clean bar. What you're left with is what genuinely mattered that day: where price opened, where it pushed to, where sellers/buyers stepped in, and where it closed.
Why the Daily Chart Dominates Swing Trading
Signal reliability is dramatically higher. A double-bottom pattern on the daily chart took two full trading days to form, survived multiple intraday attempts to break it, and closed at those levels twice. That same pattern on a 15-minute chart formed in 30 minutes and could disappear just as fast. The daily gives you patterns with staying power.
You're aligned with institutional activity. Fund managers, institutional desks, and major market participants do their primary analysis on the daily chart. When you trade from the daily, you're reading the same signals as the money that actually moves markets.
You only need to check it once a day. This is transformative for part-time traders or anyone with a job or business. You spend 30–45 minutes in the evening reviewing setups, place your orders, set your stop-loss, and let the trade run. No screen addiction, no emotional interference from intraday noise.
Stop-losses are rational. A daily chart stop-loss is placed below a significant daily candle low or key support zone — it takes meaningful price movement to hit it. Compare this to the 15-minute chart, where a single news spike can stop you out of a perfectly valid setup.
Risk-to-reward ratios are naturally larger. Daily chart swing trades typically target 3:1 or better risk-to-reward ratios because the profit targets (often major resistance levels or swing highs) are much further from the entry than on shorter timeframes.
Who Should Use the Daily Chart as Their Primary Timeframe
- Part-time traders with day jobs or businesses
- Beginners building their first consistent swing trading system
- Anyone who wants the lowest possible emotional workload while still actively trading
- Traders who have been burned by short-term chart noise and keep getting stopped out
The Daily Chart Verdict: If you only use one timeframe for swing trading, make it the daily chart. It offers the best balance of signal quality, trade frequency, manageable stop-losses, and low-stress trade management.
The 4-Hour Chart: The Entry Specialist
The 4-hour chart (H4) is where strategy meets execution. While the daily chart is your primary analysis frame, the 4-hour is where you time your entries with precision.
Every 4-hour candle represents one full trading session block — roughly the New York morning, New York afternoon, Asian session, or European session. This means 4-hour charts naturally capture institutional session-level activity, making them structurally significant in a way that 1-hour or 15-minute charts are not.
What the 4-Hour Chart Does That the Daily Cannot
It shows pullbacks in real time. On the daily chart, you know price has pulled back to a key support zone. But you can't see the candlestick signal that tells you the pullback is ending and buyers are stepping back in — that happens within the daily candle, not at the close. The 4-hour chart shows you that reversal signal hours before the daily candle closes.
It reveals intraday structure. A daily chart might show a clean uptrend. The 4-hour chart will show you the exact sequence of higher highs and higher lows forming within that trend — giving you a much more precise entry zone.
It gives more trade setups per month. A daily-chart-only strategy might generate 8–15 setups per month. Adding the 4-hour chart can increase this to 20–35, as you can catch shorter swings within the broader daily trend.
The Right Way to Use the 4-Hour Chart
Use the daily chart to identify the trade idea. Use the 4-hour chart to time the entry.
Specifically:
- You see a daily chart in a clear uptrend
- Price pulls back to a key daily support zone (moving average, previous resistance-turned-support, Fibonacci retracement)
- You switch to the 4-hour chart and wait for a bullish signal — a bullish engulfing candle, a break of a short-term resistance level, or a bullish divergence on RSI
- You enter on the 4-hour signal with a stop below the daily support zone
- Your profit target is back at the daily chart's recent swing high
This combination gives you the structure of the daily with the precision of the 4-hour. It's the most widely used swing trading framework among professional traders for a reason.
Who Should Use the 4-Hour Chart as Their Primary Timeframe
- Traders who want more frequent setups than the daily provides
- Active traders who can check charts 2–3 times per day
- Traders with at least 6 months of consistent experience on daily charts
- Forex traders, since the 4-hour chart aligns naturally with major session boundaries
The 4-Hour Chart Verdict: Don't use it in isolation. Use it as your entry timeframe while the daily chart sets the context. Together, they form the most powerful swing trading combination available.
4-Hour vs Daily Chart: Which Is Better for Swing Trading?
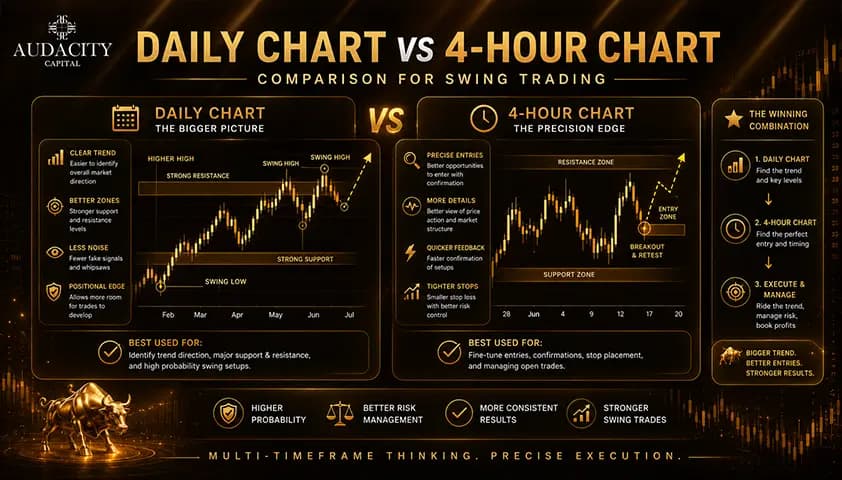
Feature | Daily Chart | 4-Hour Chart |
|---|---|---|
Signal Quality | Higher | High |
Trade Frequency | Lower | Higher |
Noise | Lower | Higher |
Beginner Friendly | Yes | Moderate |
Best Use | Setup Identification | Entry Timing |
Verdict:
The Daily chart is better for identifying swing trading opportunities, while the 4-Hour chart is better for refining entries and improving risk-to-reward ratios.
The Weekly Chart: Your Market Compass
The weekly chart is the timeframe most swing traders consult but few trade directly from. Each candle represents a full trading week — five days of price action compressed into a single bar.
The weekly chart's job is simple: tell you the direction of the dominant trend so you don't trade against it.
Why the Weekly Chart Matters
Major support and resistance levels are far more significant on the weekly chart. When price hits a level that has held for months — visible clearly on the weekly chart — you're looking at an area where institutional money has repeatedly defended positions. These zones have enormous gravity.
Swing traders who ignore the weekly chart often find themselves placing technically perfect daily-chart long trades directly into major weekly chart resistance — and then watching their trades fail to break through despite doing everything else right.
Weekly charts also reveal the broader market cycle. Is the market in a sustained trending phase or a choppy, ranging phase? Trending phases produce excellent daily-chart swing setups. Ranging phases produce false breakouts and frustrating chop. The weekly chart tells you which environment you're operating in.
How to Use the Weekly Chart
Spend 15–20 minutes on the weekend reviewing the weekly chart for every market you trade. Ask these questions:
- Is price in an uptrend, downtrend, or range on the weekly?
- Are there any major weekly support or resistance levels nearby?
- Is price approaching a weekly trendline or moving average?
- Is the weekly chart in overbought or oversold territory (RSI above 70 or below 30)?
These answers set your directional bias for the week ahead. If the weekly trend is up, you look for long setups on the daily chart. If the weekly is approaching a major resistance zone, you size down or avoid adding to longs.
The Weekly Chart Verdict: Not a standalone trading timeframe for swing traders, but indispensable as a context tool. Check it once a week. It will save you from many bad trades.
The 1-Hour Chart: Precision Tool or Rabbit Hole?
The 1-hour chart (H1) sits right at the boundary between swing trading and day trading. For swing traders, it has one specific use: ultra-precise entry timing within a 4-hour or daily chart setup.
If you're using the daily chart for bias and the 4-hour chart for entry structure, you can drop to the 1-hour chart to get an even tighter entry — reducing your stop-loss size and improving your risk-to-reward ratio.
However, this comes with a significant warning: most swing traders who move to the 1-hour chart start behaving like day traders. They watch candles forming, react to noise, second-guess their setups, and exit too early. The 1-hour chart becomes a psychological trap.
When to Use the 1-Hour Chart (and When to Avoid It)
Use it when:
- You have a clear daily chart setup and a defined 4-hour entry zone
- You want to reduce stop-loss size for a specific trade
- The 4-hour candle is 6–12 hours from closing and you want early entry confirmation
Avoid it when:
- You're using it as your primary analysis frame (that's day trading, not swing trading)
- You're watching it tick-by-tick during market hours
- You've already entered a trade and you're now using it to "monitor" — this is almost always detrimental to decision-making
The 1-Hour Chart Verdict: Optional advanced tool for entry refinement. Use it surgically, not as your main analysis frame. If you find yourself staring at the 1-hour chart for more than 20 minutes at a time, you're using it wrong.
Multi-Timeframe Analysis for Swing Traders: The 3-Chart System

The biggest edge you can give yourself as a swing trader isn't a better indicator or a secret entry pattern — it's reading the market across three timeframes simultaneously. This is called Multi-Timeframe Analysis (MTFA), and it's the difference between trading with context and trading in the dark.
Here is the exact 3-chart system used by professional swing traders:
Level 1 — The Compass Chart (Weekly)
Purpose: Determine the dominant trend direction and identify major structural levels.
Your questions here:
- Is the weekly chart making higher highs and higher lows (uptrend) or lower highs and lower lows (downtrend)?
- Where are the major weekly support and resistance zones?
- Are we near a weekly moving average (e.g., 20-week or 50-week MA)?
Output: Your directional bias. "This week I will only look for long setups" OR "This week I will only look for short setups" OR "The weekly chart is ranging — I will be selective and size smaller."
Level 2 — The Setup Chart (Daily)
Purpose: Identify the specific trade setup — the pullback, the pattern, the key level, and the potential entry zone.
Your questions here:
- Is price pulling back to a key daily support level (moving average, previous resistance, Fibonacci level)?
- Is a recognizable chart pattern forming (bull flag, double bottom, cup and handle, ascending triangle)?
- Does the daily RSI or MACD support a potential reversal from this zone?
Output: Your trade plan. "I am watching for a long entry near the 50-day MA at [price level], targeting the recent swing high at [price level], with a stop below [price level]."
Level 3 — The Entry Chart (4-Hour or 1-Hour)
Purpose: Time your entry with precision by confirming momentum has shifted in your favor at the setup zone.
Your questions here:
- Has price shown a bullish reversal signal on the 4-hour chart at the daily support zone? (Bullish engulfing, pin bar, break of downtrend line)
- Has volume increased on the bullish candles?
- Is the 4-hour RSI turning up from oversold?
Output: Your entry trigger. "When the 4-hour candle closes as a bullish engulfing at the 50-day MA zone, I enter long with a market order at the open of the next candle."
A Real Example of This System in Action
Imagine you're trading a stock. Here's how MTFA applies:
- Weekly chart: Clear uptrend. Price is pulling back from the weekly high but still above the 20-week MA. No major resistance nearby above current price. Bias: Bullish.
- Daily chart: Price has pulled back 38% of the prior up-leg and is sitting exactly at the 50-day moving average, which has acted as dynamic support three times in the past six months. A small hammer candle just formed. Setup identified: Long at or near the 50-day MA.
- 4-Hour chart: Price dipped below the 50-day MA intraday but closed back above it on the previous candle. The current 4-hour candle is bullish and has taken out the previous 4-hour candle's high. RSI is turning up from 42. Entry trigger confirmed.
You enter long. Stop is placed below the recent 4-hour swing low. Target is the weekly chart's prior high. Risk-to-reward: approximately 3.5:1.
This is professional-grade swing trading. All three timeframes agreed. You traded with the institutional trend, entered at a logical pullback level, and used a lower timeframe to confirm the timing. That's MTFA done right.
Best Timeframe by Market: Stocks, Forex, Crypto, Futures
Different markets have different personalities. The same timeframe that works brilliantly for forex may underperform for stocks. Here's a complete breakdown:
Stocks and Equities
Primary timeframe: Daily Entry timeframe: 4-Hour Context timeframe: Weekly
Stocks have a unique feature that fundamentally shapes timeframe selection: overnight gaps. A stock can close perfectly at a support level on the daily chart and open 6% lower the next morning due to an earnings report or news release. Intraday timeframes (1-hour and below) completely miss this overnight risk.
The daily chart captures these gaps naturally, as each candle's open accounts for them. This is why daily-chart analysis is especially critical for stock swing traders — and why 1-hour charts often give false signals (the pattern looks perfect until the next day's open invalidates it entirely).
Key rules for stock swing traders:
- Always check earnings dates before entering. Never hold a stock through earnings in a swing trade unless you've deliberately sized the position to absorb a gap.
- The daily chart is non-negotiable as your primary frame. Everything else is secondary.
- The 4-hour chart works best during the core trading hours (9:30 AM – 4:00 PM EST). Avoid relying on 4-hour candles that include the pre-market or post-market sessions, as volume is thin and price action is unreliable.
Forex (Currency Pairs)
Primary timeframe: Daily Entry timeframe: 4-Hour Context timeframe: Weekly
Forex is the most timeframe-flexible market because it runs 24 hours, 5 days a week. There are no overnight gaps (price is continuous), which makes the 4-hour chart particularly powerful — it naturally aligns with major session boundaries (Asian, European, North American).
The 4-hour chart for forex shows you the rhythm of institutional trading sessions in a way that other markets don't offer. A bullish 4-hour candle closing as the New York session ends is very different from a bullish candle forming during the thin Asian session.
Key rules for forex swing traders:
- The daily chart remains your primary setup tool, but the 4-hour chart is arguably more important for forex than for any other market.
- Volatile pairs (GBP/JPY, GBP/USD, NZD/USD) benefit from the daily chart's noise reduction more than stable pairs (EUR/CHF, USD/JPY).
- Weekly charts for major pairs (EUR/USD, GBP/USD, USD/JPY) reveal multi-month trends that directly affect how far daily chart setups can run.
Cryptocurrency
Primary timeframe: Daily Entry timeframe: 4-Hour Context timeframe: Weekly
Crypto trades 24/7, 365 days a year. This is both a blessing and a curse for swing traders. The always-on nature means there are no gaps, but it also means the market can make enormous moves at 3 AM on a Sunday with zero warning.
The daily chart is particularly important for crypto swing trading because it filters out the extreme intraday volatility that crypto is known for. A Bitcoin move that looks catastrophic on a 15-minute chart might be a barely noticeable wick on the daily chart.
Key rules for crypto swing traders:
- Use the daily chart as your primary frame and be disciplined about stop-losses. Crypto's volatility is genuine — respect it.
- The 4-hour chart works well for Bitcoin and Ethereum, which have sufficient liquidity to produce reliable 4-hour structure. For smaller altcoins with lower liquidity, stick to the daily chart — 4-hour candles can be manipulated by smaller amounts of capital.
- The weekly chart for Bitcoin in particular is remarkably useful: Bitcoin's multi-month cycles have historically respected weekly-level structure more consistently than intraday levels.
- Weekend sessions tend to have lower volume. Setups that trigger on Saturday or Sunday should be treated with more skepticism than weekday triggers.
Futures (Index, Commodity, Interest Rate)
Primary timeframe: Daily Entry timeframe: 4-Hour Context timeframe: Weekly
Futures swing trading is similar to forex in that contracts trade nearly around the clock (with brief daily breaks). Index futures (ES, NQ, RTY) and commodity futures (CL, GC, SI) each have unique volatility characteristics.
Index futures (ES/NQ): The daily chart is exceptionally reliable due to the enormous volume and institutional participation. The 4-hour chart aligns perfectly with US trading session blocks.
Commodity futures (CL/GC/SI): Commodities respond strongly to supply/demand fundamentals that play out over days and weeks — making them natural swing trading candidates. The daily chart is your primary tool; the weekly chart is especially important for identifying major commodity cycle levels.
Best Timeframe by Trader Type
The Part-Time Trader (Working Full-Time)
Recommended setup: Daily chart primary, Weekly chart context.
If you have a full-time job, the daily chart is your answer. Spend 30–45 minutes in the evening scanning for setups. Place your limit orders, stop-losses, and profit targets before bed. Let the trade run. Check in the following evening. This approach works — and it's sustainable.
The 4-hour chart is less practical because 4-hour candles close throughout the workday, and you won't be available to act on them in real time.
The Active Swing Trader (Part-Time or Full-Time)
Recommended setup: Weekly chart (context) → Daily chart (setup) → 4-Hour chart (entry).
If you're trading part-time with several hours per day available, or if you're a full-time trader, this 3-chart MTFA system is your ideal framework. You can act on 4-hour entry signals in real time, which allows you to enter with much greater precision and tighter stop-losses than waiting for daily closes.
The Beginner Swing Trader
Recommended setup: Daily chart only.
One timeframe. One chart. One job: learn to read trend, pullbacks, and key levels on the daily chart until you're consistently profitable. The number one mistake beginners make is overcomplicating their charts with too many timeframes, too many indicators, and too many screens. Master the daily chart first. Add timeframes later.
The Aggressive/Active Swing Trader
Recommended setup: Daily chart (setup) → 4-Hour (structure) → 1-Hour (precision entry).
Experienced traders who want maximum entry precision can use all three charts. This approach requires significant discipline, because the 1-hour chart will always show something "interesting" that tempts you to deviate from your plan. Only use this workflow after proving profitability on the Daily + 4-Hour combination.
How to Set Up Your Swing Trading Chart Workspace
Most trading platforms (TradingView, MetaTrader 4/5, ThinkOrSwim, Zerodha Kite) allow you to set up multiple chart windows simultaneously. Here's the optimal workspace for swing traders:
Window 1 (Large, left screen): Daily chart — your primary analysis frame. Clean price action with these overlays:
- 20-day EMA and 50-day EMA (trend filters)
- Volume bars (confirms breakouts and reversals)
- RSI (14) below the main chart
Window 2 (Smaller, right screen): 4-Hour chart — your entry timing frame. Same indicators:
- 20-period EMA
- RSI (14)
Window 3 (Tab or secondary screen): Weekly chart — checked once per week, not monitored constantly.
No more charts than this. Three windows. Clarity beats complexity every time.
Critical Mistakes Swing Traders Make With Timeframes
Mistake 1: Trading Too Short a Timeframe for Swing Trading
The most common error. A trader labels themselves a "swing trader" but executes from the 15-minute or 30-minute chart. This isn't swing trading — it's slow day trading. The positions are too small to absorb normal market noise, stop-outs become routine, and the trader wonders why their "swing strategy" keeps failing.
If your stop-loss gets hit regularly by normal intraday volatility, your timeframe is too short.
Mistake 2: Timeframe Switching Mid-Trade (Chart Hopping)
You enter a trade based on a daily chart setup. After entry, you open the 1-hour chart to "monitor" it. The 1-hour chart shows a scary bearish candle. You exit early — only to watch the trade recover and hit your original target without you.
Chart hopping is one of the most expensive habits a swing trader can develop. Once you're in a trade, the only chart you should reference is the chart you used to plan the trade. All other timeframes are irrelevant until exit.
Mistake 3: Ignoring the Weekly Chart
Trading a beautiful daily chart setup without checking the weekly chart is like sailing without checking the weather forecast. Everything can look perfect on the daily right up until price slams into a major weekly resistance zone and reverses — a level that was completely obvious if you had glanced at the weekly first.
Mistake 4: Using the Same Timeframe for All Markets
The volatility of Bitcoin, the session structure of forex, and the gap risk of stocks all demand slightly different timeframe approaches. A rigid "I only use the daily chart for everything" approach misses important nuances. Adjust your timeframe selection based on the specific characteristics of each market you trade.
Mistake 5: Ignoring Earnings and News Events
For stock swing traders specifically: even the most perfect daily chart swing setup becomes a coin flip if a major earnings report or economic announcement is due during your planned holding period. Always check the news and earnings calendar before entering a swing trade. Either adjust your position size to account for gap risk, or wait until after the event.
Mistake 6: Treating Timeframe Selection as Permanent
Your optimal timeframe may change as your experience grows. A beginner might start on the daily chart, become consistently profitable, and then add the 4-hour chart to improve entry precision. A trader who realizes they hate managing open positions for 10+ days might shift from the daily to the 4-hour as their primary frame for shorter-duration swings. Reassess periodically, but avoid constant switching.
How to Find YOUR Best Timeframe (Step-by-Step Process)
This is the process you should follow, in order:
Step 1: Decide your target holding period. How long do you want to hold a trade? 2–5 days → 4-Hour primary. 1–3 weeks → Daily primary. 3–8 weeks → Daily primary with Weekly confirmation.
Step 2: Assess your realistic screen time. Can you check charts once per day (evening)? → Daily chart. Can you check 2–3 times per day? → Add the 4-hour. Can you only check once per week? → Daily chart with wider stops.
Step 3: Start with the daily chart for 60 days. No matter your answers above, start with the daily chart on a demo account. Learn to identify trends, pullbacks, and key levels. Track 20–30 setups in a trading journal.
Step 4: Add the weekly chart after 30 days. Once you're comfortable with daily chart analysis, add the weekly chart for context. This alone will dramatically improve your win rate by preventing trades against the dominant trend.
Step 5: Add the 4-hour chart as your entry frame after 60 days. After two months of daily chart practice, introduce the 4-hour chart purely for entry timing. Don't use it for setup identification yet — only for entry triggers on setups you've already identified on the daily.
Step 6: Go live with a small account after consistent paper-trading results. Don't go live until you've had at least 20 trades on paper with a positive expectancy (average winners outsize average losers). Then start live with a fraction of your intended capital.
Step 7: Evaluate after 50 live trades. After 50 live trades on your timeframe combination, analyze your journal. Are you hitting your targets? Are stop-outs random or patterned? Do certain setups consistently outperform? Adjust your timeframe approach only based on data, not feelings.
Swing Trading Timeframe Comparison Table
Timeframe | Best Role | Trade Frequency | Signal Quality | Stop-Loss Size | Ideal For |
Weekly (W1) | Trend context | Reference only | Highest | Very wide | All traders (context) |
Daily (D1) | Primary setup chart | 8–20 setups/month | Very High | Moderate-Wide | All traders, especially beginners |
4-Hour (H4) | Entry timing | 15–40 setups/month | High | Moderate | Active traders with 2-3hr/day |
1-Hour (H1) | Precise entry trigger | 30–70 setups/month | Medium-High | Tighter | Experienced traders only |
30-Min (M30) | Day trading territory | Very High | Medium | Tight | Not recommended for swing traders |
Final Verdict: The Best Timeframe for Swing Trading in 2026
Here is the definitive answer, ranked in order of priority:
1. Daily Chart (D1) — Your Foundation This is the best single timeframe for swing trading. Clean signals, institutional alignment, manageable holding periods, and low screen-time requirements make it the professional standard. If you only ever use one chart, make it this one.
2. 4-Hour Chart (H4) — Your Entry Edge The daily chart tells you what to trade. The 4-hour chart tells you when to trade it. Used together, they create a powerful, precision-entry swing trading system that dramatically improves both entry quality and risk-to-reward ratios.
3. Weekly Chart (W1) — Your Compass Check it once a week. It takes 15 minutes and will save you from trading against dominant institutional trends. The few minutes you spend on the weekly chart are among the highest-value minutes in your trading week.
The complete professional swing trading timeframe stack: Weekly (context) → Daily (setup) → 4-Hour (entry) → Optional: 1-Hour (precision)
Master this system, apply it consistently, and document every trade in a journal. The traders who dominate swing trading aren't the ones who found a magic timeframe — they're the ones who built mastery on a specific timeframe combination and had the discipline to stick to it through drawdowns and winning streaks alike.
Start on the daily chart. Add the weekly for context. Add the 4-hour for entries. Trade with the trend. Manage your risk. Repeat.
FAQs
What is the best timeframe for swing trading? The daily chart (D1) is the best primary timeframe for most swing traders. It offers the optimal balance of signal reliability, manageable trade frequency, and low screen-time requirements. Pair it with the 4-hour chart for entry timing and the weekly chart for trend context.
Is the 4-hour or daily chart better for swing trading? Neither is better in isolation — they serve different roles. The daily chart identifies your setup and defines the trade. The 4-hour chart times your entry with precision. Most professional swing traders use both together rather than choosing one over the other.
Can beginners use the 4-hour chart for swing trading? Yes, but start with the daily chart first. The daily chart teaches you to read trends, pullbacks, and key levels without the complexity of timing intraday entries. After 1–2 months of daily chart practice, add the 4-hour chart as your entry frame.
What is the best timeframe for swing trading forex? The daily chart for setup analysis and the 4-hour chart for entries, with the weekly chart for context. Forex benefits more from the 4-hour chart than other markets because 4-hour candles align with major trading session boundaries (Asian, European, North American).
What is the best timeframe for swing trading stocks? The daily chart is non-negotiable for stock swing trading due to overnight gap risk. Use the 4-hour chart during regular trading hours for entry timing, and always check the weekly chart for major structural levels.
What is the best timeframe for swing trading crypto? The daily chart for Bitcoin and major altcoins. For smaller altcoins with lower liquidity, stick exclusively to the daily chart. The 4-hour chart can work for high-liquidity crypto, but the 24/7 nature of crypto means 4-hour candles that form during off-peak hours (late night, weekends) are less reliable.
How many timeframes should a swing trader use? Three: a context chart (weekly), a setup chart (daily), and an entry chart (4-hour or 1-hour). More than three timeframes creates analysis paralysis. Fewer than two means you're missing critical information. Three is the professional standard.
Can I swing trade on the 1-hour chart? Technically yes, but positions typically hold for only 1–4 days, which blurs the line with day trading. The 1-hour chart works best as a precision entry tool within a daily-chart framework, not as a standalone swing trading timeframe.
What is the biggest mistake swing traders make with timeframes? Chart hopping — entering a trade based on one timeframe and then switching to a shorter timeframe mid-trade. This almost always leads to premature exits as intraday noise looks alarming up close. Commit to your entry timeframe and manage the trade from it.
暗号資産に規律あるリスクを適用する準備はできていますか?Audacity Capitalの新しい暗号資産商品を探索し、あなたの取引戦略を持ち込んでください。
詳細を見るニュースレター
ニュースレターに登録して最新情報を入手。