
Fibonacci Extensions: How to Set Profit Targets Like a Pro

What Are Fibonacci Extensions?
Fibonacci retracements tell you where price might pull back to. Fibonacci extensions tell you where price might go next, beyond the original swing high or low. That distinction matters more than most traders realize.
While retracements help you find entries during a pullback, extensions help you set profit targets before the trade is even open. Used correctly, they shift your trading from guesswork to a structured, probability-based approach.
The levels come from the same Fibonacci sequence that governs retracements, with ratios derived from the mathematical relationships between numbers in that sequence. What makes them powerful is that markets, by nature, tend to respect these levels. Not because of any mystical property, but because millions of traders are watching the same levels at the same time.
How Fibonacci Extension Levels Are Calculated
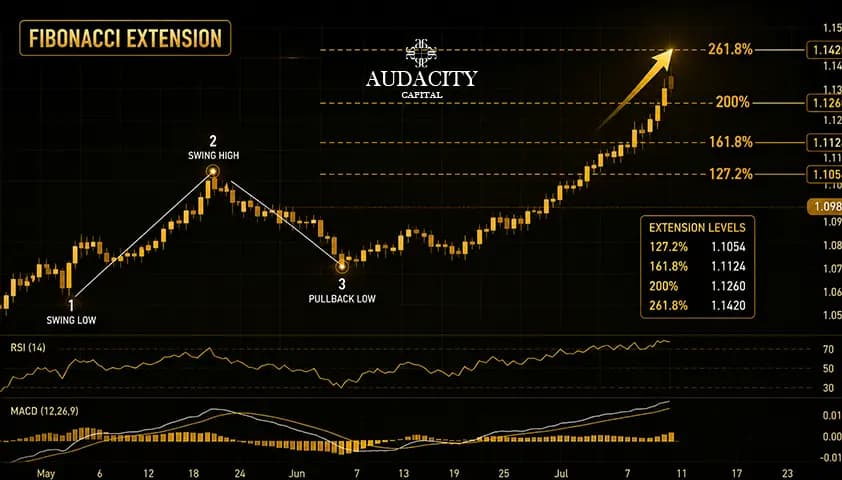
To draw Fibonacci extensions, you need three points:
- Point A: the start of a significant swing (swing low in an uptrend, swing high in a downtrend)
- Point B: the end of that swing (the swing high in an uptrend, swing low in a downtrend)
- Point C: the end of the pullback (the retracement low before the continuation move begins)
Once those three points are identified, your charting platform calculates the extension levels automatically. The output tells you where the next leg of the move could reach.
Think of it this way: A to B is the first impulse. B to C is the correction. The extension levels tell you where the A to B move is likely to project to after the C correction completes.
The Key Fibonacci Extension Levels
Level | Ratio | What Traders Watch For |
61.8% | 0.618 | The 'golden ratio' most reliable pullback zone. Price often stalls or reverses here before continuing the trend. |
78.6% | 0.786 | Deep retracement level. Still within trend territory but a last line of defence before trend invalidation. |
100% | 1.000 | Measured move. Price returns to the origin of the prior swing. Key flip zone. |
127.2% | 1.272 | First extension target beyond the prior swing. Common destination after a breakout. |
161.8% | 1.618 | The golden extension. High-probability profit target, especially in strong trending markets. |
200% | 2.000 | Extended target for explosive moves. Less common but significant when reached. |
261.8% | 2.618 | Rare but powerful. Marks exhaustion zones in parabolic runs. |
Of these, the 127.2%, 161.8%, and 261.8% levels carry the most weight. The 161.8% extension, in particular, is the one seasoned traders watch most closely. It is the level where the most confluence tends to appear, and where profit targets are most commonly set.
Fibonacci Extensions vs. Retracements: What's the Difference?
A common point of confusion, especially for newer traders, is understanding where retracements end and extensions begin.
Fibonacci Retracement levels sit between 0% and 100% of the prior swing. They measure how far price has pulled back from the recent move. The most watched retracement levels are 38.2%, 50%, and 61.8%.
Extension levels sit beyond the 100% mark. They project where price could move once it resumes the original trend direction and surpasses the prior swing high or low.
Retracements answer the question: where do I get in? Extensions answer the question: where do I get out?
When you combine both tools, you have a complete trade structure: entry on the retracement, target at the extension.
How to Use Fibonacci Extensions in a Live Trade
Here is a practical, step-by-step approach to applying Fibonacci extensions in a trending market:
- Identify a clean impulse move. The swing from Point A to Point B should be clear and decisive, not choppy.
- Wait for the correction to form. Let price pull back from Point B to Point C. The correction should respect one of the major retracement levels (38.2%, 50%, or 61.8%) for the setup to carry weight.
- Anchor your extension tool. Plot from A to B to C using the Fibonacci extension tool on your platform.
- Mark your targets. Note the 127.2%, 161.8%, and 261.8% extension levels. These become your potential profit targets for the trade.
- Set your take profit levels. Many traders take partial profits at the 127.2% level, hold a portion to the 161.8%, and trail a runner toward the 261.8% if momentum holds.
This method works across all timeframes, from the 5-minute chart on intraday trades to the weekly chart on swing positions. The logic remains the same regardless of the instrument.
Fibonacci Extensions in Trending Markets
Extensions work best in markets that are clearly trending. In ranging or choppy markets, price tends to stall and reverse unpredictably, making extension targets unreliable.
In a strong uptrend, the sequence often plays out like this: price rallies from a swing low, pulls back to the 61.8% retracement, and then continues higher to the 127.2% or 161.8% extension. Rinse and repeat as the trend develops.
In a downtrend, the same logic applies in reverse. Price drops, bounces to a retracement level, then continues lower to the extension targets.
The more aligned an extension level is with the prevailing trend, the higher the probability it gets reached. Trading extension targets with the trend is almost always more reliable than trading them against it.
Confluence: Why Extension Levels Work Better in Combination
No single indicator or tool gives you certainty in trading. What increases probability is confluence, which means two or more independent signals pointing to the same level.
When a Fibonacci extension level aligns with any of the following, the significance of that level increases substantially:
- A previous structural high or low
- A round number (such as 1.2000 on a currency pair or 2000 on Gold)
- A key moving average (such as the 200 EMA on a higher timeframe)
- A trendline or channel boundary
- A daily or weekly open/close level
The more confluence at a given extension level, the more confidence you can take into setting your profit target at that zone rather than a different one.
Common Mistakes Traders Make With Fibonacci Extensions
Understanding a tool is one thing. Using it correctly under live conditions is another. These are the most common errors traders make with Fibonacci extensions:
Using an Imprecise Swing
Your extension is only as accurate as the swing you use to draw it. If you pick an arbitrary high or low rather than a significant structural swing, the levels become unreliable. Always anchor your tool on obvious, clean swing points.
Treating Levels as Exact Prices
Extension levels are zones, not precise lines. Price often overshoots or falls just short before reversing. Give yourself a buffer around key levels rather than expecting price to turn on the exact pip.
Ignoring the Bigger Timeframe
A 161.8% extension on a 15-minute chart may sit directly into a strong resistance zone on the 4-hour chart. Always check the higher timeframe before committing to an extension target. A level that looks like a clear target on the lower timeframe can become a ceiling if it contradicts the higher timeframe structure.
Using Extensions in Ranging Markets
As noted earlier, extensions are a trending market tool. If price has been consolidating for an extended period, there is no impulse-correction structure to work from, and extension levels will be arbitrary at best.
A Practical Example: EUR/USD on the 4-Hour Chart
To bring this together, consider a hypothetical setup on EUR/USD:
- EUR/USD forms a clear bullish impulse from 1.0800 (Point A) to 1.1000 (Point B)
- Price then pulls back and finds support at 1.0878, which aligns with the 61% retracement of the A-B move (Point C)
- A bullish confirmation candle forms at Point C, signalling the correction is likely complete
Drawing the Fibonacci extension from A to B to C gives the following targets:
- 127.2% extension: approximately 1.1055
- 161.8% extension: approximately 1.1124
- 261.8% extension: approximately 1.1284
A disciplined approach would be to enter at Point C with a stop below the swing low, take partial profits at 127.2%, and look to hold toward 161.8% as the primary target. If momentum is unusually strong, the 261.8% level becomes a runner target.
This is not a guaranteed outcome. It is a structured, probability-based trade with clear risk parameters. That is the difference between using Fibonacci extensions correctly and hoping for the best.
Key Takeaways
The essentials from this guide, summarised for quick reference:
- Fibonacci extensions project where price could move after completing a retracement, using three anchor points: A (swing origin), B (swing end), and C (pullback end).
- The most important extension levels are 127.2%, 161.8%, and 261.8%. The 161.8% level, the golden extension, carries the most weight in trending markets.
- Extensions work best in clearly trending markets. In ranging or choppy conditions, the levels lose their reliability.
- Always combine extension levels with confluence from structure, round numbers, moving averages, or trendlines. A level with multiple confluences is far stronger than one standing alone.
- Retracements answer where to enter. Extensions answer where to exit. Together, they give you a complete trade structure.
- Never treat extension levels as exact price points. They are zones. Give yourself a buffer and confirm with price action before acting.
- Partial profit-taking is the professional approach: scale out at 127.2%, hold the core toward 161.8%, and trail a runner if momentum supports the 261.8% target.
Related Fibonacci Tools
Fibonacci Extensions are just one of several Fibonacci tools used by forex traders. To build a more complete trading strategy, consider exploring:
- Fibonacci Retracement – Identify potential support and resistance levels during pullbacks.
- Fibonacci Fan – Analyse dynamic support and resistance levels within trending markets.
- Fibonacci in Forex Trading – Learn how all major Fibonacci tools work together to improve entries, exits, and risk management.
Final Thoughts
Fibonacci extensions are not a magic formula. They are a structured way to define where the market is likely to go, based on historical mathematical patterns that repeat across all instruments and timeframes.
The traders who use them well do not treat them as standalone signals. They combine them with trend analysis, price action, and confluence from other tools to build high-probability setups with clearly defined targets before a trade is placed.
If you have been setting profit targets arbitrarily or closing trades too early out of fear, Fibonacci extensions give you an objective, repeatable framework for knowing when to hold and when to take profits.
Funded traders do not close winners based on emotion. They close them at levels that the market itself has already told them to watch.
Start with the 161.8% level. Mark it on your next setup. See how price reacts. In time, you will understand why it is the single most-watched extension level in all of technical analysis.
Frequently Asked Questions
Retracement levels sit between 0% and 100% of a prior swing and identify where price might pull back to before continuing. Extension levels sit beyond 100% and project where price might reach once it resumes the trend. Retracements help with entries; extensions help with profit targets.
The 161.8% extension, also called the golden extension, is the most widely watched. It tends to attract the most confluence with other technical factors and is the standard profit target for trend-following traders. The 127.2% level is also highly reliable as a first target.
Yes. The logic applies across all timeframes, from intraday charts to weekly charts. However, extension levels drawn on higher timeframes carry more weight than those on lower timeframes. Always check that your lower timeframe target is not sitting directly into a strong resistance or support zone on the higher timeframe.
Absolutely. In a downtrend, Point A is the swing high, Point B is the swing low, and Point C is the end of the corrective bounce. Extension levels then project downward from C, giving you potential targets for short positions. The same levels apply, just in the opposite direction.
If price breaks through an extension level with strong momentum and closes convincingly beyond it, the next extension level becomes the new target. For example, if price clears the 127.2% level cleanly, the 161.8% level takes over as the primary target. Fibonacci extensions are not walls, they are waypoints.
They apply to all liquid instruments, including forex pairs, indices, commodities, and cryptocurrencies. The key requirement is that the instrument exhibits clear trending behaviour with identifiable swing points. Thinly traded or illiquid instruments tend to produce noisier, less reliable results.
No. Fibonacci extensions are most effective when used as part of a broader trading approach. Combine them with trend analysis to ensure you are trading in the direction of the market, price action signals at Point C to confirm the resumption of the trend, and confluence from other technical factors to validate your extension targets.
On TradingView, select the Fibonacci Extension tool from the drawing toolbar and click Point A, then Point B, then Point C. The platform draws the levels automatically. On MT4 and MT5, use the Fibonacci Expansion tool (Insert > Fibonacci > Expansion) and apply the same three-point method. Ensure your platform is set to display the 127.2%, 161.8%, and 261.8% levels, as some default settings only show basic levels.
Ready to trade what you know? Audacity Capital funds traders who are ready to stop practising and start performing. Explore the Ability Challenge, Ability One, and FTP Instant Funding programmes and find the path that fits your style.
暗号資産に規律あるリスクを適用する準備はできていますか?Audacity Capitalの新しい暗号資産商品を探索し、あなたの取引戦略を持ち込んでください。
詳細を見るニュースレター
ニュースレターに登録して最新情報を入手。
ソーシャルコミュニティに参加
関連記事
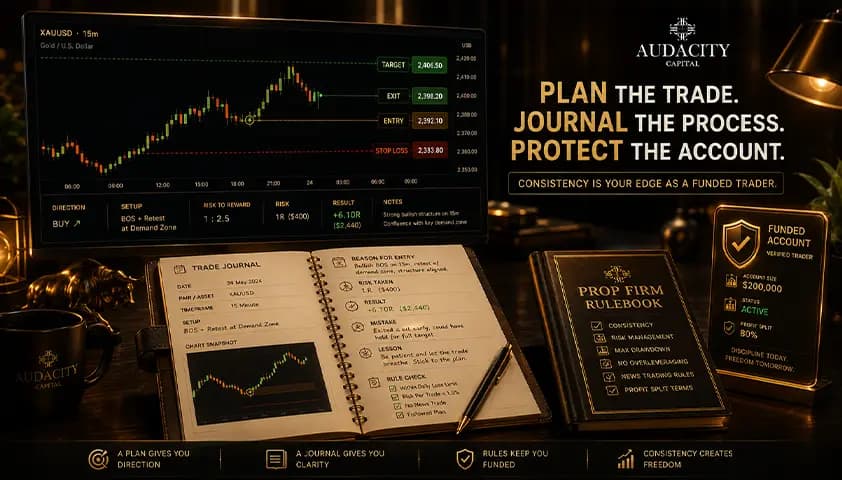
How to Keep a Trading Journal as a Funded Trader
Your trading journal as a funded trader is a survival tool, not a diary. Track your distance to the limits and catch the habits that quietly blow accounts.

Best Time to Trade Forex in 2026: The Complete Session-by-Session Guide
Discover the best time to trade forex in 2026. This expert guide covers all four sessions, London-New York overlap, best days, worst days, currency pair timing, and a strategy-based schedule to maximize your trading edge.

Prop Firm vs Broker: Which One Is Better for Traders in 2026?
Prop firm vs broker explained clearly. Compare costs, risks, rules, capital, payouts, and control to choose the right trading path in 2026.

Range Trading Strategy: The 10 Best Range Trading Strategies in 2026
Discover the 10 best range trading strategies for forex, stocks, and indices. Learn how to identify ranging markets, manage risk, and trade support and resistance successfully.