



Liquidity Sweeps Explained: How to Identify and Trade Them



Introduction
A liquidity sweep is a price move beyond a key high or low that triggers resting orders before price reverses back in the opposite direction.You spot a clean double bottom. You buy, tuck your stop neatly under the lows, and wait. Price dips a few pips below your stop, takes you out, then rockets upwards exactly as you predicted. Without you.
If that sounds familiar, you have been on the wrong side of a liquidity sweep.
A liquidity sweep is one of the most important ideas in smart money and ICT-style trading because it explains something retail traders experience constantly but rarely understand. Price does not move randomly through obvious levels. It is drawn towards areas where orders are clustered, and it often raids those areas before making its real move.
This guide breaks down what a liquidity sweep is, where liquidity builds up, why sweeps happen, and how to separate a sweep from a genuine breakout. We will also walk through two entry models, stop and target placement, and a full worked example on GBP/USD so you can see how all the pieces fit together.
What Is a Liquidity Sweep?
A liquidity sweep happens when price moves beyond a key high or low, triggers the orders resting there, and then quickly reverses back in the opposite direction.
The key word is reverses. Price takes out the level, collects the orders sitting beyond it, and fails to continue. On a chart, this usually shows up as a wick poking through a swing high or low, followed by a candle closing back inside the prior range.
There are two types:
- Sell-side liquidity sweep: Price drops below a low, triggering sell stops from long positions and sell orders from breakout traders, then reverses higher. This is typically a bullish signal.
- Buy-side liquidity sweep: Price spikes above a high, triggering buy stops from short positions and buy orders from breakout traders, then reverses lower. This is typically a bearish signal.
A sweep on its own is not a trade. It is information. It tells you that one side of the market has just been cleared out, and it opens the door for a potential move in the other direction.
Bullish vs Bearish Liquidity Sweep
Liquidity sweeps can occur in either direction depending on which side of the market liquidity is taken.
Type | What happens | Potential direction |
|---|---|---|
Bullish liquidity sweep | Price sweeps sell-side liquidity below a significant low and then reverses higher. | Bullish |
Bearish liquidity sweep | Price sweeps buy-side liquidity above a significant high and then reverses lower. | Bearish |
A bullish liquidity sweep typically occurs when price moves below a previous low, equal lows, or another area containing sell-side liquidity before reversing higher. A bearish liquidity sweep occurs when price moves above a previous high, equal highs, or another area containing buy-side liquidity before reversing lower.
The sweep itself is not confirmation of a reversal. Traders may look for additional confirmation, such as rejection, displacement, or a market structure shift, before considering an entry.
Where Liquidity Sits on a Chart
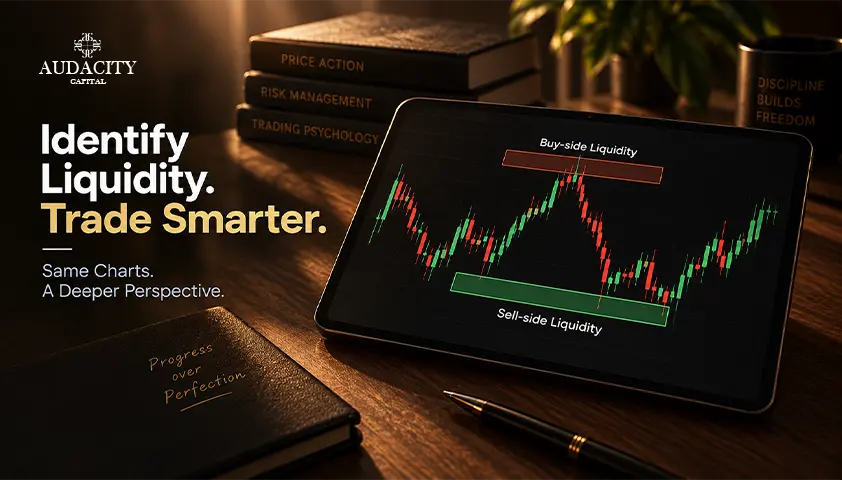
Liquidity is simply a concentration of resting orders. Those orders tend to gather in predictable places, because most traders learn the same rules about where to put their stops and entries.
Swing highs and swing lows
Every obvious swing point has stops behind it. Traders who are long place stops below recent lows. Traders who are short place stops above recent highs.
Equal highs and equal lows
When price forms two or three highs or lows at almost the same level, it looks like strong support or resistance to most traders. In smart money terms, it is a pool of liquidity waiting to be taken. The cleaner and more "obvious" the level, the more orders tend to sit behind it.
Session highs and lows
The high and low of the Asian session are classic liquidity targets for London. The London session high and low often become targets for New York. Traders who trade breakouts of these ranges add even more orders beyond them.
Previous day, week and month highs and lows
Higher timeframe reference points attract a large number of stops and pending orders. A sweep of the previous day's low, for example, carries more weight than a sweep of a minor intraday swing.
Trendline liquidity
When price respects a trendline three or four times, many traders buy each touch with stops just beneath the line. That creates a line of stops running along the trend, which can be swept in one sharp move.
Round numbers
Levels such as 1.3000 on GBP/USD, 150.00 on USD/JPY or $2,000 on gold attract clusters of orders simply because people like round numbers.
Why Liquidity Sweeps Happen
Large participants such as banks, funds and institutional desks trade enormous size. They cannot simply click buy on a 500 lot position without moving price against themselves. They need a large pool of opposing orders to fill against.
If an institution wants to buy in size, it needs sellers. Where are sellers concentrated? Below the lows, where long traders have their sell stops and breakout traders have their sell entries. When price pushes into that area, all those sell orders trigger at once, giving the large buyer the volume it needs.
Once that liquidity has been absorbed, there is no more selling pressure left beneath the level. Price reverses, often sharply, because the large buyer has filled and the weak sellers have been flushed out.
It is worth being realistic here. Not every sweep is a deliberate institutional manoeuvre, and nobody outside those desks can confirm their intent. A more useful way to think about it is this: markets move towards liquidity because that is where transactions can happen efficiently. The sweep concept gives you a practical framework for reading that behaviour, whatever the precise cause on any given day.
Liquidity Sweep, Liquidity Grab, Stop Hunt: Is There a Difference?
Liquidity grab vs liquidity sweep: These terms are often used interchangeably, although some traders use “liquidity grab” to describe a shorter move through a liquidity level, while “liquidity sweep” can refer to a broader move that takes liquidity above a high or below a low. A stop hunt is another commonly used term for similar price behavior.
The terminology is not standardized across trading communities, so the exact distinction can vary. In this guide, we use liquidity sweep as the primary term for a move that takes liquidity from an obvious high or low before showing a potential reversal or continuation.
- Liquidity grab: A quick, wick-based move through a level that closes back inside on the same candle.
- Liquidity sweep: A move that may run a little further, sometimes over several candles, before reversing.
- Stop hunt: A more informal, retail term describing the same event from the point of view of the trader who got stopped out.
Do not get too attached to the labels. What matters is the behaviour: price takes out an obvious level and fails to continue.
How to Identify a Liquidity Sweep
Liquidity Sweep vs Breakout
A liquidity sweep can initially look similar to a breakout because price moves beyond a previous high or low. The key difference is what happens after that level is taken.
A liquidity sweep occurs when price moves through an obvious liquidity level and then shows signs of rejection or reversal. A breakout occurs when price moves beyond the level and continues in the same direction with sustained momentum.
Here are the signs that tip the balance towards a sweep.
1. Candle closes back inside the range
A sweep usually leaves a wick beyond the level with the body closing back inside. A genuine breakout usually closes decisively beyond the level and holds there.
2. No follow-through
After a true breakout, price tends to continue with momentum. After a sweep, price stalls beyond the level and quickly returns.
3. Displacement in the opposite direction
A strong, impulsive move away from the swept level can provide evidence that price is rejecting the liquidity area. Displacement may also leave a fair value gap behind it
4. A market structure shift
On a lower timeframe, price may break a recent internal swing point in the new direction. After a sell-side sweep, for example, this could mean breaking above a recent lower high. A market structure shift can provide additional confirmation that the short-term price direction has changed.
5. Higher timeframe context
A sweep of sell-side liquidity into a higher timeframe demand zone, in a bullish daily trend, is far more convincing than the same pattern in the middle of a strong downtrend.
If you only remember one rule, remember this: the sweep alone is not confirmation. The reaction after the sweep is.
The Anatomy of a High-Probability Sweep
The strongest sweep setups tend to follow a similar sequence.
- Higher timeframe bias. Establish direction on the daily or four hour chart. Are you looking for buys or sells?
- An obvious liquidity pool. Identify the equal lows, session low, previous day low or similar level that price is likely to target.
- A point of interest. Ideally, the liquidity sits near or inside a higher timeframe order block, demand or supply zone, or fair value gap.
- The sweep. Price trades through the level and triggers the resting orders.
- Rejection. Price closes back inside the range.
- Displacement and structure shift. An impulsive move breaks lower timeframe structure in your intended direction.
- The retracement. Price pulls back into the fair value gap or order block created by the displacement, giving a defined entry.
When all seven elements line up, you have a setup with context, confirmation and a clear invalidation point.
Liquidity Sweep Trading Strategy
A liquidity sweep trading strategy combines a clear liquidity level with confirmation that price has rejected that level. Rather than entering simply because price has taken out a high or low, traders typically wait for evidence that the move is reversing.
How to Trade a Liquidity Sweep
- Identify the higher-timeframe bias
Use the daily or four-hour chart to establish whether you are primarily looking for bullish or bearish setups. - Mark the liquidity pool
Identify an obvious high, low, equal high, equal low, session level, or previous-day level where orders may be concentrated. - Wait for the sweep
Let price move beyond the identified level and take the liquidity. Avoid entering simply because the level has been touched or broken. - Look for rejection
Watch for price to move back inside the previous range or show a clear rejection of the swept level. - Confirm the reversal
Look for displacement and a market structure shift in the intended direction. This provides additional evidence that the move may be reversing rather than continuing as a breakout. - Choose an entry
Depending on your approach, enter after the rejection or wait for a retracement into an area such as a fair value gap or order block. - Define the invalidation point
Place the stop beyond the sweep extreme or another clearly defined invalidation level. - Target opposing liquidity
Look for the next significant liquidity pool, such as an opposing swing high or low, session extreme, or previous-day level.
Timing: Sessions and Kill Zones
Sweeps can happen at any time, but they cluster around periods when volume enters the market.
London open
The Asian session is typically quieter and forms a range. When London opens, liquidity floods in, and it is very common to see price sweep one side of the Asian range before moving decisively in the other direction.
New York open
New York often targets the high or low set during London. A classic pattern is London pushing in one direction, then New York sweeping the London extreme and reversing.
High impact news
Central bank decisions from the Bank of England, European Central Bank, Federal Reserve or Bank of Japan, along with major data releases, can produce violent sweeps on both sides within minutes. These can be tradeable, but spreads widen and slippage increases, so many traders wait for the dust to settle before looking for a setup.
Quiet periods
Sweeps during low volume periods, such as late in the New York afternoon or during holiday trading, are less reliable because there is less genuine participation behind the reversal.
Two Entry Models for Trading Sweeps
Model 1: Aggressive entry
Enter as soon as a candle closes back inside the range after sweeping the level.
- Pros: Better price, larger reward relative to risk, you catch the move early.
- Cons: Lower win rate, because you are entering before structure confirms the reversal. Some of these "sweeps" turn out to be the first leg of a real breakout.
This approach suits experienced traders with very strong higher timeframe context.
Model 2: Confirmation entry
Wait for the sweep, then a market structure shift with displacement on a lower timeframe, then enter on a retracement into the fair value gap or order block left behind.
- Pros: Higher probability, clearer invalidation, filters out many false signals.
- Cons: Sometimes price does not retrace and you miss the move. Your entry price is also less favourable than the aggressive model.
For most traders, especially those working within strict drawdown limits, the confirmation model is the more sustainable choice. Missing a trade costs nothing. Taking a poor one does.
Stop Loss Placement and Targets

Where to place the stop
The logical stop sits beyond the extreme of the sweep. If price sweeps a low and reverses, the sweep low is your invalidation. If price trades back through it, the idea is wrong.
Add a small buffer to account for spread and minor noise. The size of the buffer depends on the instrument and timeframe. A few pips may be enough on EUR/USD during London, while gold or indices usually need more room.
Avoid placing your stop exactly at an obvious level. That is, after all, the entire lesson of this article.
Where to take profit
Sweeps are about liquidity, so your targets should be liquidity too. Once one side of the market has been cleared, price often travels towards the opposing pool.
- After a sell-side sweep, look at the nearest buy-side liquidity: recent swing highs, equal highs, the session high or the previous day high.
- Consider partial profits at the first internal high and a runner towards the higher timeframe target.
- Unfilled fair value gaps in the direction of the trade can also act as intermediate targets.
Always check that the distance to your realistic target justifies the risk. If a setup only offers 1:1 to the nearest liquidity, it may not be worth taking.
Adding Confluence to a Sweep Setup
A sweep becomes more meaningful when it lines up with other factors. Useful confluences include:
- Higher timeframe order blocks or supply and demand zones at the swept level.
- Fair value gaps left by the displacement, which provide entry zones.
- Break of structure in the direction of the higher timeframe trend.
- Premium or discount pricing relative to the daily range, for example sweeping lows while price is already in the lower part of a bullish range.
- Session timing, particularly London and New York opens.
- Correlated markets, such as EUR/USD and GBP/USD sweeping comparable lows at the same time, or one failing to make a new low while the other does (often called SMT divergence).
You do not need every confluence on every trade. Two or three strong, independent factors are usually far better than a checklist of ten weak ones.
Common Mistakes Traders Make With Sweeps
Calling every broken level a sweep
Hindsight makes every reversal look like a sweep. In real time, many levels break and keep going. Without confirmation, you are simply guessing.
Ignoring the higher timeframe
A sell-side sweep in a strong daily downtrend is more likely to be a brief pause than a reversal. Trade sweeps in the direction of your bias whenever possible.
Entering too early
Buying the moment price dips below a low, before any rejection, is catching a falling knife with a smart money label on it.
Placing stops too tight
Stops placed exactly at the sweep low, with no buffer, are vulnerable to a second sweep. Markets frequently take the same level twice.
Overtrading minor liquidity
Not every tiny swing point is worth trading. Focus on significant, obvious levels where a meaningful amount of orders are likely to sit.
Forgetting risk management
A good sweep setup does not change the maths of risk. Keep position sizes consistent and respect your daily and overall loss limits.
Liquidity Sweep Checklist
Before considering a liquidity sweep setup, ask:
- Is there an obvious high or low where liquidity may be concentrated?
- Has price actually taken that liquidity level?
- Did price reject the level rather than continue through it?
- Is there clear displacement away from the swept level?
- Has market structure shifted?
- Does the sweep align with the higher-timeframe context?
- Is there a clear invalidation level for the setup?
- Does the potential trade offer sufficient reward relative to the risk?
A liquidity sweep should not be treated as a standalone entry signal. Use the checklist to assess the location, price reaction, market structure, higher-timeframe context, and risk before considering a trade.
Liquidity Sweep Example: GBP/USD London Open
The figures below are illustrative and designed to show the process, not to represent a real trade on a specific date.
Step 1: Higher timeframe context
On the daily chart, GBP/USD is in an uptrend, printing higher highs and higher lows. The previous day closed near its highs. On the four hour chart, price has pulled back into a bullish order block between 1.2620 and 1.2645.
Bias: bullish. We are only looking for buys.
Step 2: Mark the liquidity
During the Asian session, GBP/USD forms a tight range:
- Asian high: 1.2672
- Asian low: 1.2640
Within that range, price has also formed equal lows at 1.2638 to 1.2640. That makes the Asian low an obvious pool of sell-side liquidity, sitting right on top of the four hour order block.
The previous day high, our higher timeframe buy-side target, is at 1.2735.
Step 3: The sweep
At the London open, GBP/USD drops sharply and trades down to 1.2628, taking out the Asian low and the equal lows beneath it. Stops from overnight buyers trigger, and breakout sellers pile in.
The 15 minute candle that made the low closes back at 1.2646, inside the Asian range, leaving a long lower wick.
Step 4: Displacement and structure shift
On the five minute chart, price pushes impulsively higher and breaks above the most recent lower high at 1.2661. This is the market structure shift. The displacement leaves a fair value gap between 1.2650 and 1.2656.
Step 5: The entry
Using the confirmation model, we place a buy limit order in the fair value gap at 1.2653. Price retraces and fills the order.
Step 6: Stop and targets
- Stop loss: 1.2624, four pips below the sweep low of 1.2628
- Risk: 29 pips
- Target 1: Asian high at 1.2672 (19 pips), where we close half the position and move the stop to breakeven
- Target 2: Previous day high at 1.2735 (82 pips)
Step 7: Position sizing
Assume a $100,000 account risking 0.5% per trade, which is $500.
On GBP/USD, one standard lot is worth roughly $10 per pip. With a 29 pip stop, the risk per standard lot is about $290.
Position size = $500 ÷ $290 = approximately 1.72 lots
Step 8: The outcome
Price rallies through the Asian high, where half the position is closed for 19 pips. The stop moves to breakeven. Later in the London session, GBP/USD reaches the previous day high at 1.2735, and the remaining half is closed for 82 pips.
- Half position (0.86 lots) at +19 pips: about $163
- Half position (0.86 lots) at +82 pips: about $705
- Total: approximately $868, or roughly 1.7R on the original $500 risk
What made this setup work
- Clear bullish bias on the daily chart
- An obvious liquidity pool (Asian low and equal lows)
- The sweep landing inside a four hour order block
- Rejection, displacement and a structure shift before entry
- A defined invalidation point and a liquidity-based target
Just as importantly, the trade would have been invalidated if price had closed below 1.2624. Had that happened, the loss would have been capped at the planned $500.
Key Takeaways
- A liquidity sweep occurs when price takes out a key high or low, triggers the orders beyond it, and then reverses.
- Liquidity gathers at swing points, equal highs and lows, session ranges, previous day and week levels, trendlines and round numbers.
- Sweeps happen because large orders need opposing liquidity to fill against.
- The sweep itself is not confirmation. Rejection, displacement and a market structure shift are.
- The best setups combine higher timeframe bias, an obvious liquidity pool and a point of interest.
- London and New York opens are prime times for sweeps.
- Place stops beyond the sweep extreme with a sensible buffer, and target the opposing pool of liquidity.
- Consistent risk management matters more than any single setup.
FAQ
They describe very similar price behaviour. A false breakout is a traditional technical analysis term for price breaking a level and failing to hold. A liquidity sweep describes the same event through the lens of order flow, focusing on the stops and pending orders being triggered.
Use higher timeframes such as the daily and four hour charts to identify bias and major liquidity levels. Then use the 15 minute, five minute or one minute charts to spot the sweep and confirm the structure shift. The exact combination depends on your trading style.
The concept applies to any liquid market where traders place stops around obvious levels, including forex, indices, gold, oil and cryptocurrencies. Behaviour varies by instrument, so adjust your stop buffers and expectations accordingly.
Avoid placing stops exactly at obvious levels. Give your stop room beyond the true invalidation point, size your position down to keep risk constant, and consider waiting for a sweep to happen before entering rather than entering just ahead of an obvious liquidity pool.
Yes, and it happens more often than many traders expect. This is one reason why a small buffer beyond the sweep extreme, and waiting for confirmation, can make a real difference.
Buy-side liquidity sits above highs, made up of buy stops from short sellers and buy entries from breakout traders. Sell-side liquidity sits below lows, made up of sell stops from long positions and sell entries from breakout traders.
Yes. At its core, a sweep is a failed break of a significant level followed by a reversal. Traders using classic price action, support and resistance, or volume analysis can all incorporate the idea without adopting the full smart money framework.

暗号資産に規律あるリスクを適用する準備はできていますか?Audacity Capitalの新しい暗号資産商品を探索し、あなたの取引戦略を持ち込んでください。
詳細を見るニュースレター
ニュースレターに登録して最新情報を入手。
ソーシャルコミュニティに参加

関連記事

Order Flow Imbalance: How to Read Buy and Sell Pressure
Learn what order flow imbalance means, how footprint and order book readings differ, and how traders assess buy and sell pressure with context.

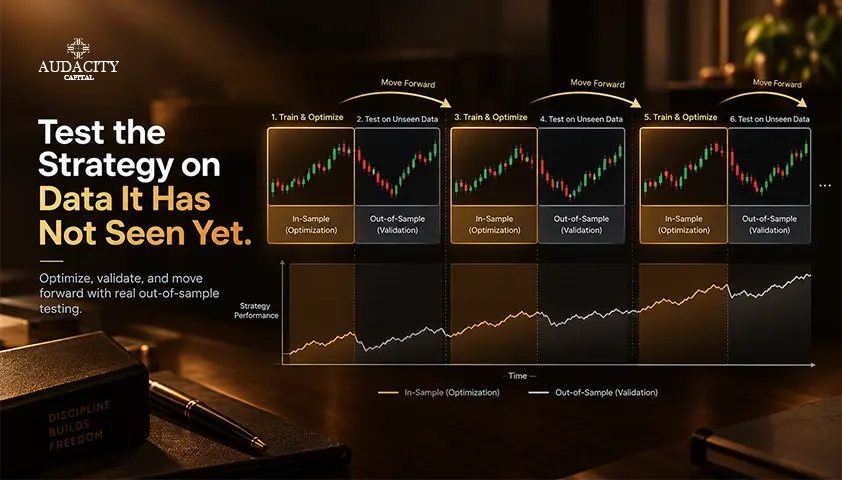
Walk-Forward Analysis in Trading: A Practical Guide
Learn how walk-forward analysis works in trading: in-sample and out-of-sample windows, rolling vs anchored designs, a worked example, and how to read results.
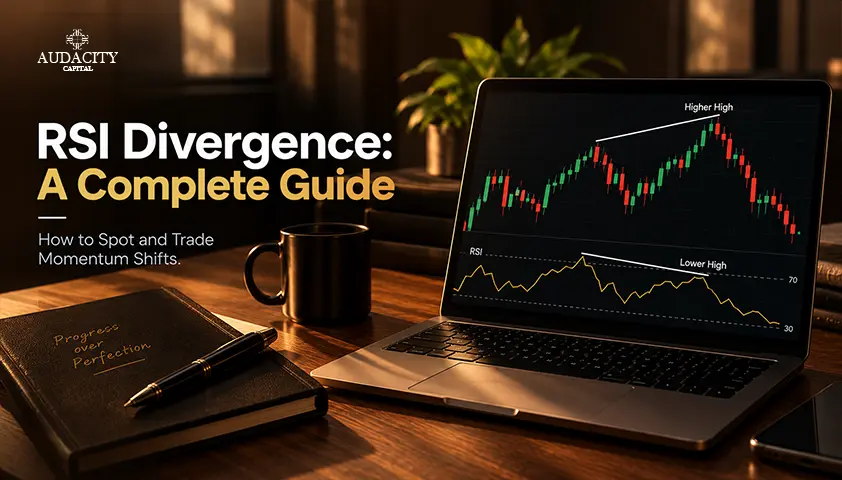
RSI Divergence: A Complete Guide to Spotting and Trading Momentum Shifts
Learn what RSI divergence is, explore bullish, bearish and hidden divergence, and discover how to identify, confirm and trade RSI divergence.
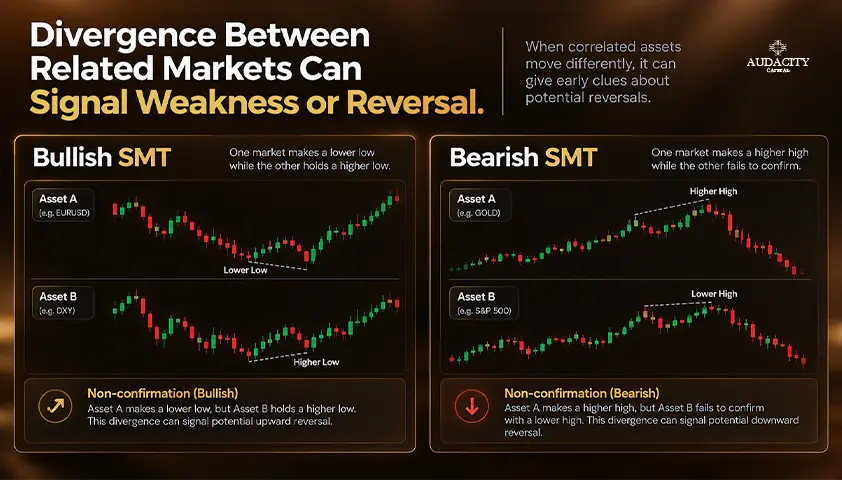
SMT Divergence in Trading: Bullish and Bearish Examples
Learn what SMT divergence means, how bullish and bearish setups form, which markets traders compare, and how to confirm signals and manage risk.