



7 Best Forex Trading Indicators in 2026 & How to Use Them


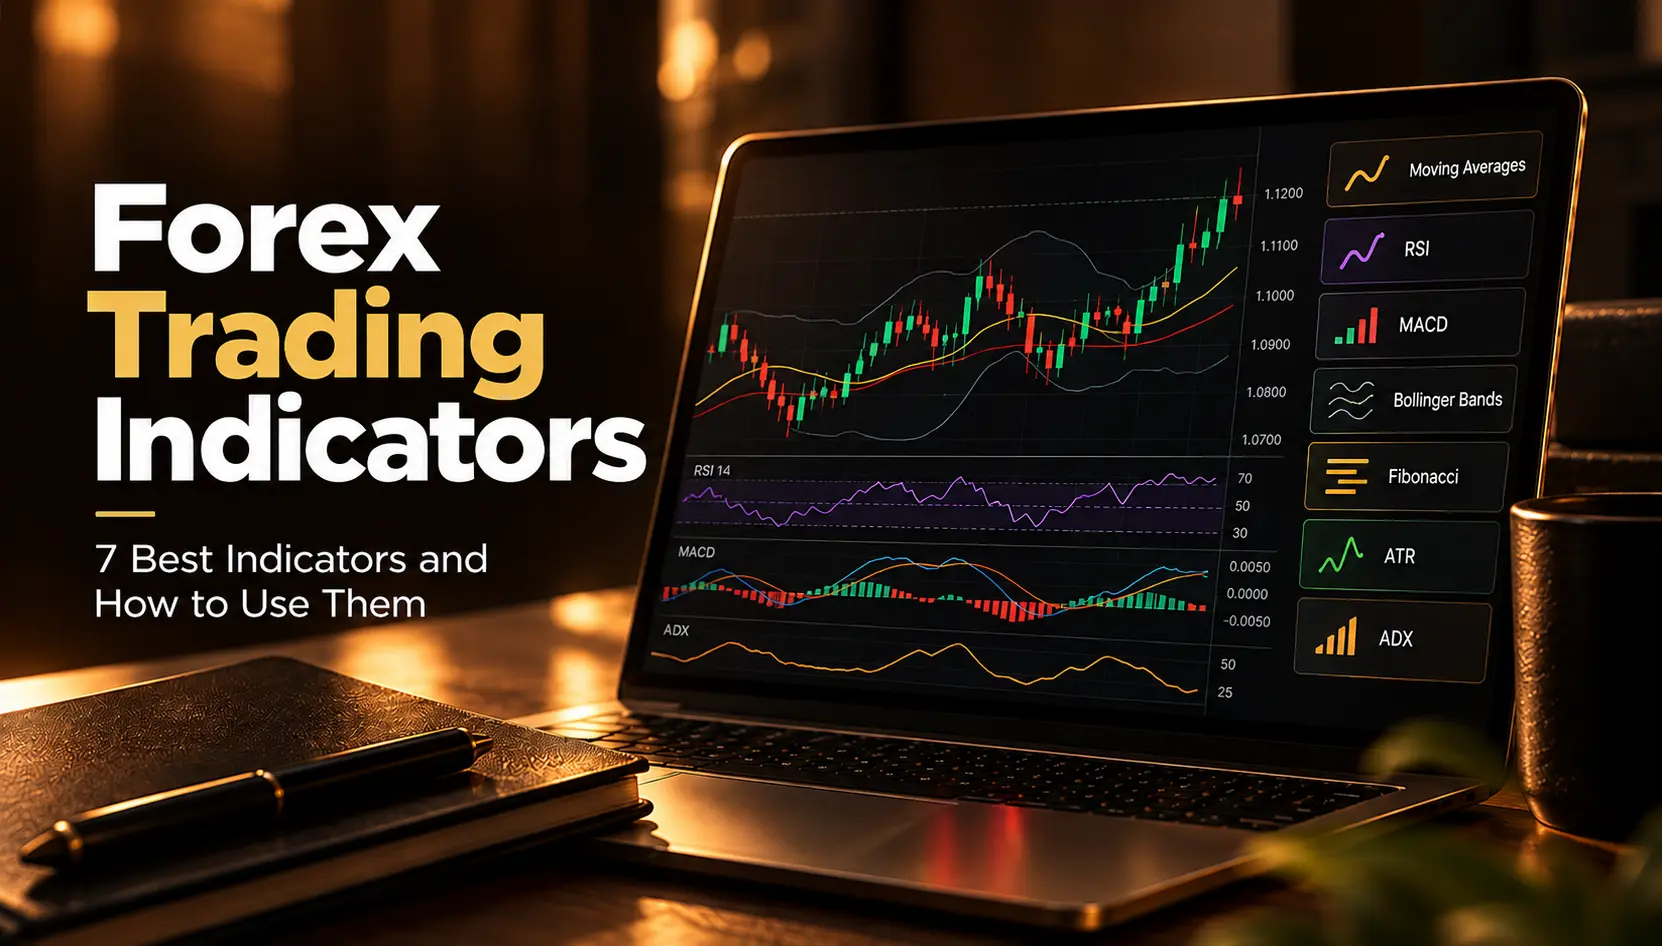
Forex trading involves analyzing currency price movements, identifying market trends, and deciding when to enter or exit trades. Forex trading indicators can help traders interpret market data, recognize potential trading opportunities, and make more structured decisions.
From moving averages and the Relative Strength Index (RSI) to the Moving Average Convergence Divergence (MACD), different indicators provide different insights into the forex market. Some help identify trends, while others measure momentum, volatility, or potential support and resistance levels.
However, no single indicator works in every market condition. The key is understanding how each indicator works, when to use it, and how to combine it with other forms of market analysis.
In this guide, we explore seven popular forex trading indicators, explain their practical applications, and show how traders can use them to develop a structured trading approach.
Key Takeaways
- Forex trading indicators help analyze market trends, momentum, volatility, and potential price levels.
- Moving averages can help identify market direction and possible trend changes.
- RSI and MACD provide insights into momentum and potential changes in price movement.
- Bollinger Bands and ATR help traders assess market volatility.
- Fibonacci retracement can help identify potential support and resistance zones.
- ADX measures trend strength and can help distinguish trending conditions from weaker trends.
- Combining indicators from different categories can provide a broader view of the market.
- Indicators do not guarantee profitable trades. Risk management and price action remain essential.
What Are Forex Trading Indicators?
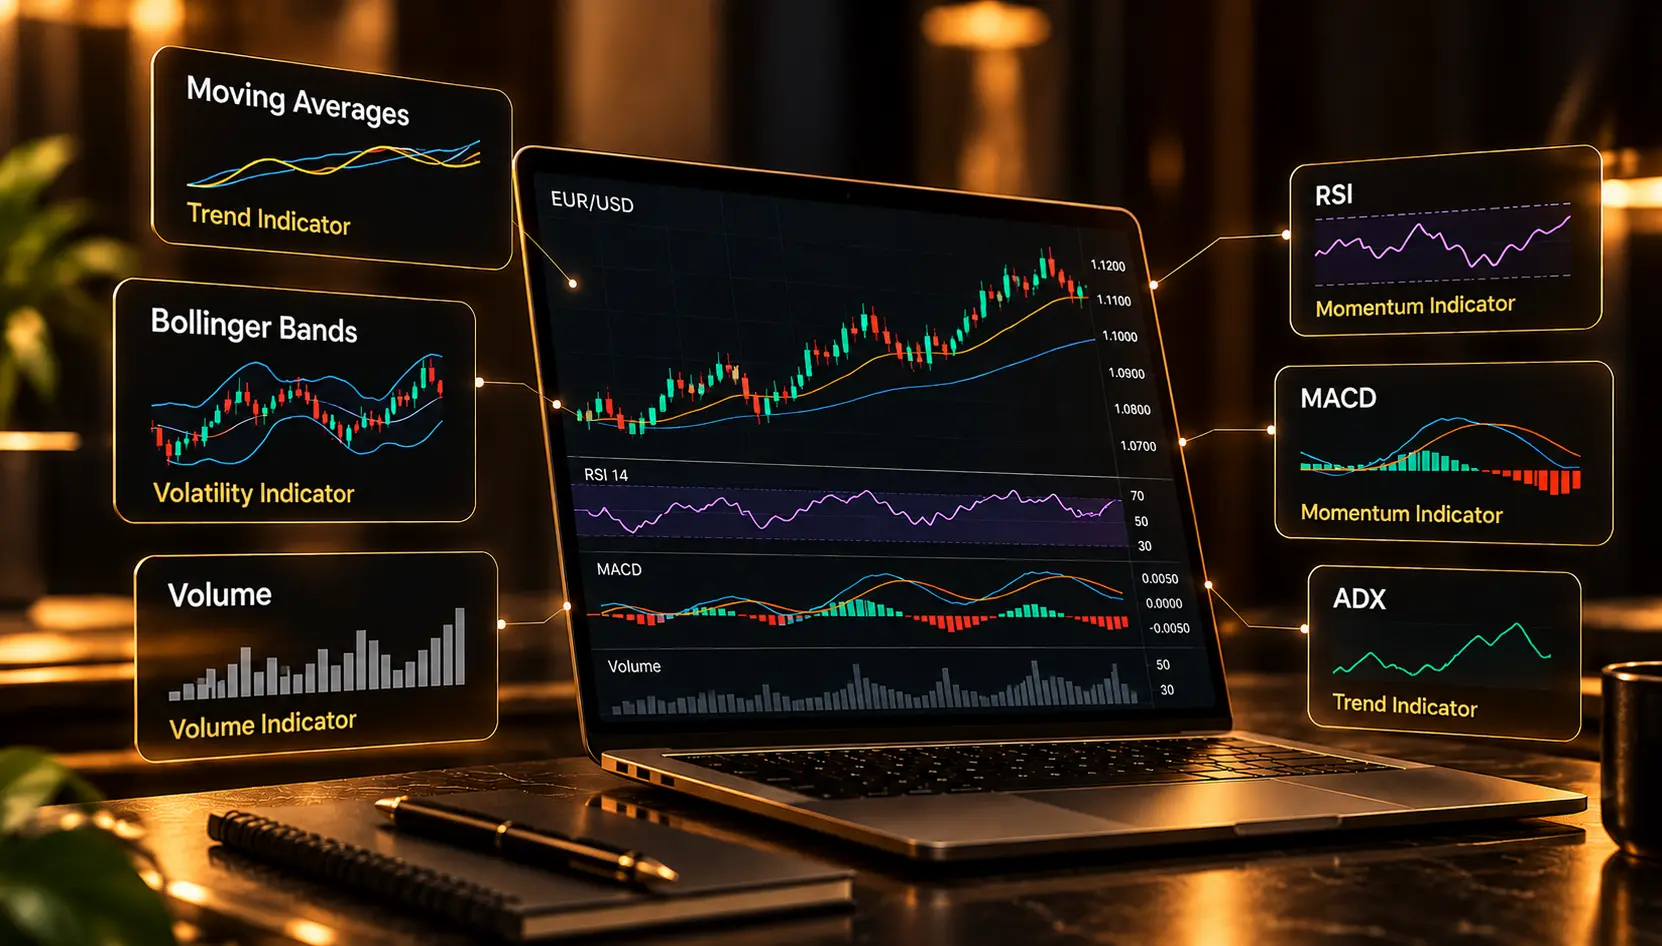
Forex trading indicators are mathematical tools that use historical price data and, in some cases, trading volume or other market information to analyze currency price movements.
They are commonly displayed on forex charts and help traders evaluate market conditions, identify potential entry and exit points, and understand the strength or direction of price movements.
For example, a moving average can help smooth out short-term price fluctuations to reveal the broader direction of a currency pair. RSI can help traders evaluate the strength of recent price movements, while the Average True Range (ATR) measures volatility.
Forex indicators generally fall into four main categories.
Indicator Type | What It Measures | Examples |
|---|---|---|
Trend indicators | Market direction and trend strength | Moving Averages, ADX |
Momentum indicators | Speed and strength of price movements | RSI, MACD, Stochastic Oscillator |
Volatility indicators | The size of price fluctuations | Bollinger Bands, ATR |
Volume indicators | Trading activity and buying or selling pressure | OBV, tick volume |
Understanding these categories helps traders choose indicators that serve different purposes rather than relying on several tools that provide similar information.
7 Best Forex Trading Indicators
There are many technical indicators available to forex traders, but some are particularly popular because they are relatively straightforward to interpret and can be applied across different trading styles.
Here are seven widely used forex trading indicators and how they work.
1. Moving Averages (MA)
Moving averages are among the most widely used forex trading indicators. They smooth out price data over a selected number of periods, making it easier to identify the general direction of a currency pair.
There are two common types of moving averages.
Simple Moving Average (SMA)
The SMA calculates the average closing price over a specified number of periods. Each price observation receives equal weight.
For example, a 50-period SMA calculates the average of the last 50 closing prices on the selected chart.
Exponential Moving Average (EMA)
The EMA gives more weight to recent prices, allowing it to respond more quickly to recent market movements than the SMA.
Traders commonly use 9-period, 20-period, 50-period, and 200-period moving averages, depending on their strategy and timeframe.
How to Use Moving Averages in Forex Trading
Moving averages can help traders identify trends and potential dynamic support and resistance areas.
Common interpretations include:
- Price above a moving average may indicate an upward trend.
- Price below a moving average may indicate a downward trend.
- A moving average that slopes upward suggests positive price momentum over the selected period.
- A moving average that slopes downward suggests negative price momentum over the selected period.
These signals should be interpreted in context. A moving average does not guarantee that a trend will continue.
Moving Average Crossover Strategy
A moving average crossover occurs when a faster moving average crosses a slower one.
For example, traders may use the 50-period and 200-period moving averages to monitor longer-term trend changes.
- Golden Cross: The 50-period moving average crosses above the 200-period moving average, which some traders interpret as a potential bullish signal.
- Death Cross: The 50-period moving average crosses below the 200-period moving average, which some traders interpret as a potential bearish signal.
Crossovers are lagging signals because they rely on historical prices. They can also generate false signals in sideways markets.
Best suited for: Trend analysis, crossover strategies, and traders who want to assess the broader direction of a currency pair.
2. Relative Strength Index (RSI)
The Relative Strength Index (RSI) is a momentum oscillator that measures the speed and magnitude of recent price changes.
It ranges from 0 to 100 and is commonly used to assess overbought and oversold conditions.
The standard RSI setting is 14 periods, although traders can adjust the setting according to their strategy and timeframe.
How to Use RSI in Forex Trading
Traders commonly interpret RSI using three reference points.
RSI Level | Common Interpretation |
|---|---|
Above 70 | Potentially overbought conditions |
Below 30 | Potentially oversold conditions |
Around 50 | A midpoint for assessing momentum |
An RSI reading above 70 suggests that recent buying momentum has been strong. A reading below 30 suggests that recent selling momentum has been strong.
However, these conditions do not automatically signal a reversal. RSI can remain above 70 during a strong uptrend or below 30 during a strong downtrend.
RSI Divergence
RSI divergence occurs when price movement and RSI move in different directions.
Bullish divergence: Price forms a lower low while RSI forms a higher low. This may suggest that selling momentum is weakening.
Bearish divergence: Price forms a higher high while RSI forms a lower high. This may suggest that buying momentum is weakening.
Traders may look for additional confirmation from price action, support and resistance, or other indicators before considering a trade.
Best suited for: Momentum analysis, potential reversal setups, and evaluating the strength of recent price movements.
3. Moving Average Convergence Divergence (MACD)
The Moving Average Convergence Divergence (MACD) is a technical indicator that combines trend and momentum analysis.
It measures the relationship between two exponential moving averages and is commonly used to identify potential changes in momentum.
The standard MACD setup includes:
- MACD line: The difference between the 12-period and 26-period EMAs.
- Signal line: A 9-period EMA of the MACD line.
- MACD histogram: The difference between the MACD line and the signal line.
How to Use MACD in Forex Trading
There are three common ways to interpret MACD.
MACD crossover
When the MACD line crosses above the signal line, it may indicate increasing bullish momentum. When it crosses below the signal line, it may indicate increasing bearish momentum.
Zero-line crossover
When MACD moves above zero, the shorter-term EMA is above the longer-term EMA. When MACD moves below zero, the shorter-term EMA is below the longer-term EMA.
MACD divergence
When price and MACD move in different directions, it may indicate that the current trend is losing momentum.
For example, if GBP/USD continues to make higher highs while MACD forms lower highs, traders may interpret this as a possible sign of weakening bullish momentum.
MACD signals can be less reliable in sideways markets, where frequent crossovers may occur without a sustained price move.
Best suited for: Trend and momentum analysis, crossover strategies, and monitoring potential momentum changes.
4. Bollinger Bands
Bollinger Bands are volatility indicators that help forex traders understand how much a currency pair's price is fluctuating.
The standard Bollinger Bands setup consists of three lines:
- Middle band: A 20-period simple moving average.
- Upper band: The middle band plus two standard deviations.
- Lower band: The middle band minus two standard deviations.
The distance between the upper and lower bands changes with market volatility.
How to Use Bollinger Bands in Forex Trading
Bollinger Bands are commonly used to monitor three market conditions.
Bollinger Band squeeze
When the bands become unusually narrow, volatility is relatively low compared with recent conditions. This is called a squeeze.
Traders often watch for a possible breakout after a squeeze. However, the squeeze does not predict the direction of the breakout.
Price touching the bands
When price reaches the upper band, it may reflect strong upward movement. Reaching the lower band may reflect strong downward movement.
A touch of either band is not automatically a reversal signal. Price can continue moving along an outer band during a strong trend.
Band expansion
When the bands widen, volatility is increasing. Traders may monitor this expansion to evaluate whether a significant price move is developing.
Best suited for: Volatility analysis, monitoring potential breakouts, and evaluating price movement in ranging markets.
5. Average True Range (ATR)
The Average True Range (ATR) measures market volatility by calculating the average true range over a selected number of periods.
Unlike directional indicators, ATR does not show whether a currency pair is likely to rise or fall.
The standard ATR setting is 14 periods.
How to Use ATR in Forex Trading
ATR helps traders understand the typical size of price fluctuations and plan their trades accordingly.
For example, suppose EUR/USD has a 14-period ATR of 60 pips on a particular chart.
A trader considering a 15-pip stop-loss may recognize that the stop is relatively tight compared with recent price fluctuations.
The trader might evaluate a wider stop-loss or reconsider the trade setup. If the stop-loss distance increases, position size may need to decrease to keep the amount at risk within the trader's predetermined limit.
ATR can also help traders compare volatility across different currency pairs or timeframes.
However, ATR should not be treated as a fixed stop-loss formula. Stop placement also depends on market structure, the trading setup, and the trader's risk-management approach.
Best suited for: Volatility measurement, stop-loss planning, and position-sizing decisions.
6. Fibonacci Retracement
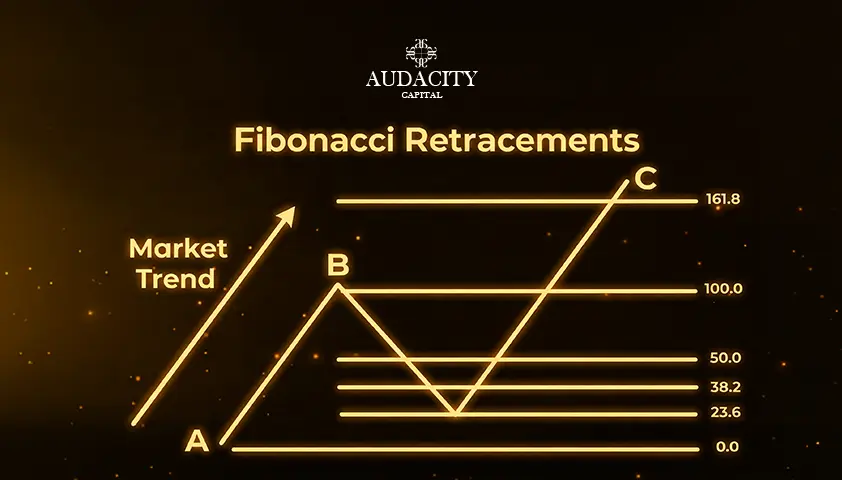
Fibonacci retracement is a technical analysis tool used to identify potential support and resistance zones during price corrections.
It is based on horizontal levels calculated from a selected price swing.
Common Fibonacci retracement levels include:
- 23.6%
- 38.2%
- 50%
- 61.8%
- 78.6%
Although 50% is not a Fibonacci ratio, it is frequently included in retracement analysis.
How to Use Fibonacci Retracement in Forex Trading
Traders typically draw Fibonacci retracement levels between a significant swing low and swing high during an upward move, or between a swing high and swing low during a downward move.
For example, suppose EUR/USD rises from 1.0800 to 1.1000 before beginning a correction.
Traders may monitor the 38.2%, 50%, and 61.8% retracement levels as possible support zones.
If price approaches one of these levels, a trader looking for a continuation of the upward trend may examine price action for signs of renewed buying pressure.
The same approach can be applied in a downtrend to identify possible resistance zones during an upward correction.
Fibonacci levels are not guaranteed reversal points. Traders should consider the broader trend, market structure, and other confirmation signals.
Best suited for: Pullback analysis, identifying potential support and resistance zones, and planning trend-continuation setups.
7. Average Directional Index (ADX)
The Average Directional Index (ADX) measures the strength of a trend without indicating its direction.
It is often used alongside the Positive Directional Indicator (+DI) and Negative Directional Indicator (-DI).
ADX is displayed on a scale from 0 to 100. Traders commonly use it to assess whether the market is trending or moving sideways.
How to Use ADX in Forex Trading
The following ranges are commonly used as general guidelines.
ADX Reading | Common Interpretation |
|---|---|
Below 20 | Weak or absent trend |
20–25 | Potentially developing trend |
Above 25 | Stronger trend conditions |
Above 50 | Very strong trend conditions |
When +DI is above -DI, the indicator suggests stronger positive directional pressure. When -DI is above +DI, negative directional pressure is stronger.
For example, a trader analyzing USD/JPY may use a moving average to identify an upward trend and ADX to assess its strength.
If ADX is rising and above 25, the trader may consider whether trend-following conditions are developing.
ADX is a lagging indicator. It should be used as one part of a broader analysis rather than as an automatic entry signal.
Best suited for: Trend-strength analysis and evaluating whether trend-following strategies may suit current market conditions.
Comparison of the 7 Forex Trading Indicators
Each indicator provides different information. The following table summarizes their main purposes and limitations.
Indicator | Main Purpose | Common Application | Key Limitation |
|---|---|---|---|
Moving Averages | Trend direction | Trend-following and crossovers | Lagging signals |
RSI | Momentum | Overbought and oversold analysis | Extreme readings can persist |
MACD | Trend and momentum | Crossovers and momentum changes | False signals in sideways markets |
Bollinger Bands | Volatility | Squeeze and range analysis | Does not predict breakout direction |
ATR | Volatility | Stop-loss planning and position sizing | Does not indicate market direction |
Fibonacci Retracement | Potential price levels | Pullback and continuation analysis | Level selection can be subjective |
ADX | Trend strength | Assessing trend conditions | Does not show direction on its own |
There is no universally superior indicator. The right choice depends on what you want to measure and how the indicator fits into your trading strategy.
How to Combine Forex Trading Indicators
Combining indicators can provide a more complete view of a potential trade. However, using several indicators that measure the same market characteristic can create redundant signals.
A practical approach is to combine tools from different categories.
Moving Average + RSI
This combination brings together trend and momentum analysis.
A possible bullish setup might involve:
- Price trading above a 50-period moving average.
- RSI pulling back toward the middle of its range.
- Price showing signs of recovering in the direction of the broader trend.
- The trader checking nearby support and resistance and evaluating the potential risk before entering.
For a possible bearish setup, traders can reverse the conditions and look for price below the moving average, a temporary RSI recovery, and signs of renewed selling pressure.
This approach can help traders evaluate momentum in the context of the broader trend.
MACD + Bollinger Bands
MACD and Bollinger Bands can help traders examine momentum and volatility together.
For example, a trader may notice that Bollinger Bands have narrowed significantly. The trader can monitor the chart for a breakout and use MACD to assess whether momentum is strengthening in the same direction.
A breakout accompanied by strengthening momentum may be worth investigating, but it does not guarantee that price will continue moving in that direction.
Moving Average + ADX + ATR
This combination brings together trend direction, trend strength, and volatility.
A possible analytical process is:
- Use a moving average to assess the broader trend.
- Check ADX to evaluate whether the market appears to be trending.
- Use ATR to assess recent volatility and help plan stop-loss distance.
- Calculate an appropriate position size based on the chosen stop-loss and predetermined risk limit.
This framework can help traders organize their analysis without relying on indicator signals alone.
Which Forex Trading Indicators Should You Use for Different Trading Styles?
The usefulness of an indicator depends partly on your trading style and the timeframe you use.
Trading Style | Indicators to Explore | Main Focus |
|---|---|---|
Scalping | Short-period EMA, RSI, ATR | Short-term momentum and volatility |
Day Trading | EMA, MACD, VWAP | Intraday direction and momentum |
Swing Trading | 20/50-period moving averages, RSI, Fibonacci retracement | Medium-term trends and pullbacks |
Position Trading | 100/200-period moving averages, ADX | Longer-term trends and trend strength |
These are examples rather than fixed recommendations. Traders should test indicator settings on their preferred currency pairs and timeframes.
Common Mistakes to Avoid When Using Forex Indicators
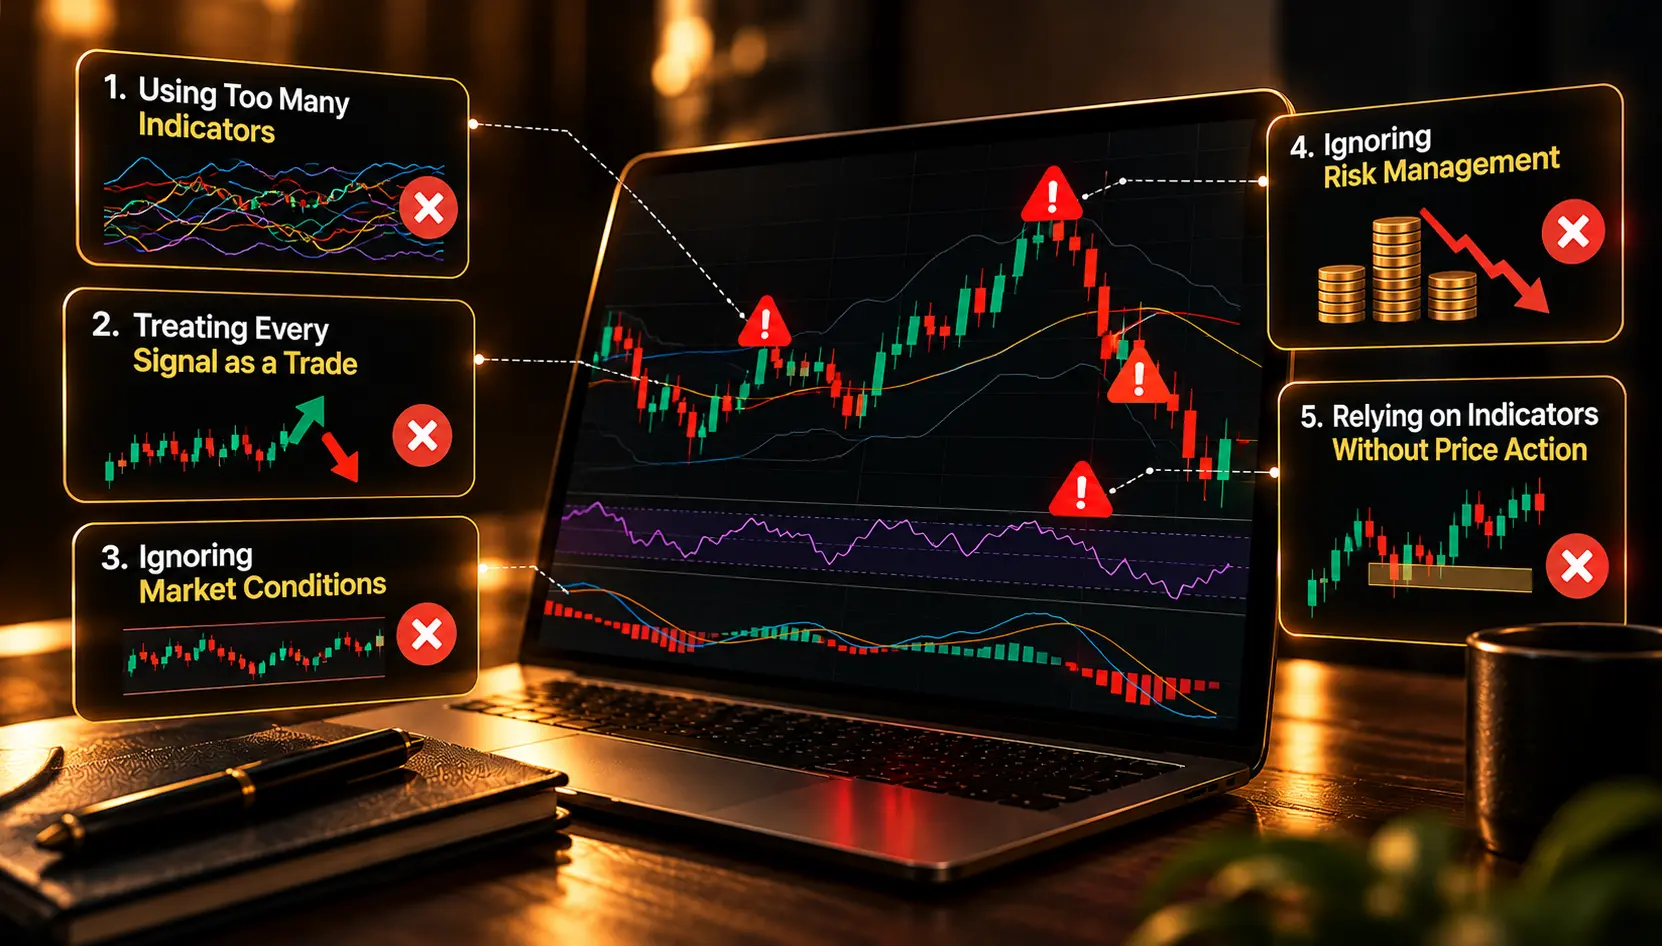
Technical indicators can help structure market analysis, but using them incorrectly can lead to poor trading decisions.
1. Using Too Many Indicators
Adding more indicators does not automatically improve a trading strategy.
For example, RSI and the Stochastic Oscillator both measure momentum. Using them together may provide overlapping information rather than meaningful confirmation.
Start with a small set of indicators that have distinct roles.
2. Treating Every Indicator Signal as a Trade
An RSI reading below 30, a moving average crossover, or a Bollinger Band touch does not guarantee a profitable trading opportunity.
Indicators provide information about market conditions. Traders still need a defined entry plan, exit conditions, and risk-management rules.
3. Ignoring Market Conditions
Trend-following indicators can generate frequent false signals in ranging markets. Reversal strategies may struggle when a strong trend continues.
Consider whether the market is trending, ranging, or experiencing unusually high volatility before applying an indicator-based strategy.
4. Ignoring Risk Management
Even a well-planned trade can result in a loss.
Use appropriate position sizing, stop-loss planning, and predefined risk limits. Avoid increasing trade size simply because multiple indicators appear to agree.
5. Relying on Indicators Without Understanding Price Action
Indicators are derived from market data and should be interpreted in context.
Support and resistance zones, candlestick patterns, market structure, and major economic events can all influence how a technical setup develops.
How to Choose the Right Forex Trading Indicators
Choosing indicators becomes easier when you start with your trading objective rather than selecting tools at random.
Consider the following questions:
- What do you want to measure? Decide whether you need to assess trend direction, momentum, volatility, or potential price levels.
- Which timeframe do you trade? Indicator settings and signal frequency can vary considerably across timeframes.
- What market conditions do you expect? A trend-following setup may behave differently in a ranging market.
- Do your indicators provide different information? Avoid using several tools that measure essentially the same market characteristic.
- Have you tested the strategy? Review historical examples and practice in a demo environment before applying a setup with real capital.
A simple setup that you understand and can evaluate consistently may be easier to manage than a complex chart full of indicators.
Final Thoughts
Forex trading indicators can help traders interpret price movements, recognize market conditions, and organize their trading decisions.
Moving averages, RSI, MACD, Bollinger Bands, ATR, Fibonacci retracement, and ADX each offer a different way to examine the forex market. Understanding what these tools measure—and where their limitations lie—is more useful than simply collecting as many indicators as possible.
Start with a few indicators that match your trading style. Learn how they behave in trending and ranging markets, test your approach, and establish risk-management rules before applying it to live trading.
Explore Audacity Capital's trading guides to build your understanding of forex analysis, trading strategies, and risk management. Practice applying your knowledge in a structured trading environment before committing real capital.
Frequently Asked Questions
Popular forex trading indicators include moving averages, RSI, MACD, Bollinger Bands, ATR, Fibonacci retracement, and ADX. Each serves a different purpose, so the appropriate choice depends on the trading strategy and market conditions.
Moving averages and RSI are common starting points for beginners because they are relatively straightforward to interpret. Beginners can start by learning how each indicator works individually before combining them in a demo trading environment.
Moving averages and RSI combine trend and momentum analysis. MACD and Bollinger Bands can help traders examine momentum and volatility. Moving averages, ADX, and ATR can support trend analysis and volatility-based risk planning.No combination guarantees a successful trade.
RSI and MACD serve different purposes. RSI is a momentum oscillator commonly used to assess overbought and oversold conditions. MACD helps analyze trend direction and momentum through moving average relationships. The choice depends on the information a trader needs.
Some professional forex traders use technical indicators as part of their market analysis. Others rely more heavily on price action, fundamental analysis, order flow, or combinations of methods. Indicator usage varies by strategy and trading environment.
It is possible to build a trading strategy based primarily on technical indicators. However, indicators do not eliminate uncertainty or guarantee profitable results. Traders should also consider market context, execution costs, position sizing, and risk management.
There is no fixed number that suits every trader. A small combination of indicators that measure different market characteristics can provide useful information without making a chart unnecessarily complicated. The important factor is whether each indicator has a clear role in the strategy.

Pronto para aplicar risco disciplinado em cripto? Explore os novos instrumentos de cripto da Audacity Capital e traga sua estratégia de trading.
Saiba MaisNewsletter
Junte-se ao nosso boletim para ficar atualizado.
Junte-se à Nossa Comunidade Social

Comece Sua Jornada Hoje Com Nosso Teste Gratuito
Mostre com orgulho suas habilidades e conquistas através de certificados e obtenha reconhecimento pelo seu trabalho árduo e dedicação de potenciais investidores e colegas.
Teste GratuitoArtigos Relacionados

Fibonacci in Forex Trading: How to Use Fibonacci Levels Like a Pro in 2026 ?
Learn how traders use Fibonacci in forex trading, including retracements, extensions, fans, arcs, time zones, and proven trading strategies.

How to Use Fibonacci Retracement in Forex Trading (And Actually Make It Work)
Learn how to use Fibonacci retracement in forex trading to identify pullbacks, support and resistance levels, and high-probability trade entries.

The Skills Traders Must Master To Survive The Next Market Cycle
What Is Forex Trading Volume?
Learn what trading volume means in Forex trading, how it’s measured, and how traders use volume to confirm trends and price movements.