



Bullish RSI Divergence: How to Spot, Confirm and Trade It



Introduction
Every downtrend eventually runs out of steam. The difficult part is recognising when that is happening before the reversal is obvious to everyone else. Bullish RSI divergence is one of the most widely used tools for doing exactly that.
At its simplest, bullish divergence is a disagreement between price and momentum. Price prints a lower low, suggesting sellers are still in control, while the Relative Strength Index (RSI) prints a higher low, suggesting the selling pressure behind that move is weakening. When the two stop telling the same story, something is often about to change.
The problem is that many traders treat divergence as an automatic buy signal. They spot two lows, draw a line on the RSI, and enter immediately. Sometimes it works. Often it does not, because divergence can persist for several swings in a strong trend before price finally turns.
This guide covers what bullish RSI divergence is, the two main types, how to identify it properly, how to confirm it before risking capital, and how to manage the trade once you are in. We will finish with a full worked example and answer the questions traders most commonly ask about this setup.
A Quick Refresher on the RSI
The Relative Strength Index was developed by J. Welles Wilder and introduced in 1978. It is a momentum oscillator that measures the speed and size of recent price changes and plots the result on a scale from 0 to 100.
The default setting is 14 periods, meaning the indicator compares average gains to average losses over the last 14 candles on whatever timeframe you are using. The traditional reference levels are:
- Above 70: often described as overbought, meaning upside momentum has been strong
- Below 30: often described as oversold, meaning downside momentum has been strong
- The 50 line: a useful midpoint, with readings above 50 suggesting bullish momentum and below 50 suggesting bearish momentum
It is worth being clear about one thing. Oversold does not mean "about to go up". In a strong downtrend, the RSI can sit below 30 for extended periods while price keeps falling. That is precisely why divergence is more useful than simple overbought and oversold readings: it focuses on whether momentum is changing, not just whether it is extreme.
Read more about RSI Divergence: A Complete Guide to Spotting and Trading Momentum Shifts
What Divergence Actually Means
In a healthy trend, price and momentum move together. When price makes a new low, the RSI usually makes a new low as well, because the selling is accelerating or at least holding its pace.
Divergence occurs when that relationship breaks down. Price moves in one direction while the oscillator moves in the other. This tells you that the move on the chart is happening with less force behind it than before.
Think of it like a runner going downhill. If they keep descending but are slowing with every stride, they may still be heading down, but the energy driving them is fading. Divergence is the chart showing you that slowdown.
There are two broad families of divergence:
- Bullish divergence: signals weakening downside momentum and a potential move higher
- Bearish divergence: signals weakening upside momentum and a potential move lower
This article focuses entirely on the bullish side.
What Is Bullish RSI Divergence?
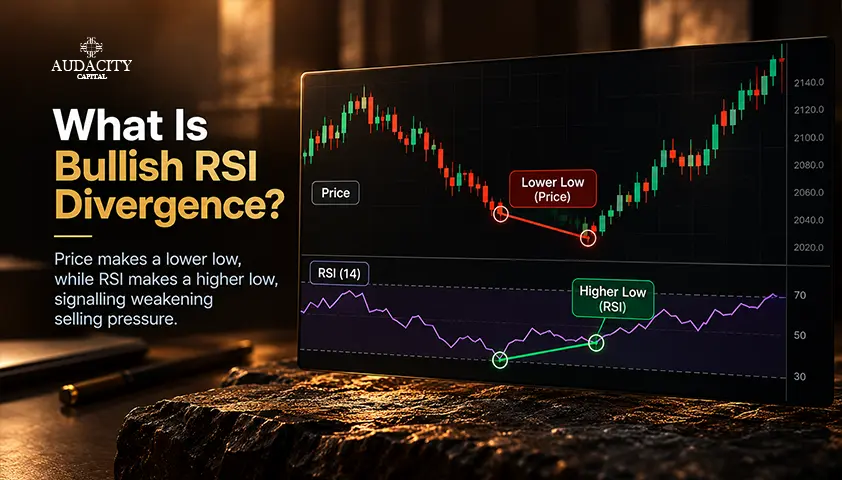
Bullish RSI divergence (often called regular or classic bullish divergence) forms when:
- Price makes a lower low, and
- RSI makes a higher low over the same two swing points
Visually, if you draw a line connecting the two price lows, it slopes downwards. If you draw a line connecting the corresponding RSI lows, it slopes upwards. The lines point away from each other.
The interpretation is straightforward. Sellers managed to push price to a new low, but they needed less momentum to do it, or more accurately, they could not generate as much momentum as they did on the previous push. The second sell-off is weaker than the first.
Bullish divergence is generally considered a potential reversal signal. It suggests the downtrend or the current bearish leg may be nearing exhaustion.
The strongest versions tend to share a few features:
- The first RSI low is at or below 30, showing the market was genuinely oversold
- The second RSI low is noticeably higher, ideally back above 30
- The two price lows are clean, well-defined swing points rather than minor wiggles
- The divergence forms at a meaningful level, such as higher timeframe support or a liquidity pool
Regular vs Hidden Bullish Divergence
There are two types of bullish divergence, and they mean very different things. Mixing them up is one of the most common errors traders make.
Regular Bullish Divergence (Reversal)
- Price: lower low
- RSI: higher low
- Context: appears at the end of a downtrend or bearish leg
- Signal: potential reversal to the upside
This is the version described above and the one most people mean when they say "bullish divergence".
Hidden Bullish Divergence (Continuation)
- Price: higher low
- RSI: lower low
- Context: appears during a pullback within an existing uptrend
- Signal: potential continuation of the uptrend
Hidden divergence tells you that the pullback produced a sharp dip in momentum, but price held up well and failed to make a new low. In other words, the sellers pushed hard on the oscillator but could not damage the price structure. That is often a sign the uptrend is intact and buyers are stepping back in.
Which Is More Reliable?
Many experienced traders find hidden divergence more reliable, simply because it trades with the prevailing trend rather than against it. Regular divergence offers bigger potential rewards because you are catching a turn, but it carries more risk because you are betting against established momentum.
A practical approach is to use regular bullish divergence as an alert that a downtrend may be ending, and hidden bullish divergence as a trigger for buying pullbacks once a new uptrend is confirmed.
Why Bullish Divergence Works
Divergence is not magic. It works because it reflects real behaviour in the order flow.
When price makes a new low with weaker momentum, a few things are usually happening at once:
- Sellers are running out of fuel. The traders who wanted to sell have largely done so. Each new push lower attracts fewer fresh sellers.
- Short sellers are taking profit. Traders who sold earlier begin closing positions, which means buying. That buying absorbs some of the remaining selling pressure.
- Buyers are becoming active at lower prices. Longer-term participants see value and start accumulating.
- Stop orders are being cleared. A new low often triggers stops sitting below the previous low. Once that liquidity is taken, there may be little left to drive price further down.
The RSI captures this shift because it measures the size of the moves, not just their direction. A lower low achieved with smaller candles and less follow-through will produce a higher RSI reading than the original low.
How to Spot Bullish Divergence Correctly
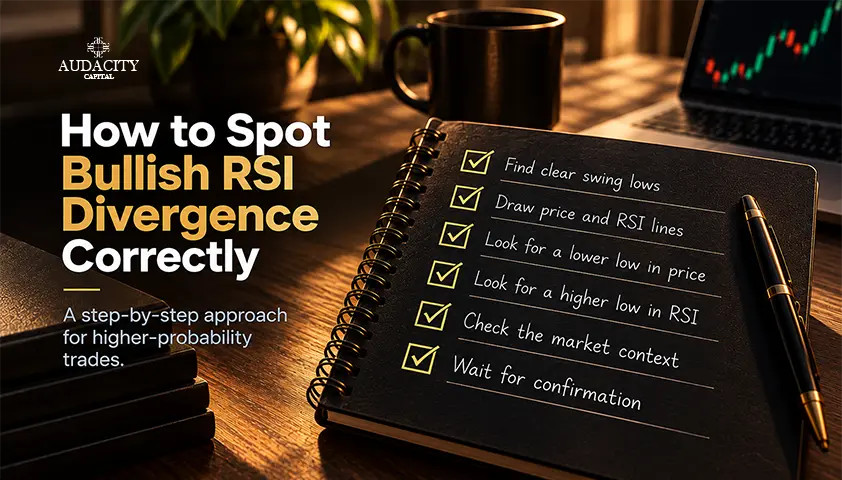
Most failed divergence trades start with a poorly identified divergence. Follow these rules to keep your analysis clean.
1. Use Swing Lows, Not Random Points
Only compare clear swing lows: points where price made a low and then moved meaningfully higher before coming back down. A simple definition is a candle with a lower low than at least two candles on either side of it. Comparing minor internal dips will generate endless false signals.
2. Match the Price Lows to the RSI Lows
The RSI lows you compare must correspond to the same candles (or very close to them) as the price lows. Do not compare a price low from Monday with an RSI low from Wednesday. Draw a vertical line from each price swing low down to the indicator and use the RSI reading at that point.
3. Keep the Swings a Reasonable Distance Apart
If the two lows are only two or three candles apart, the divergence usually lacks significance. If they are 100 candles apart, the market context has probably changed too much for the comparison to be meaningful. As a rough guide, many traders look for lows somewhere between 5 and 50 candles apart on the timeframe they are trading.
4. Look for the RSI to Have Visited Oversold
Divergence where the first RSI low sits at or below 30 tends to carry more weight. It confirms the market was stretched before momentum began to fade.
5. Wait for the Second Low to Be Confirmed
You cannot know a swing low has formed until price has moved up from it. Drawing divergence on a candle that is still forming is how traders end up catching falling knives. Wait for the low to be established before treating the divergence as valid.
Confirmation: Turning a Signal Into a Setup
Divergence tells you momentum is fading. It does not tell you when price will turn. That is why confirmation matters. Here are the most widely used methods, and you will usually want at least one or two before entering.
Price Structure Shift
The most powerful confirmation is a change in market structure. In a downtrend, price makes lower highs and lower lows. If, after the divergence forms, price breaks above the most recent lower high, the bearish structure has been broken. Smart money traders often call this a change of character (CHoCH) or market structure shift.
Bullish Candlestick Patterns
A bullish engulfing candle, hammer, pin bar or morning star at the second low adds evidence that buyers have stepped in. These patterns are most meaningful when they form at a key level.
RSI Trendline Break
Draw a trendline across the descending RSI highs during the sell-off. When the RSI breaks above that line, momentum has shifted in a more decisive way.
RSI Reclaiming 30 or 50
Some traders wait for the RSI to move back above 30 after the second low. More conservative traders wait for it to cross above 50, which suggests momentum has fully turned bullish. The trade-off is that waiting for 50 often means a worse entry price.
Volume
On instruments where meaningful volume data is available, such as futures or equities, declining volume on the second low and rising volume on the bounce can add conviction. For spot forex, tick volume is a rough proxy at best and should be treated with caution.
Entry Methods
Once you have a confirmed bullish divergence, there are three common ways to enter.
Aggressive Entry
Enter on the close of the confirmation candle at the second low, such as a bullish engulfing candle. This gives the best price and the tightest stop, but it also has the highest failure rate because structure has not yet shifted.
Conservative Entry
Wait for price to break above the most recent lower high and enter on that break. You are now trading with confirmed structure, but the entry is further from the low, so your stop is wider and your potential reward is smaller.
Retest Entry
After the structure break, wait for price to pull back towards the broken level or into a demand zone, and enter on signs of support holding. This often provides a balance between the two: better price than chasing the breakout, with more confirmation than the aggressive entry. The downside is that strong reversals sometimes never retest, and you miss the move.
There is no single correct method. Choose the one that fits your risk tolerance and apply it consistently, so you can properly judge its performance over time.
Stop Loss Placement and Profit Targets
Where to Place Your Stop
The logical stop for a bullish divergence trade sits below the second (lower) price low. That low is the point that invalidates the idea. If price breaks beneath it, sellers have regained control and the divergence has failed.
Add a small buffer below the low to account for spread and normal market noise. Many traders use a fraction of the Average True Range (ATR) for this, for example 0.25 to 0.5 times the current ATR.
Where to Take Profit
Sensible targets for a bullish divergence trade include:
- The most recent swing high before the divergence formed
- The start of the final bearish leg, which is where the divergence move began
- Higher timeframe resistance or supply zones
- A fixed risk-to-reward ratio, such as 1:2 or 1:3
Many traders scale out: they take partial profit at the first target, move the stop to break-even, and let the remainder run towards a larger objective. This locks in a gain while still allowing for a full trend reversal.
Position Sizing
Always size your position based on the distance to your stop, not the other way round. Decide what percentage of your account you are willing to risk, commonly 0.5% to 1% per trade, then calculate the lot size so that a stop-out costs exactly that amount.
Timeframes and Market Context
Higher Timeframes Carry More Weight
Divergence on the daily or 4-hour chart is generally more significant than divergence on the 5-minute chart. Lower timeframes produce far more divergences, and many of them are simply noise within a larger move.
A strong approach is to use the higher timeframe to identify the area of interest and the lower timeframe to time the entry. For example, if the daily chart is approaching a major support level, you might look for bullish divergence on the 1-hour chart as price reaches it.
Check the Bigger Trend
Regular bullish divergence against a powerful higher timeframe downtrend is a low-probability trade. Price can produce two, three or even four consecutive bullish divergences while continuing to fall. If the weekly and daily trends are firmly bearish, treat lower timeframe bullish divergence as a short-term bounce opportunity at best.
Location Matters
Divergence in the middle of nowhere is far less reliable than divergence at a level. Look for it at:
- Previous higher timeframe support
- Round psychological numbers
- Demand zones or bullish order blocks
- Major Fibonacci retracement levels, such as the 61.8% or 78.6%
- Areas where obvious sell-side liquidity has just been taken
Session Timing
In forex, the most reliable reversals often occur during periods of high participation, particularly the London open and the London and New York overlap. A divergence that forms during the thin late-Asian session may not have enough real order flow behind it.
Realred Articles
Best RSI Settings for the 1-Minute Nasdaq 100 Chart
RSI Divergence: A Complete Guide to Spotting and Trading Momentum Shifts
RSI Indicator: A Complete Guide
Combining Bullish Divergence With Smart Money Concepts
Bullish divergence pairs particularly well with smart money and ICT concepts, because both are trying to identify the same thing: the point where selling is exhausted and larger participants begin buying.
Liquidity Sweeps
One of the most effective combinations is divergence that forms on a sweep of sell-side liquidity. Price dips below an obvious prior low, triggering stop losses and drawing in breakout sellers, then quickly reverses. That sweep creates the lower low on price, while the RSI, reflecting the lack of genuine follow-through, prints a higher low.
In this context the divergence is not just a momentum observation. It is evidence that the move below the low was a liquidity grab rather than a genuine continuation.
Order Blocks and Demand Zones
If the second low taps into a higher timeframe bullish order block or demand zone, you have two independent reasons to expect a reaction. The order block provides the location, and the divergence provides the momentum evidence.
Change of Character as Confirmation
As mentioned above, a change of character after the divergence is one of the cleanest confirmation signals. Once structure has shifted, you can look for an entry on a pullback into a fair value gap or a fresh order block created during the impulsive move up.
Used together, these tools give you a far more complete picture: where price is likely to turn, whether momentum supports a turn, and when the turn has actually begun.
Common Mistakes to Avoid
Treating Divergence as an Entry Signal
Divergence is a warning, not a trigger. Entering the moment you spot it, without structure or candlestick confirmation, is the fastest way to accumulate losing trades.
Fighting a Strong Trend
In a powerful downtrend, regular bullish divergence fails repeatedly. If the higher timeframe is clearly bearish, either skip the trade or reduce your size and target.
Comparing the Wrong Points
Connecting price lows to RSI lows that do not line up in time invalidates the whole comparison. Always match swing for swing.
Drawing Divergence on Unfinished Candles
The RSI value of a candle that is still forming will change. Divergence that appears mid-candle can disappear by the close. Wait for confirmed swing points.
Seeing Divergence Everywhere
Once you start looking for divergence, it is easy to see it on every chart. Be strict with your criteria. A small number of high-quality setups will outperform a large number of marginal ones.
Ignoring Risk Management
No divergence setup works every time. Without a predefined stop and a sensible position size, a single failed reversal can do serious damage to an account.
Over-Tweaking the RSI Settings
Changing the RSI period to make past divergences look perfect is curve-fitting. The standard 14-period setting is widely used precisely because so many traders watch it. If you do adjust it, test the new setting properly on historical data before trading it live.
Worked Example: GBP/USD on the 1-Hour Chart
The following example uses illustrative figures to demonstrate the process. It is not a record of a real trade.
The Context
GBP/USD has been falling for several sessions. On the 4-hour chart, price is approaching a demand zone between 1.2600 and 1.2630 that previously produced a strong rally. The trader switches to the 1-hour chart to look for an entry.
Step 1: The First Low
During the New York session, price drops to 1.2650 and the RSI reaches 24, well into oversold territory. Price bounces modestly to 1.2690 before sellers return.
Step 2: The Second Low
At the following London open, price breaks beneath 1.2650, sweeping the stop losses sitting below that low, and drops to 1.2618, inside the 4-hour demand zone. This time the RSI only reaches 31.
- Price: lower low (1.2650 to 1.2618)
- RSI: higher low (24 to 31)
That is regular bullish divergence, formed on a sweep of sell-side liquidity, at a higher timeframe demand zone.
Step 3: Confirmation
The candle that made the 1.2618 low closes as a bullish engulfing candle back above 1.2645. Over the next few hours, price rallies and breaks above the most recent lower high at 1.2672, a clear change of character. The RSI crosses above 50 during this move.
Step 4: Entry
The trader uses the retest method. Price pulls back to 1.2660, just below the broken structure level, forms a bullish pin bar, and the trader enters long at 1.2660.
Step 5: Stop Loss
The stop is placed at 1.2608, ten pips below the divergence low of 1.2618. Total risk is 52 pips.
Step 6: Position Size
The trader has a $50,000 account and risks 1%, which is $500. On GBP/USD a standard lot is worth roughly $10 per pip.
$500 ÷ (52 pips × $10) = 0.96 lots
Step 7: Targets
- Target 1: the swing high at 1.2740, 80 pips away (roughly 1.5R). Half the position is closed here and the stop is moved to break-even.
- Target 2: the origin of the final bearish leg at 1.2790, 130 pips from entry (2.5R).
The Outcome
If both targets are hit, the trade returns roughly $1,000, or 2% of the account, while only ever risking 1%. If price had instead broken below 1.2608, the trade would have closed for a planned loss of $500 and the trader would move on to the next setup.
Notice how many factors lined up before entry: higher timeframe demand, a liquidity sweep, clear divergence, a candlestick signal, a structure break and a retest. The divergence on its own was never the reason to buy. It was one piece of a larger case.
Key Takeaways
- Bullish RSI divergence occurs when price makes a lower low while the RSI makes a higher low, signalling weakening downside momentum.
- Regular bullish divergence suggests a potential reversal. Hidden bullish divergence (higher low in price, lower low in RSI) suggests continuation of an existing uptrend.
- Always compare clear swing lows and match price lows to the corresponding RSI readings.
- Divergence is a warning, not an entry signal. Wait for confirmation such as a structure break, a bullish candlestick pattern or an RSI trendline break.
- The logical stop sits below the second price low, with a small buffer for noise and spread.
- Higher timeframe divergence and divergence at key levels are more reliable than random lower timeframe signals.
- Combining divergence with liquidity sweeps, order blocks and changes of character can significantly improve the quality of your setups.
- Strong trends can produce multiple failed divergences, so respect the bigger picture and manage risk on every trade.
Frequently Asked Questions
It can be a useful signal, but it is not reliable on its own. Divergence tells you momentum is fading, not that price is about to reverse. Its reliability improves considerably when it forms at a key level, on a higher timeframe, and is followed by confirmation such as a break in market structure.
The standard 14-period RSI is the most widely used and is a sensible default. Some short-term traders use shorter settings such as 9, which make the indicator more sensitive but also produce more false signals. Whatever you choose, test it thoroughly and stay consistent.
Higher timeframes such as the 4-hour and daily generally produce more meaningful divergence. Many traders identify the setup or area of interest on a higher timeframe and then use a lower timeframe, such as the 15-minute or 1-hour, to refine the entry.
No, but divergence where the first RSI low is at or below 30 tends to carry more weight. It shows the market was genuinely oversold before momentum began to recover.
Regular bullish divergence (price lower low, RSI higher low) is a potential reversal signal at the end of a downtrend. Hidden bullish divergence (price higher low, RSI lower low) is a potential continuation signal during a pullback in an uptrend.
Yes. Divergence can also be spotted on the MACD, Stochastic and other momentum oscillators. Some traders look for divergence appearing on two indicators at once as extra confirmation, although this adds less than combining divergence with price structure and key levels.
The most common reasons are a strong higher timeframe downtrend, entering without confirmation, poorly identified swing points, or divergence forming away from any meaningful level. Momentum can fade and then return, producing multiple divergences before a genuine reversal finally occurs.
The concept applies to forex, indices, commodities, stocks and cryptocurrencies, because it is based on the relationship between price and momentum rather than anything specific to one market. However, each market has its own volatility characteristics, so it is worth testing the approach on the specific instruments you trade.

Pronto para aplicar risco disciplinado em cripto? Explore os novos instrumentos de cripto da Audacity Capital e traga sua estratégia de trading.
Saiba MaisNewsletter
Junte-se ao nosso boletim para ficar atualizado.
Junte-se à Nossa Comunidade Social

Comece Sua Jornada Hoje Com Nosso Teste Gratuito
Mostre com orgulho suas habilidades e conquistas através de certificados e obtenha reconhecimento pelo seu trabalho árduo e dedicação de potenciais investidores e colegas.
Teste GratuitoArtigos Relacionados

Risk of Ruin in Trading: Formula, Examples and How to Reduce It
Learn what risk of ruin in trading means, how the formula works, what affects it, and how position sizing can reduce the chance of account failure.


RSI Divergence: A Complete Guide to Spotting and Trading Momentum Shifts
Learn what RSI divergence is, explore bullish, bearish and hidden divergence, and discover how to identify, confirm and trade RSI divergence.

How to Use Anchored VWAP in Trading
Learn how Anchored VWAP works, choose meaningful anchor points, read price reactions, compare it with VWAP, and avoid common mistakes.

How to Stress-Test a Trading Strategy With Monte Carlo
Learn how Monte Carlo simulation reshuffles trades, estimates drawdown and losing-streak ranges, and tests a strategy beyond one backtest.