


Cumulative Volume Delta (CVD): How to Read and Trade It


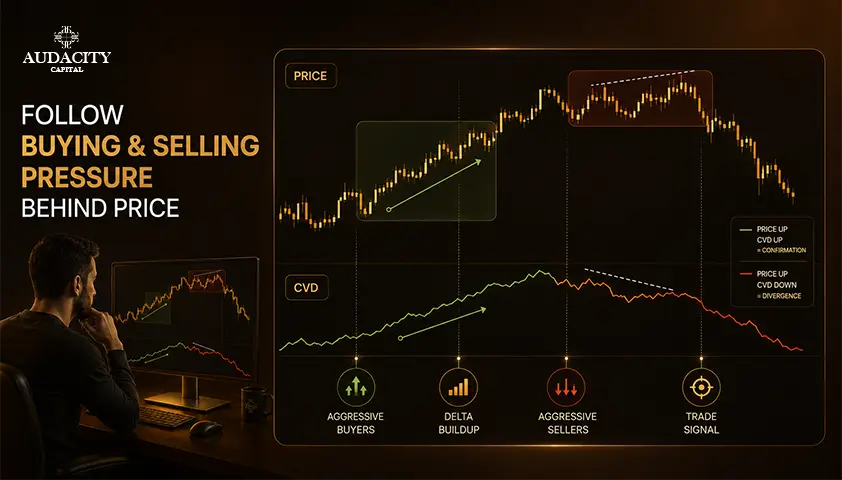
Cumulative Volume Delta is the running total of aggressive buying minus aggressive selling volume. It indicates which side is initiating a move.
Instead of reading price alone, order-flow traders use CVD to see the effort behind the move. A rally that has good market-order buying has a different character from one where it's driven by a thin conviction.
That difference often separates a breakout you can trust from one that fails when you enter.
Set the proper expectations before developing a strategy around it. Cumulative Volume Delta is a confirmation indicator that is only as effective as the volume data that is feeding it. It is not a signal that will tell you when to buy or sell.
This guide covers what it is, how it is calculated, how to read it, how divergence works, practical trade approaches, where it can be trusted across markets, which tools display it, and its limitations.
Let’s get started.
What Is Cumulative Volume Delta?
First, let's consider volume delta.
Volume delta is the difference between aggressive buying and aggressive selling on one bar or period. An aggressive buy is a trade that is done at the ask price, meaning that a buyer is ready to pay a higher price to get filled now.
Aggressive selling refers to trades that occur at the bid, where a seller is ready to accept a lower price to exit quickly. Subtract the aggressive selling from the aggressive buying and you get that bar's delta.
The cumulative Volume Delta is the running cumulative sum of that delta over time. Each new bar's delta is just added to the previous sum, making a continuous line or series.
The concept behind CVD is that it separates aggressive market-order pressure from total trading volume. It indicates which side is initiating trades. Increasing CVD signals more aggressive buying, while decreasing CVD signals more aggressive selling.
Ordinary volume cannot give this differentiation since it represents the aggregation of both buying and selling. CVD adds up the differences between buying and selling volume, thus allowing changes in buying and selling pressure to be more easily identified over time.
How CVD Is Calculated?
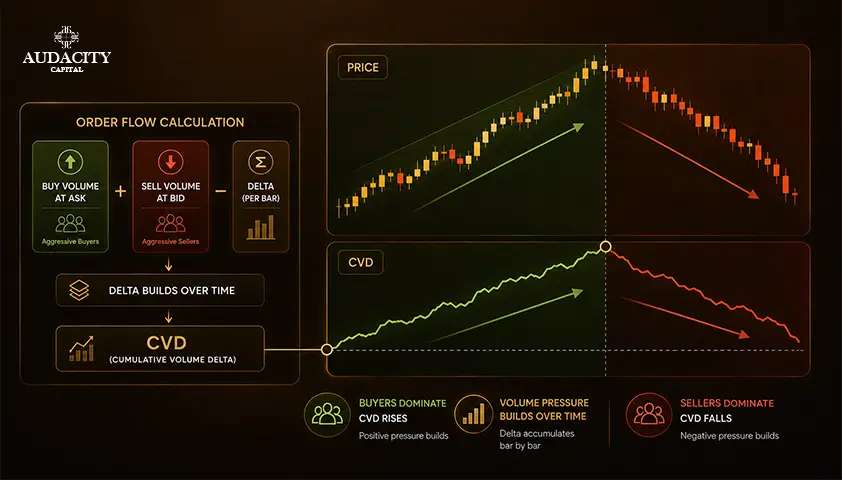
The method is simple:
Volume Delta = buying volume (at the ask) minus selling volume (at the bid)
CVD = the running sum of volume delta over time.
The reset behavior and starting point are important. Some CVD series are continuous from a specific start point, whereas others reset at the start of each session or period.
For instance, a built-in indicator in TradingView restarts its calculation per period with each new bar's delta added to the previous cumulative value within that window.
The reset mode will change the interpretation of the CVD line. Verify it prior to making inferences on the indicator.
Plotting varies too. Typically the cumulative delta is depicted below price as a line, a histogram or candles that show the open, high, low and close of cumulative delta. Green or teal generally indicates buy-dominated conditions; red indicates sell-dominated conditions.
What is most critical about this indicator is how buy/sell volume is measured. Using true tick data or true bid/ask execution data will give an accurate measure of the buy/sell split.
However, many retail platforms will estimate delta based on lower time frame intra-bar up and down volume. This is an estimation, and it puts a cap on accuracy. Here's a quick per-bar example:
Bar | Buy volume (ask) | Sell volume (bid) | Bar delta | Running CVD |
1 | 1,200 | 800 | +400 | +400 |
2 | 600 | 900 | -300 | +100 |
3 | 1,500 | 500 | +1,000 | +1,100 |
How To Read CVD?
Keep it simple and practical.
A positive (rising) CVD indicates net aggressive buying. Falling or negative CVD means net aggressive selling. Green versus red bars or candles show the dominant side for each period at a glance.
The most important read is that of CVD versus the price. A rise in both price and CVD is a confirmation of real buying pressure.
When CVD is flat or goes down with rising prices, it means there is not enough confidence in the trend, and that mismatch sets up divergence, covered next.
Another useful pattern of CVD is called absorption. This happens when high aggressive volume does not drive the price.
For instance, if the aggressors continue hitting the ask but the price does not rise, then it may mean that passive limit orders are absorbing the buying pressure.
Absorption might be the precursor of a stall or reversal. Just as in the case of all other CVD patterns, the point is context. The rising CVD line is meaningless in itself without comparison with the price action.
CVD Divergence, Bullish and Bearish
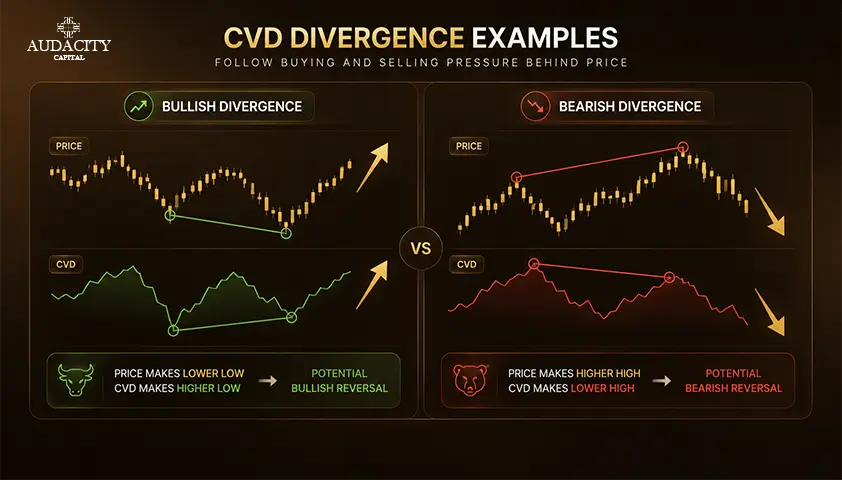
Divergence is the most valuable idea here and thus it deserves the most attention.
The bullish CVD divergence pattern is present when there is a lower low in price along with the higher low in CVD. Price is still declining, but the selling pressure is decreasing below the price, which hints at a possible upside reversal.
Bearish CVD divergence is the mirror. Price makes a higher high while CVD makes a lower high. Price continues to rally, but buying pressure weakens at the new highs, suggesting a possible downside reversal.
Divergence type | Price | CVD | What it suggests |
Bullish | Lower low | Higher low | Less selling pressure, potential upside reversal |
Bearish | Higher high | Lower high | Less buying pressure, potential downside reversal |
The idea is based on an effort-versus-result mismatch: price reaches a new extreme without enough aggressive flow to sustain the move.
This is important since divergence is a condition rather than a trading setup. It does not provide a standalone entry signal. Before you go into a trade, look for price-action confirmation like a structure break or a clear candle signal.
You must also have a specified invalidation level and stop loss. This will tell you exactly where the trade idea ends. Define the goal according to the market's structure, not the fact that the price will go your way.
Remember that when the trend is strong, divergence may last for a long time. That's why entering too early can lead to being on the losing side.
A more disciplined approach is to utilize higher time frame CVD divergence as a context and then look to a lower time frame for entry and execution.
How To Trade With CVD
Consider these as confirmation layers and not independent systems; each comes with risk considerations.
1. Trend confirmation.
Trade in the direction of the trend when CVD and price move together, and avoid continuation trades when they diverge. When in alignment, the move is supported, when in divergence, the move is a warning to tighten up.
2. Divergence at a level.
A bullish or bearish CVD divergence is more significant when forming at an established support or resistance level than in open space. Wait for confirmation of price-action before trading and use structure to set stop and target.
3. Breakout and absorption.
Increasing CVD before a breakout increases confidence. A breakout on flat or declining CVD should be suspected and avoided. Very aggressive volume without price movement can be a sign of price absorption before a price reversal.
4. Multi-timeframe.
Focus on higher time frame CVD for context and divergence, then move to a lower timeframe for precise entries and exits.
5. Confluence and risk.
Add regular volume and open interest to the CVD analysis to improve the signal. Make sure to have equal risk exposure regardless of how strong the setup looks.
A CVD trading strategy developed like this is a tool to enhance your current system rather than an assurance of the result.
CVD Across Markets: Futures, Crypto, Forex, And Stocks
CVD relies on centralized and transparent volume, so it is highly sensitive to the specific market.
- Futures. The ideal case. Here, the centralized exchange volume and real bid/ask executions make CVD the most reliable.
- Crypto. Functions well on larger exchanges that have good liquidity. Remember, spot CVD is a different market from perpetual-futures CVD and comparing the two will be informative.
- Forex. No centralized volume in spot forex, which makes CVD unreliable. Most traders resort to currency futures or even one venue data instead of spot CFD volume.
- Stocks and ETFs. Works with consolidated volumes of the exchange, but still, fragmentation and dark pools limit the visibility of some flow.
Market | CVD reliability | Note |
Futures | High | Centralized volume, real bid and ask execution |
Crypto | Excellent on larger venues | Compare spot vs perpetual-futures CVD |
Forex (spot) | Low | No centralized volume, use futures as a proxy |
Stocks / ETFs | Moderate | Fragmentation and dark pools hide some flow |
This relates to the previous one, that retail platforms tend to closely mimic delta, therefore the data source is as important as the market itself.
Best Tools And Platforms For CVD
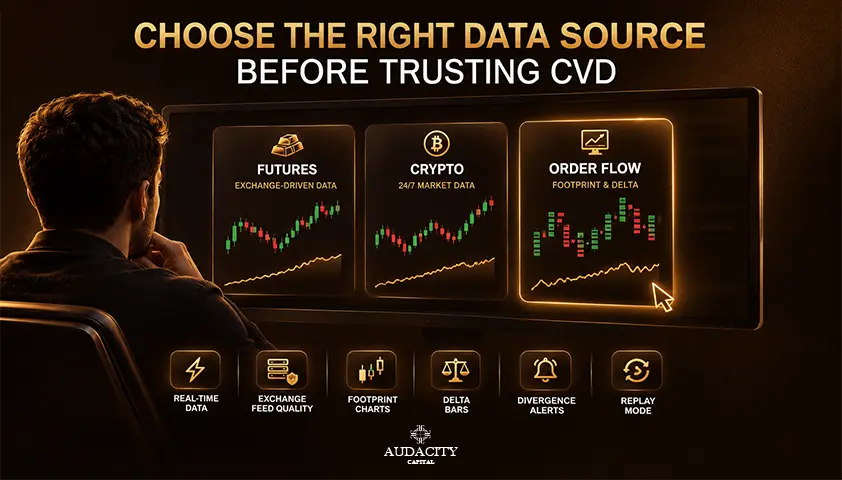
CVD is available on various platforms. Described neutrally:
1. TradingView: Contains a built-in Cumulative Volume Delta indicator that can be added right away, along with many free community scripts.
2. Order-flow platforms: Bookmap combines a liquidity heatmap with CVD and delta bars. Sierra Chart, ATAS, and Quantower are also order-flow focused and are typically used with futures that have true tick data.
3. Crypto tools: CoinGlass provides you with spot-vs-futures CVD for the major coins.
4. Data quality reminder: Real tick data is more precise for CVD than timeframe-based estimates, so take the data source into account.
Limitations And Common Mistakes
In addition to data quality, these are the real problems, each followed by a quick fix.
Mistake #1: Using it as a single confirmation signal.
CVD indicator is a confirmation layer, but not a buy or sell signal itself. Use CVD in conjunction with price and structure.
Mistake #2: Over-trading divergences.
Divergence can persist throughout a strong trend, so wait for price-action confirmation before entering.
Mistake #3: Confusing spot and perp CVD in crypto.
These measure different instruments and may be at odds. Make sure which one you are reading.
Mistake #4: Assuming that the approximated delta is true data.
Most retail platforms calculate delta using lower time frame volume which is less accurate than tick information. Verify your data.
Mistake #5: Not considering the session reset factor.
If the CVD resets each period or if it runs continuously, it will affect the line's appearance. Check the mode before reading it.
Mistake #6: Trading without defined risk.
Always set an invalidation and a stop, as there is no read that is guaranteed.
Conclusion
When properly applied, Cumulative Volume Delta is an added level of confirmation that shows the work behind the price move rather than just showing you the end result.
The indicator works best where the volume is centralized, like in futures markets and big crypto exchanges. It is less effective in the spot forex markets since there is no central volume source.
Becoming adept at using CVD also means taking divergence as a condition that needs price-action confirmation, invalidation criteria, and targets from market structure.
CVD can help make your decision-making clearer, but it doesn’t remove the need for risk management or a sound trading strategy.
If you have created and validated an order-flow edge, a funding account like Audacity Capital could be an approach you may use to trade that edge with larger capital without needing to use your own savings, framed as a choice rather than a requirement.
All of the real work remains with your own practice and process.
FAQ
Both are cumulative volume tools, but OBV adds or subtracts a bar's entire volume based on whether price closed up or down, while CVD splits volume into aggressive buying at the ask and aggressive selling at the bid, then sums the net. CVD sits closer to real order flow, whereas OBV is a simpler price-direction proxy.
It is best treated as a real-time, roughly coincident read of order flow rather than a leading predictor. Divergences can hint at a fading move slightly before price turns, but because CVD reacts to executed volume, it tends to confirm and contextualize more than it forecasts.
Yes. CVD and divergence logic can be coded, alerted on, and backtested on platforms that expose delta data, and many traders automate it. Results depend heavily on data quality, so approximated retail delta backtests less reliably than true tick data, and any system should be validated before you trust it.
It shines intraday for day traders and scalpers, but higher-timeframe CVD on daily or weekly charts can provide useful swing context on sustained flow. For swing trading, treat it as background confirmation and lean on higher-timeframe structure rather than on CVD alone.
TradingView includes a built-in Cumulative Volume Delta indicator you can add for free, and there are many free community scripts as well. Paid tools add features and sometimes better data, but you do not need to pay to start using CVD.
It is most informative in trending and breakout conditions. In tight ranges, the line often chops around the zero area, and signals turn noisy. Within a range, it is more useful for spotting absorption at the edges than for making directional calls.

Pronto para aplicar risco disciplinado em cripto? Explore os novos instrumentos de cripto da Audacity Capital e traga sua estratégia de trading.
Saiba MaisNewsletter
Junte-se ao nosso boletim para ficar atualizado.
Junte-se à Nossa Comunidade Social

Comece Sua Jornada Hoje Com Nosso Teste Gratuito
Mostre com orgulho suas habilidades e conquistas através de certificados e obtenha reconhecimento pelo seu trabalho árduo e dedicação de potenciais investidores e colegas.
Teste GratuitoArtigos Relacionados

Profit Factor in Trading: Formula and What Counts as Good
Learn the profit factor formula, calculate it with an example, judge useful ranges, and see why costs, sample size, and drawdown still matter.

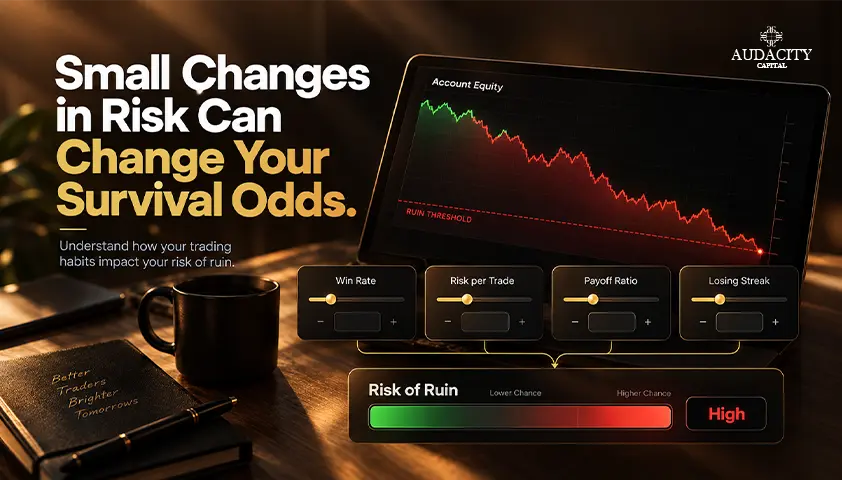
Risk of Ruin in Trading: Formula, Examples and How to Reduce It
Learn what risk of ruin in trading means, how the formula works, what affects it, and how position sizing can reduce the chance of account failure.
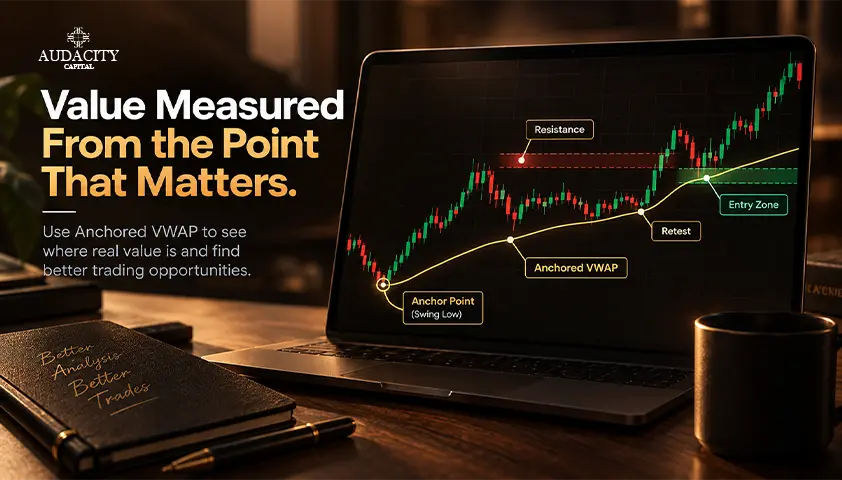
How to Use Anchored VWAP in Trading
Learn how Anchored VWAP works, choose meaningful anchor points, read price reactions, compare it with VWAP, and avoid common mistakes.
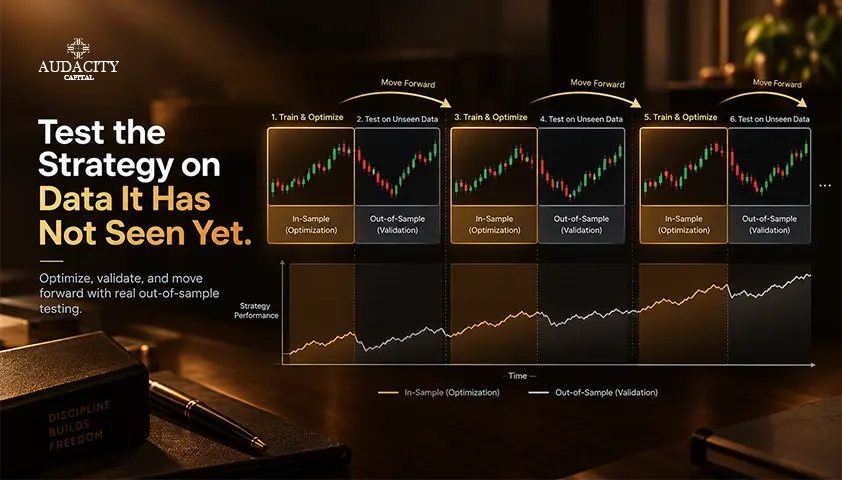
Walk-Forward Analysis in Trading: A Practical Guide
Learn how walk-forward analysis works in trading: in-sample and out-of-sample windows, rolling vs anchored designs, a worked example, and how to read results.