


7 Fibonacci Retracement Strategies Every Trader Should Know



Most traders can draw a Fibonacci retracement in under a minute. They pull the tool from swing high to swing low, watch the levels appear, and are done. But there’s a harder skill that sits one step further back: it’s choosing which Fibonacci retracement strategy fits the chart in front of you.
A strong trend rewards a different approach than a choppy range. At the same time, a news-driven spike rewards no approach at all until the dust settles. Here’s an advanced guide that skips the basics and works through 7 practical Fibonacci retracement strategies built for the market conditions traders face, and a quick framework for picking the right one.
Which Fibonacci Retracement Strategy Fits the Market Right Now?
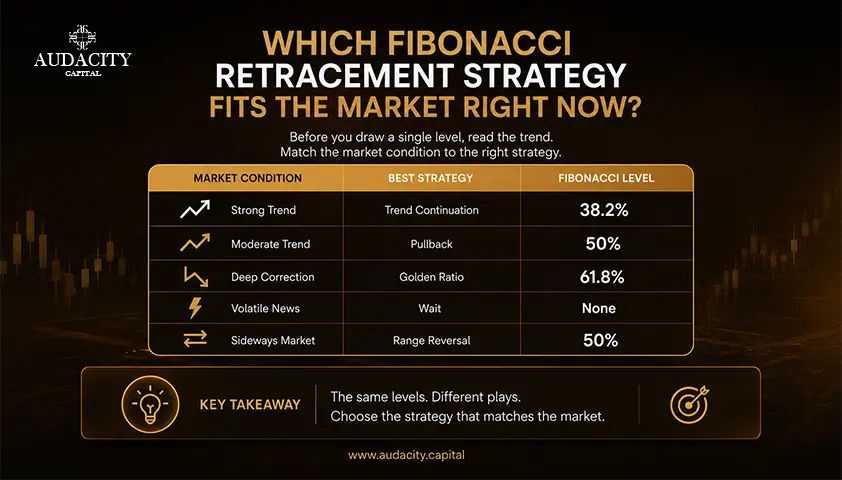
Every Fibonacci retracement strategy on this list answers to one condition first –
What is the broader trend doing before a single level gets drawn?
A trending market, a ranging market, and a market reacting to fresh data each call for a different Fibonacci retracement zone. Mixing them up is where most Fibonacci traders go wrong. Reduced to a simple filter before opening any chart, the logic runs like this:
- In a strong trend, the 38.2% zone tends to hold.
- In a moderate trend, expect a deeper give-back toward 50%.
- In a weak or fading trend, watch for a pullback into the 61.8% zone.
However, with no clear trend at all, skip trend-based Fibonacci strategies and treat the chart as a range instead.
Here’s a table that turns the same logic into a quick reference, matching the strategy with each condition:
Market Condition | Best Strategy | |
Strong trend | Trend Continuation | 38.2% |
Moderate Trend | Pullback | 50% |
Deep Correction | Golden Ratio | 61.8% |
Volatile News | Wait | None |
Sideways Market | Range reversal | 50% |
Now comes the main part, 7 Fibonacci Retracement Strategies. Here’s a detailed insight into each row, outlining the exact triggers, entries, and exits that make these strategies repeatable and not guesswork.
1. Trend Continuation Strategy
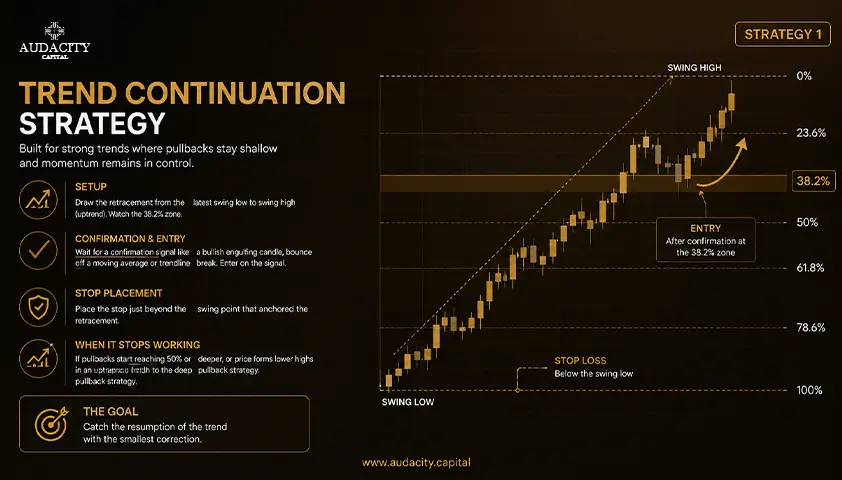
A Trend Continuation Fibonacci Retracement Strategy is the first tool to reach for once a market has picked a clear direction and shows no sign of slowing. It works best in a strong, momentum-driven trend, the kind where higher highs or lower lows forms quick succession and pullbacks stay shallow.
Setup
- Draw the retracement from the most recent swing low to swing high in an uptrend, or high to low in a downtrend.
- Watch the 38.2% zone.
That level generally holds in a strong trend because there is not enough opposing pressure built up to push the price any deeper.
Confirmation & Entry
A confirmation signal should arrive before the entry triggers, since a bare touch of 38.2% means little on its own.
A bullish engulfing candle, a bounce off a rising moving average, or a break of a small internal trendline near that zone adds weight to the setup.
Enter once that signal appears and place the stop just beyond the swing point that anchored the retracement. Now manage the trade by trailing behind new highs or lows as the trend extends.
When Does It Stop Working?
Once the momentum fades, this strategy runs into trouble.
- If pullbacks start reaching 50% or deeper.
- Or price begins forming lower highs inside what should be an uptrend.
Treat both conditions as a cue to shift toward the deep pullback approach. Do not force any entry into the market that is no longer offering.
2. Deep Pullback Strategy
Not every healthy rend hands back only a small piece of its move before continuing. When a trend has run for a while or momentum starts cooling without reversing, price often needs a deeper give-back, into the 61.8% zone and sometimes as far as 78.6%, before the original direction reasserts itself.
Traders sometimes call 61.8% the golden ratio for good reason. Why? Because it marks the point where a pullback stops looking like routine profit-taking and starts testing whether the trend still has conviction behind it.
Patience & Confirmation
Patience separates this Fibonacci retracement strategy from the trend continuation approach above.
A deep pullback can look and feel like a reversal while it is happening. Jumping in at the first touch of 61.8% without waiting for a real reaction often ends in an early stop-out.
Wait for a clear rejection at the level before entering in the direction of the original trend. A spike in volume or a strong reversal candle can provide extra confirmation.
Stop Placement
Place the stop beyond the 78.6% mark or the structural swing point, whichever is further out. A break past that level usually signals that the trend has ended, not paused.
Because the pullback runs deep, the potential reward is often larger once the price turns. This makes the setup worth the extra wait for traders willing to handle a choppier entry.
3. Shallow Retracement Strategy
Some markets barely pull back at all once they get moving. Trying to force a 38.2% or 50% entry on them means missing the trade.
Gold during a strong momentum run, the NASDAQ in a risk-on stretch, and GBPUSD during a sharp directional push have all shown this pattern. Price retraces only 23.6% or a shallow slice of 38.2% before charging back in the direction of the trend.
The buying or selling pressure behind these moves is too strong for a deeper correction to take hold.
Identifying the Setup
Spotting this Fibonacci retracement strategy early comes down to reading momentum instead of waiting for a textbook pullback.
- Wide-range candles.
- Minimal overlap between bars.
- A moving average that price barely touches before bouncing.
These are all signs that a shallow retracement is in play.
Entries usually come from a smaller timeframe confirmation when the price taps the 23.6% zone. Waiting for a deeper pullback that never arrives can mean missing one of the strongest legs of the move.
The Tradeoff
The tradeoff is a tighter stop and less room for error. If the shallow retracement fails, it often fails quickly and rarely gives a second chance at a better price.
4. Breakout Retest Strategy
Price breaks a key level -> Pulls back to test it -> Continues in the breakout direction.
That three-part sequence is one of the most reliable setups in trading, and Fibonacci retracement adds precision to the middle step.
Once the market breaks through resistance, a prior swing high, or a pattern such as a triangle or range, the retest often reaches the 38.2% or 50% retracement of that breakout leg. This can turn the old resistance into fresh support, or the reverse during a downside break.
But How Does It Differ?
This differs from the earlier strategies because the tool here is measuring the retracement of one specific impulse move rather than a trend pullback.
Mark the retracement from the start of the breakout candle to its high, then watch for the price to return into the 38.2% to 50% window and hold.
Confirmation
A close back above the broken level, or a rejection wick at the retest zone, both count as confirmation.
The stop sits just on the other side of the old level, since a full close back through it usually means the breakout has failed.
Traders who skip the retest and chase the initial breakout candle often get a worse entry and a wider stop. Waiting for the retest can offer a better entry, making the extra patience worthwhile for this breakout retest Fibonacci retracement strategy.
5. Multi-Timeframe Strategy
Professional desks rarely trade off a single chart, and Fibonacci retracement works best when it agrees across more than one timeframe.
Daily Chart
Start on the daily chart to establish the dominant trend and draw the primary retracement from the major swing points.
4-Hour Chart
Drop to the 4-hour chart next and draw a second retracement on the more recent swing within that same trend.
When the 38.2%, 50%, or 61.8% levels from both timeframes cluster within a tight range of each other, that overlap becomes a much stronger zone than either level would be on its own.
1-Hour Chart
The 1-hour chart handles the final piece, timing the entry once the price reaches that confluence zone.
This is where confirmation signals, such as:
- Candlestick patterns
- Minor trendline breaks
- Momentum divergence
gets evaluated, since the daily and 4-hour charts set up the trade, but the 1-hour chart decides when to take it.
A Fibonacci retracement strategy built this way filters out a large share of the false signals that show up when a single timeframe is read in isolation.
The extra step takes more screen time than a single-chart setup. It will not make every trade a winner, but alignment across timeframes can lead to a better win rate over a large sample of trades.
6. Range Reversal Strategy
Although Fibonacci retracement is primarily designed for trending markets, it can also be effective in sideways conditions with a slight adjustment in approach. Instead of anchoring the tool to a trend leg, anchor it to the range itself, from the established high to the established low, or the reverse.
The 50% level of that range often acts as a pivot where price stalls, reverses, or picks a direction. This makes it one of the more dependable reference points inside a market that refuses to trend.
How Does It Work?
A range reversal Fibonacci retracement strategy works by fading the edges of the range instead of chasing a breakout that may not come.
- Watch for the price to approach the top or bottom boundary of the range and reject it.
- Use the 50% level as either a target for the first piece of the trade or a place to add if price pushes through toward the opposite edge.
This setup depends on the range holding. A decisive close outside either boundary should cancel the trade instead of getting treated as a temporary wick.
Also, this is the one setup on this list built for the exact condition every trend-based strategy above tries to avoid. In fact, it earns its own place in the toolkit.
7. News Volatility Strategy
Non-farm payrolls, CPI prints, and interest rate decisions can turn a clean chart into a mess of spikes and false wicks within seconds, and Fibonacci retracement struggles in that environment.
Levels drawn on a news-driven spike get invalidated almost as fast as they are drawn. The swing points anchoring the tool are often distorted by an event that has not finished playing out.
Treating a five-minute spike high as a reliable anchor for a retracement is one of the more common mistakes traders make around high-impact releases.
The Better Approach
The better approach in this case is knowing when to step back.
Waiting 20-30 minutes after a major release lets the initial volatility settle. It also gives the market time to establish a swing point that reflects trader consensus rather than a knee-jerk reaction.
Once that settling period passes and a clear structure starts to form, the same Fibonacci retracement strategy tools used elsewhere in this guide can be applied to the post-news move with far more confidence. These include trend continuation, deep pullback, or shallow retracement.
The Tradeoff
Skipping the first move after a major release will cost a trader some of the biggest single-candle gains of the month. However, it also avoids the far more common outcome of getting stopped out twice before the real trend even begins.
Some Fibonacci Retracement Strategy in Real Markets
Reading about a setup and watching it play out on an actual chart are two different skills. Here are four significant examples that focus on why a specific approach was chosen over the alternatives.
Example 1: EUR/USD, Trend Continuation
Through 2022, EUR/USD held a persistent downtrend as the Federal Reserve raised rates well ahead of the European Central Bank. This policy gap pushed the pair from the 1.13 to 1.14 area toward parity and briefly below it by that September.
Corrective bounces during that stretch rarely closed above the 38.2% retracement of the preceding leg down before sellers regained control. This was the textbook signature of a trend continuation Fibonacci retracement strategy.
Traders who waited for:
- The pullback
- A rejection candle
Before re-entering, shorts caught a large share of the move. Anyone chasing every green candle inside the downtrend got chopped up along the way.
Example 2: Gold, Deep Pullback
Gold's advance toward its 2020 record above 2,070 dollars an ounce came with a reminder of how deep a healthy pullback can run. The metal spent the back half of 2020 and part of 2021 giving back a large portion of that rally before demand returned.
The retracement pushed well past the shallow zones and into golden ratio territory relative to the broader move off the 2018 lows. This tested the patience of anyone who entered the moment the price first touched 38.2%.
A deep pullback Fibonacci retracement strategy applied here meant waiting through months of sideways chop instead of expecting a quick bounce. The reward was a cleaner entry once buyers stepped back in.
Example 3: NASDAQ, Shallow Pullback
The Nasdaq 100's run through 2023, powered by a handful of mega-cap technology and AI-linked names, gave traders very little room to buy a deep discount.
Pullbacks across that stretch stalled in the 23.6% to 38.2% zone before the index pushed on to fresh highs. This rewarded traders who recognized the shallow retracement pattern early over anyone waiting for a 50% correction that almost never arrived.
The lesson from that year sits at the center of this whole guide:
- Choose a Fibonacci retracement strategy that matches the market.
- Don't force the market to fit a favorite setup.
Example 4: GBP/JPY, breakout retest
Persistent yen weakness through 2023 and 2024, driven by the Bank of Japan holding policy far looser than every other major central bank, sent GBP/JPY grinding higher for an extended stretch.
Several legs of that move followed the breakout retest pattern:
- Price cleared a prior high.
- It pulled back into the 38.2% to 50% zone of the breakout leg.
- It retested it as support.
- The price then continued higher.
A breakout retest Fibonacci retracement strategy suited this pair well because the trend rarely paused for long. This made the retest often the only realistic entry and not a chase at the highs.
How to Choose the Right Fibonacci Retracement Strategy?
Honestly, there is no single best Fibonacci retracement strategy that works across every chart. Traders who treat 38.2% or 61.8% as a fixed rule regardless of context generally give back in choppy conditions what they made during trending ones.
The 7 approaches above cover the main conditions you are likely to see on a chart, whether the market is trending, moving sideways, or reacting to major news. The important part is learning to recognize what the market is doing right now. Once those conditions change, the strategy should change too. Don't keep using the same setup just because it worked earlier in the trend.
Think you're ready to trade Fibonacci with real capital?
Read more about How to Use Fibonacci Retracement in Forex Trading (And Actually Make It Work)
Audacity Capital gives traders the opportunity to put their strategies to work with funded capital. Before you take the next step, you can sharpen your skills and test your approach through Audacity Capital's free monthly trading competition.
Frequently Asked Questions
Trend continuation is the strategy built for this condition. In a strong trend, pullbacks rarely extend past 38.2% before the original direction resumes. Therefore, entries clustered around that level, combined with a confirmation candle, tend to offer the best risk-to-reward.
The deep pullback strategy, built around the 61.8% golden ratio and sometimes 78.6%, fits this scenario best. Prices do look weak before the trend reasserts itself, so waiting for a confirmed rejection matters more here than speed.
Anchor the tool to the range instead of a trend leg, using the established high and low as reference points. The 50% level becomes the key pivot, useful for fading the edges instead of chasing a breakout that may not come.
Around high-impact news such as NFP, CPI, or a rate decision, price gets too distorted for reliable swing points. Wait 20-30 minutes after release for volatility to settle before trading any retracement.
Most start by reading the broader trend and its strength, then check for confluence across multiple timeframes before picking a level. The decision comes down to matching market conditions to the right tool.

Pronto para aplicar risco disciplinado em cripto? Explore os novos instrumentos de cripto da Audacity Capital e traga sua estratégia de trading.
Saiba MaisNewsletter
Junte-se ao nosso boletim para ficar atualizado.
Junte-se à Nossa Comunidade Social

Comece Sua Jornada Hoje Com Nosso Teste Gratuito
Mostre com orgulho suas habilidades e conquistas através de certificados e obtenha reconhecimento pelo seu trabalho árduo e dedicação de potenciais investidores e colegas.
Teste Gratuito