


PnL in Trading - What is PnL in Trading?



PnL in trading is the real scorekeeper, the number that tells you if your strategy actually works. Day trading equities, holding crypto perpetuals, or grinding through a prop firm evaluation all come down to the same question: what is P&L in trading telling you right now? Get comfortable reading it, because your account balance depends on it.
Key Takeaways
- P&L is the real scorecard for any trade, session, or account, both gross and net.
- Net P&L is what actually lands in your account once fees and swaps are subtracted.
- Realized P&L is settled cash; unrealized P&L is still moving with the market.
- Prop firm trailing drawdowns can fail an account on a trade that closed flat.
- Small habits, like limit orders and better payoff ratios, improve P&L more than luck.
What Is P&L in Trading?
P&L in trading stands for Profit and Loss, that clears up the question what is the PnL in trading. It is the number that tells you, in plain terms, whether a position made money or lost it. The number attaches itself to everything: a single trade, a full session, even a strategy that's been running for three years. Ask what does PnL mean in trading, and the short answer is: it's the scoreboard that tells you whether you're winning or losing, updated in real time.
Not all P&L figures mean the same thing, though.
A gross number counts only the raw price swing, exit price minus entry price, multiplied by however large the position was. Costs, fees, and financing charges never touch that gross figure at all.
Whereas Net P&L picks up where gross leaves off, deducting commissions, spread costs, overnight swap charges, and slippage from a less-than-perfect fill. Whatever remains is the real, net result, the number that actually changes the account balance.
Let’s see their quick breakdown:
Gross P&L: (Exit Price − Entry Price) × Position Size, no costs deducted
Net P&L: Gross P&L minus commissions, spread costs, overnight financing, and slippage
For anyone trading frequently, the gap between those two numbers can be surprisingly large. Fees that look tiny per trade add up fast across dozens of executions in a single week.
Timing matters just as much as cost does. A single trade produces its own P&L the moment it closes. Sessions settle their own totals at the end of each day. And then there's the bigger picture, the cumulative P&L that builds across an entire trading history. That longer view is usually what separates a lucky week from a genuinely profitable strategy.
How Is Trading P&L Calculated?

Calculating P&L in trading always comes back to one basic idea: multiply the price move by however much was traded. For a long position, the starting formula looks like this:
PnL = (Exit Price − Entry Price) × Position Size
Short positions reverse the order, since profit only comes from a falling price:
PnL = (Entry Price − Exit Price) × Position Size
From there, every asset class adjusts that base formula to match how it actually trades:
Equities: Multiply the price difference between exit and entry by the number of shares held.
Forex: Multiply the price difference by lot size, contract size, and pip value together. A standard lot equals 100,000 units of the base currency, and on a pair like EUR/USD, one pip (0.0001) works out to $10 per standard lot.
Futures: First, divide the price difference by the tick size, then multiply by the tick value and the number of contracts. The E-mini S&P 500 moves in 0.25-point ticks worth $12.50 each, putting a full index point at $50.
Crypto derivatives: Start from the price-based PnL on contracts held. Next, adjust for funding fees charged or credited every eight hours, and subtract execution fees on both entry and exit.
Funding fees deserve a closer look, since crypto perpetuals are the only asset class that deals with them. These payments move between long and short position holders every eight hours, based on how far the contract's price has drifted from the underlying spot market. Anyone holding a position across a funding window needs to factor that cost, or credit, into the real result, because it can shift a strategy's numbers more than most people expect. Execution fees add another layer on top, charged separately on every entry and every exit, regardless of which direction the funding moves.
Realized vs. Unrealized P&L
PnL in trading splits into two very different states, and knowing which one is on screen matters more than most traders realize.
Unrealized P&L, also called floating P&L, belongs to positions still open on the market. It changes constantly, following live prices up and down, and none of that value is guaranteed until the position actually closes. Realized P&L is what's left once it does close, actual cash reflected in the account balance rather than a number that could still change.
Here's how you can tell them apart:
Unrealized (floating) P&L: Live value of an open position, changes tick by tick.
Realized P&L: Locked-in result once a position closes, settled into the account balance.
Exchanges handle the floating side carefully. Rather than relying on the Last Traded Price, which can spike briefly from a single large order hitting thin liquidity, platforms like Binance and Bybit calculate unrealized PnL using a Mark Price instead. This Mark Price blends an index of prices pulled from several major spot exchanges with a short moving average and the live contract price, landing on something close to fair value. Tying liquidations to that smoothed number protects traders from getting wiped out by a wick that never reflected the broader market.
There's a psychological cost to watching floating numbers move all day, and behavioral finance has a name for it: the disposition effect. Traders sitting on unrealized gains often close the position too early, driven by fear that the profit will vanish if they wait. Traders sitting on unrealized losses tend to do the opposite, ignoring their own stop-loss levels and holding on longer than planned, hoping the market comes back. That habit, taking small wins fast and letting losses run, causes more account damage over time than most people expect.
P&L Example in Trading
The fastest way to actually get PnL in trading is to run the numbers on a real position, so here's the arithmetic laid out for three different markets.
Scenario | Position | Entry → Exit | Gross P&L | Fees & Funding | Net P&L |
Forex (EUR/USD) | 2 standard lots, long | 1.0850 → 1.0910 | +$1,200.00 | $14.00 commission | +$1,186.00 |
Futures (E-mini S&P 500) | 3 contracts, short | 5,500 → 5,480 | +$3,000.00 | $13.50 fees | +$2,986.50 |
Crypto (BTC Perpetual) | 1.0 BTC, 10x leverage, long | $60,000 → $63,000 | +$3,000.00 | $61.50 fees + $12.30 funding | +$2,926.20 |
The forex trade is the simplest to follow. Sixty pips of favorable movement, multiplied by $10 per pip on 2 lots, produces a $1,200 gross gain. A flat $14 commission comes off that, and financing costs never appear separately because they're already baked into the spread.
The futures trade works the same way but with tick math instead of pips. Twenty index points, worth $50 each per contract, across three contracts, generate $3,000 gross. Fees run $4.50 per contract round-turn, trimming the total to $2,986.50 net. Futures financing clears through the exchange, so there's no swap line here either.
The crypto trade carries the most moving parts. Taker fees apply on both entry and exit, at 0.05% of each side's notional value, totaling $61.50. On top of that, holding across two 8-hour funding cycles adds $12.30 in cost. Once both deductions come out of the $3,000 gross figure, the trader nets $2,926.20.
Important: Gross numbers can look nearly identical across scenarios, as the above table shows. However, the net results diverge once each asset class applies its own fee and funding structure.
What Is P&L Percentage (%)?
A dollar amount by itself hides more than it reveals. Winning $500 barely registers on a $500,000 account, yet it's a massive result on a $1,000 one. Percentage metrics solve that by standardizing every result against a common baseline.
Two formulas cover most of what a trader needs day-to-day. Trade return, measured against entry price, works out as:
Trade Return % = ((Exit Price − Entry Price) / Entry Price) × 100
Account growth, measured against how much capital sat behind the whole strategy, works out as:
Account Growth % = (Net Dollar PnL / Starting Account Balance) × 100
Where these numbers start to diverge is leverage, and that's exactly what Return on Margin and Return on Capital are built to separate. Return on Margin, often shown as ROE on an exchange dashboard, measures profit against only the collateral actually posted for a trade. Take that crypto example from earlier: a $2,926.20 net gain on $6,000 of margin, and ROM comes out to 48.77%. That number looks fantastic on its own.
Return on Capital tells a different story, because it measures the same profit against the trader's entire account balance. If that account holds $100,000 total, the real ROC on that same trade drops to 2.93%. Leaning too hard on ROM alone hides how much leverage sits underneath a result, and institutional risk managers track ROC specifically because it keeps that exposure in view.
How to Read P&L on a Trading Account?
Every trading platform displays PnL a little differently, but they're all answering the same three questions: what's settled, what's still floating, and what's available to trade with next.
MetaTrader (MT4/MT5): Everything lives in the lower Terminal or Toolbox panel.
- Balance: Finalized cash from closed trades, unchanged while positions stay open.
- Equity: Live value, calculated as Balance plus Floating PnL.
- Margin / Free Margin: Capital committed to open trades versus what's still available.
- Swap & Commission columns: Itemized financing fees per ticket.
TradingView and institutional portals (like Interactive Brokers) split performance into separate views:
- Unadjusted Daily P&L: Realized gains from the current session only.
- Unrealized P&L: Live mark-to-market value on open positions.
- Net Asset Value (NAV): Total liquidation value, factoring in options pricing, futures settlement, and accrued interest.
Crypto exchanges (Binance, Bybit) simplify things down to two figures on the position screen. Unrealized PnL, calculated using the platform's Mark Price rather than the last traded price, and ROE%, which shows that same result as a percentage of posted margin.
P&L vs. Account Balance vs. Equity
Beginners interchangeably use Account Balance, Equity, and Floating P&L, and that mix-up is exactly how accounts get blown up by surprise liquidations.
Account Balance only reflects what's already settled.
Closed trades feed into it; open ones don't touch it at all, so it stays flat no matter how positions are moving in real time.
Equity picks up where Balance leaves off, adding in whatever open positions are worth at this exact moment:
Balance plus Floating PnL, updating tick by tick. Floating P&L itself is just that live component, the paper gain or loss sitting inside open trades, unrealized until something actually closes.
Free Margin narrows things further, subtracting whatever margin is locked into open positions from Equity, and what's left is the capital actually available for new trades or to absorb further drawdown.
Metric | Includes Open Trades? | Calculation | Purpose |
Account Balance | No | Closed trades only | Settled cash baseline |
Equity | Yes | Balance + Floating P&L | Live account valuation |
Floating P&L | Yes | Real-time price variance | Unrealized open profit/loss |
Free Margin | Yes | Equity − Used Margin | Capital available for new trades |
These four numbers move together in one continuous chain: Account Balance adjusts by Floating PnL to produce Equity, and Equity minus Used Margin produces Free Margin.
Important: When adverse price moves drag Equity below the required Maintenance Margin, brokers step in and liquidate positions automatically, closing trades before losses can push the account into a negative balance.
Why P&L Matters in Risk Management?

P&L in trading only tells half the story on its own. What matters more to a serious trading operation is what that P&L data feeds into: position sizing decisions, stop-loss placement, and the long-term protection of trading capital. That's why professional risk management leans on a handful of ratios that go well beyond a simple win-loss count.
- Profit Factor = Gross Profits / Gross Losses, with most institutional systems targeting a result above 1.5.
- Expectancy = (Win Rate × Average Win) − (Loss Rate × Average Loss), the average dollar return per dollar risked.
- R-Multiple converts dollar P&L into units of initial risk, so risking $500 to net $1,500 becomes a +3R result regardless of account size.
- Maximum Drawdown (MDD) = ((Peak Equity − Trough Equity) / Peak Equity) × 100, the largest peak-to-trough decline in account equity.
Each of these exists to answer a question raw dollar P&L can't. Profit Factor shows whether the wins actually outweigh the losses across a full sample, not just a lucky stretch. Expectancy puts a number on the strategy's true statistical edge. R-Multiple strips emotion out of the picture by keeping every trade on the same relative scale. Maximum Drawdown sets the outer boundary for how much pain a strategy can put an account through before leverage needs to come down.
How Prop Firms Calculate P&L?
Passing a prop firm evaluation depends on more than raw trading skill. The way a firm actually calculates PnL in trading against its drawdown rules can decide whether a winning strategy survives the evaluation or gets disqualified on a technicality.
Three drawdown models show up across most prop firm programs:
- Static Drawdown: The breach floor is fixed to the starting balance and never moves. A $100,000 account with a $5,000 static limit only fails at $95,000 equity, no matter how high profits climb.
- End-of-Day Trailing Drawdown: The floor recalculates once daily, based only on the closing balance, ignoring any intraday peak. A $50,000 account with a $2,000 EOD limit that spikes to $53,000 intraday but closes the day at $51,000 carries a next-day floor of $49,000, based on that $51,000 close rather than the higher intraday peak.
- Intraday Trailing Drawdown: The floor updates continuously in real time, based on peak open equity, and unharvested floating profit can raise the breach level mid-trade.
That third model is where most evaluation failures happen. Take a $50,000 account with a $2,000 intraday trailing limit and an initial floor of $48,000. A trade spikes to a $52,000 peak, instantly pushing the floor up to $50,000. The market reverses, the trader exits at breakeven, and equity lands right back at $50,000, exactly on the newly raised floor. The account fails, even though the trader closed that trade with zero realized loss.
Note: Most futures prop accounts stop the trailing floor once it reaches the original starting balance plus a small buffer, converting it into a static limit from that point on.
How to Improve Your Trading P&L?
There's no single fix that turns a losing account into a profitable one. Improving PnL in trading almost always comes down to a set of habits, stacked together and applied consistently over time.
- Cut execution friction: Use limit orders wherever possible to avoid taker fees and capture rebates instead. Avoid placing market orders during low-liquidity windows, like session rollovers, when spreads widen and quietly eat into every fill.
- Prioritize payoff ratio over win rate: A high win rate feels good, but a single oversized loss can erase dozens of small wins. Favoring reward-to-risk setups around 1:2 or 1:3 keeps a strategy profitable even below a 50% win rate.
- Hide the dollar figure: Displaying open positions in pips, ticks, or R-multiples instead of live dollar amounts reduces the emotional pull toward closing trades early out of fear, keeping decisions grounded in technical structure instead.
- Journal in segments, not just totals: Tag every trade by asset class, session window, and setup type. That breakdown shows exactly where the real edge lives and which categories are quietly dragging overall performance down.
Important: These changes stop friction, poor risk-reward selection, and emotional exits from eating into an edge that already exists.
Every serious trader eventually outgrows their own account. The edge you've built deserves more capital behind it. Audacity Capital funds traders who already think this way. So apply today and see where your edge can actually take you.
FAQs
Yes, if floating losses push your account equity below the broker's required maintenance margin, the platform can issue a margin call and automatically liquidate open positions to prevent your balance from going negative. This is a standard risk control across both retail brokerage accounts and crypto derivatives exchanges.
Floating P&L can shift overnight even when market prices stay flat, because of financing charges: forex swap rates or crypto funding fees. Your broker or exchange applies these directly to your open position during the rollover window, changing your equity slightly even when the underlying price hasn't moved at all.
Usually not, since most tax authorities only tax realized gains once a position closes, leaving unrealized P&L untouched until then, with a few notable exceptions. In the US, IRS Section 1256 contracts, like regulated futures, get marked to market at year-end, meaning open profits are taxed annually no matter when the position actually closes.
This happens under an intraday trailing drawdown model, where your loss floor rises in real time with peak open equity. If your trade pulls back hard enough from that peak before you close it, equity can breach the newly raised floor, failing the account even though the trade never closed at a loss.

Готовы применить дисциплинированный риск к криптовалютам? Изучите новые криптоинструменты Audacity Capital и примените свою торговую стратегию.
Узнать большеРассылка
Подпишитесь на нашу рассылку.
Присоединяйтесь к нашему сообществу

Начните свое путешествие сегодня с нашей бесплатной пробной версией
С гордостью демонстрируйте свои навыки и достижения с помощью сертификатов и получайте признание за свой тяжелый труд и преданность делу от потенциальных инвесторов и коллег.
Бесплатная пробная версияПохожие статьи

10 Best Prop Firms in Australia for 2026
Compare 10 prop firms available to Australian traders in 2026, including their challenges, drawdown rules, payouts, platforms and key differences.

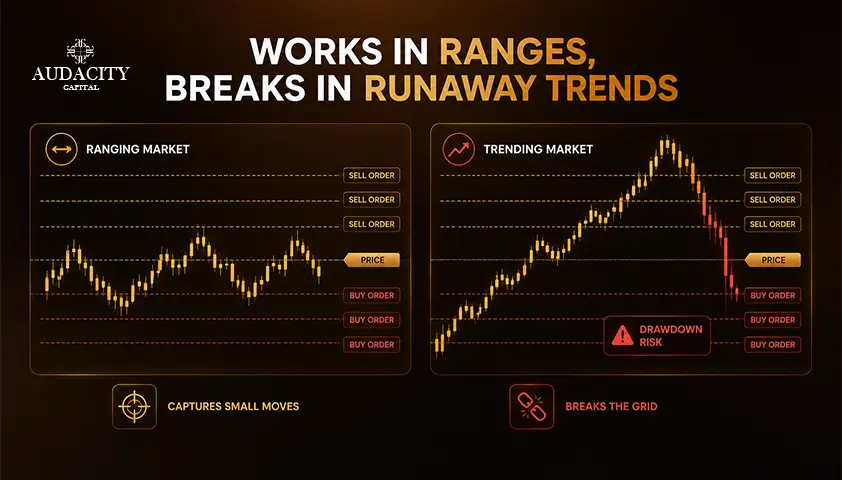
Grid Trading: How It Works and Where It Breaks
Placing orders across a range can profit from chop without predicting direction, but a trend can blow it up. See the mechanics and the failure mode.
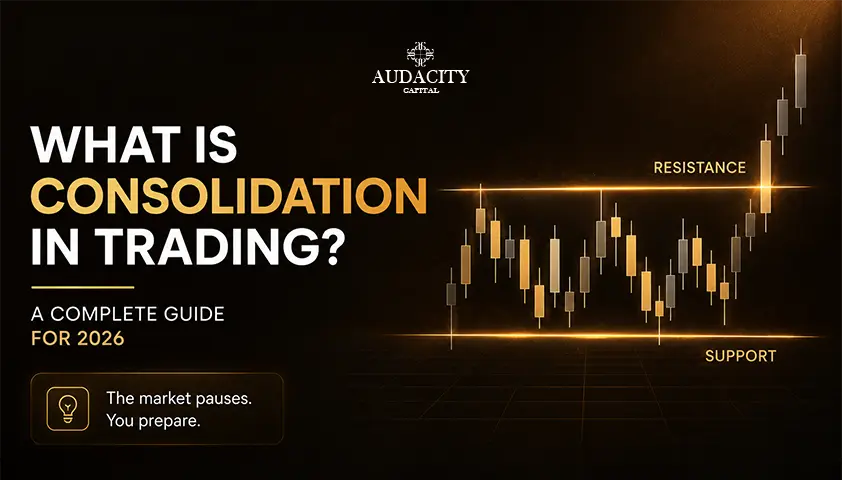
What Is Consolidation in Trading? A Complete Guide for 2026
Learn what consolidation in trading means, why it happens, how to identify consolidation patterns, spot breakouts, avoid false signals, and trade sideways markets.
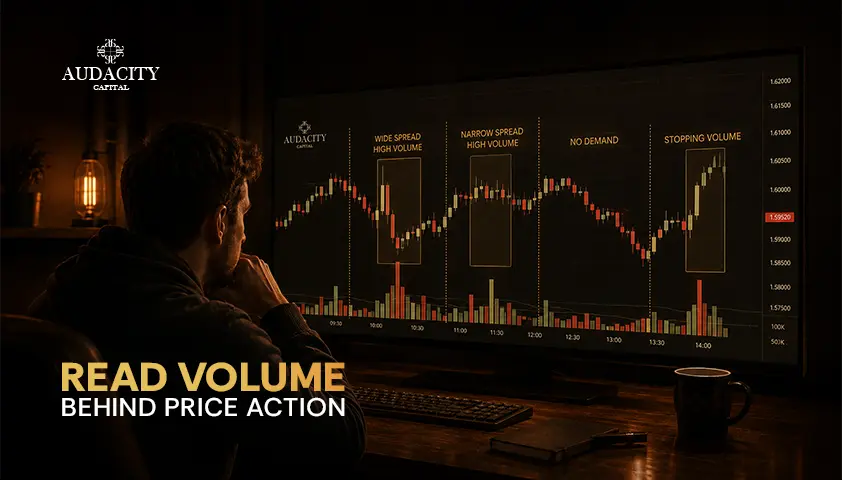
Volume Spread Analysis (VSA) Explained
Learn how volume spread analysis uses price range and volume to reveal supply and demand. Master key signals, market context, and limits.