


How to Use Anchored VWAP in Trading


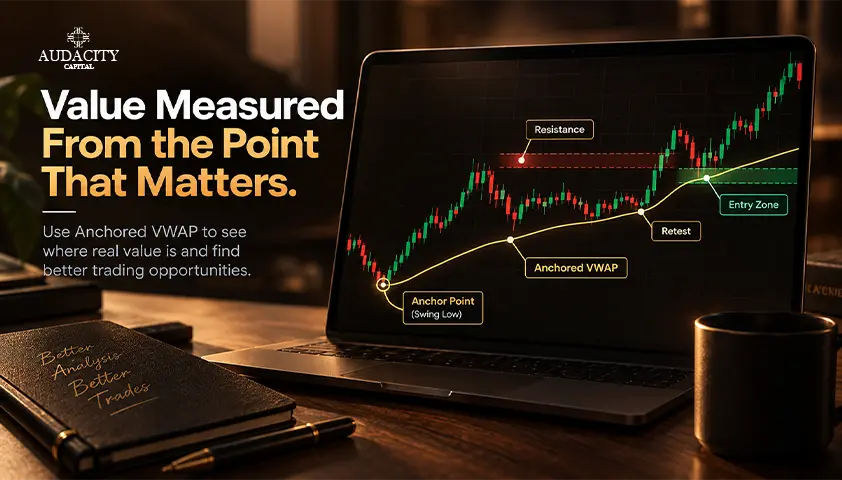
Session VWAP resets at a set time point every day. This works perfectly within the intraday timeframe. However, your move may have started two days back during a breakout or last week after a central bank announcement.
Anchored Volume Weighted Average Price (Anchored VWAP, or AVWAP) helps you overcome this by setting an anchor point where you want to begin your calculation.
In this article, you will find the process of calculating the line, selecting proper anchor points, interpreting price reaction, and recognizing situations when the indicator may mislead traders.
It's educational, not a trading signal, and each of the methods outlined here has risk.
What Is Anchored VWAP
The AVWAP or anchored VWAP is a cumulative volume-weighted average price of a user-chosen bar or event. It is not a session VWAP but it remains active from the anchor to the last bar until the trader moves or removes it.
The average is calculated using each bar's price, weighted by volume. A busy bar exerts more pull than a quiet bar. The result will be the average trade price from your chosen anchor to the latest bar, depending on what data your platform receives.
Two boundaries keep the Anchored VWAP indicator in perspective:
- It is not a forecast. It provides a summary of what has already been traded. It does not inform you what price will do in the future.
- It doesn't specify who was the buyer or seller. The line cannot show you whether there were institutional orders, positions held, or the cost basis of these positions.
You can consider it as a volume-weighted average price calculated starting from the user's selected anchor. This is a very narrow definition and this narrowness is why this tool is so useful for you when used properly.
How Anchored VWAP Is Calculated
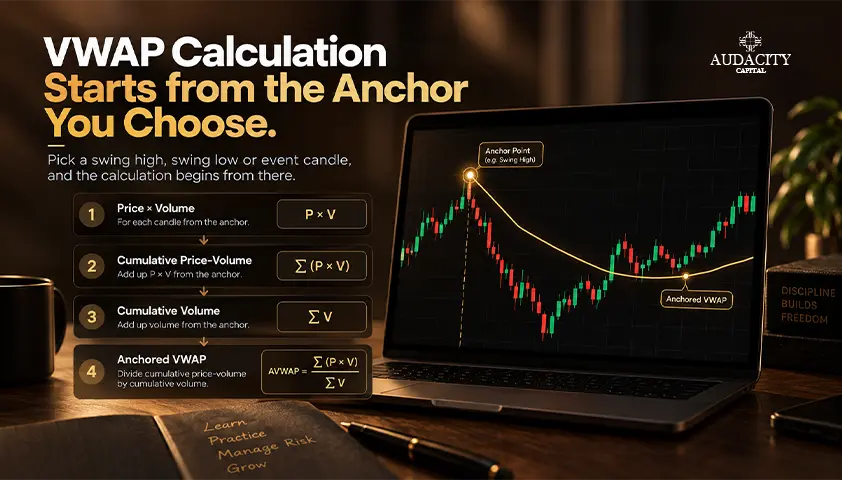
The anchored VWAP formula is in the same family as the standard VWAP:
AVWAP = Σ(Price × Volume) ÷ Σ(Volume), summed from the anchor bar till the current one.
In most platforms the input price is the typical price (High + Low + Close) ÷ 3. Some platforms allow you to use close price or any other price source.
Example (hypothetical with 3 bars after the anchor):
Bar | Typical price | Volume | Price × Volume |
1 | 100.00 | 2,000 | 200,000 |
2 | 102.00 | 1,000 | 102,000 |
3 | 101.00 | 3,000 | 303,000 |
Cumulative price × volume is 605,000. Cumulative volume is 6,000. AVWAP after bar 3 is 605,000 ÷ 6,000 = 100.83. See that bar 3 (the highest volume) pulls the line closer to its price than bar 2 does.
The main difference between AVWAP and session VWAP isn't the math. It is the set of bars that is included. When the anchor is moved, both cumulative totals will change, which will also change the line.
There may also be variations in the source prices, session settings, volume fields, and market feeds of charting platforms. Take a look at those settings before comparing two charts or believing a screenshot.
The two platforms may not give the same value for the same anchor.
Anchored VWAP vs Standard VWAP
The anchored VWAP vs VWAP question comes down to where the calculation starts and when it stops.
The session VWAP usually starts at the beginning of each session and resets at the start of the next session. It answers a current-day question: how has price traded relative to today's volume-weighted average?
Anchored VWAP starts at a bar you choose and extends over any number of sessions. It answers an event-based or swing-based question: How has price moved relative to the volume-weighted average since this particular point?
There is no definite advantage to either. The starting point depends on the question you're asking.
A day trader managing intraday positions may lean on session VWAP, while a swing trader studying a multi-day trend continuation may prefer an anchor at the breakout that started it. There are plenty of traders who use both at the same time for different reasons.
Feature | Standard VWAP | Anchored VWAP |
Starting point | Session open | User-selected bar or event |
Reset | Usually each session | Continues until removed or re-anchored |
Typical use | Current-session context | Event or swing context over a selected time period |
Main decision | What session is being recorded | Which anchor is relevant |
Shared limit | Uses past price and volume | Uses past price and volume |
The last row is the most important. Both versions tell about history. Neither knows what will happen next.
How to Add Anchored VWAP to a Chart
Menus differ by platform, but the process usually follows three steps:
- Select the tool. Find the Anchored VWAP drawing tool or indicator. It is also available at some platforms as a drawing tool and not as an indicator. Others may require a custom indicator. Verify your allowed platform version.
- Click the starting bar. Position the anchor at the starting point of your analysis (the candle).
- Verify your settings. Prior to viewing anything, you need to check price source, session, timezone, and volume.
After placing the anchor, examine its location on the chart. The marker needs to be placed on the right candle, neither a bar before or after.
When studying an event, check the event time and if the chart shows the data before or after the event, or overnight. If you have a chart with extended hours, then the line will look different from a chart with regular hours.
How to Choose the Right Anchor Point
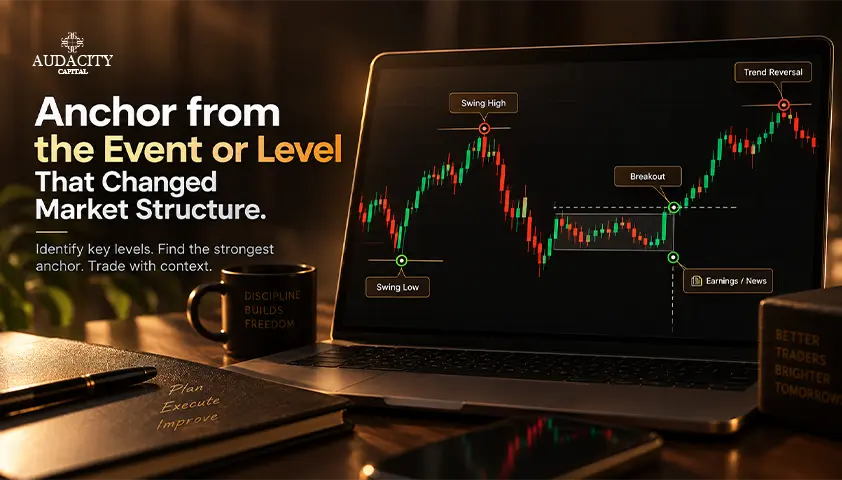
Anchored VWAP anchor points should answer an analytical question. Example: "What is the volume weighted average price since this breakout?" Write that question down before taking the line.
Refrain from selecting a bar due to the fact that the line produced will fit into a later price. This is in retrospect, not in analysis.
1. Major Swing High or Low
Utilize the visible turning point if the objective is to measure the move that started from there. Anchoring at a swing low in an uptrend shows the average traded price since that turning point. Anchoring at a swing high provides the same reference for a decline.
Decide in advance how to place the anchor. This can be the pivot bar, the open, or any other convention that you use that is supported by your platform. Use that decision in all situations.
2. Breakout, Gap, or High-Volume Event
When you're looking to study price action since a breakout, gap, earnings release or economic release, use the first bar of that event.
Verify the event time and session information first. If you are using a chart that also incorporates premarket activity, the gap at the regular open will be different.
3. Calendar Anchor
When your research question is time-focused, use the beginning of a week, month, quarter, or year. For example, a weekly open anchor will display the volume-weighted average of the week.
A calendar boundary is not inherently more significant than another anchor. It is simply a time-based reference, so avoid treating it as a special level.
4. Entry or Campaign Anchor
Some traders use a predetermined entry, position start or any other decision point that they have recorded. This tracks the volume-weighted price since that moment. Remember it's a personal reference. It does not represent a market-wide cost basis.
Anchor | Question it answers | Main caution |
Swing high or low | What is the average traded price since the turn? | The choice of pivot can be subjective |
Breakout or gap | Has price held relative to the event move? | Confirm the first relevant bar and session |
News or earnings event | How has price traded since new information? | Event timing and premarket information are important |
Week, month, quarter, or year open | Where is volume-weighted price from a calendar start? | A calendar boundary is not automatically significant |
Personal entry | How has the market traded since my decision point? | This does not represent every holder's cost basis |
How to Read Anchored VWAP on a Chart
The right interpretation of the line is based on distinguishing what it displays from what you want it to display.
1. Price position
Price above AVWAP indicates that the present price level is above the volume-weighted average which was calculated using this anchor point. Price below means it is below. This is just an observation, not a bullish or bearish indication.
2. Slope
A rising or descending line indicates the dynamics of the cumulative average, depending on the way the new price and volume enter the formula. Each new bar is combined with all previously existing bars.
As a consequence, AVWAP will lag during any rapid movement. The older the anchor point, the more slowly it reacts.
3. Tests and closes
Use precise language for what price does at the line:
- Touch: price reaches the line but shows no clear decision.
- Temporary cross: price moves through the line intrabar, then returns.
- Rejection: price tests the line and closes back on its original side.
- Acceptance: price closes beyond the line and continues trading there.
- Reclaim: price moves back above a line it had lost.
- Loss: price closes below a line it had been holding.
Define your confirmation rule before you study any example, such as a close beyond the line followed by a successful retest. Even with confirmation, the level can fail.
4. Distance
A considerable distance between the price and AVWAP means the extension from the anchored average. This does not mean that the price should always mean-revert. Momentum, volatility, liquidity, and the age of the anchor play roles in what follows.
5. Cost basis language
Describe the line as the average price traded since the anchor. Calling it the average cost basis is an approximate calculation based on traded volume, not the real cost basis of current holders of positions.
How Traders Use Anchored VWAP
The applications below illustrate the way an anchored VWAP strategy can be constructed. They include the name of the anchor, the condition, a potential confirmation, invalidation, and failure. All illustrations are hypothetical.
Trend Pullback to AVWAP
- Anchor: the swing low or breakout bar that started the move.
- Condition: price pulls back toward AVWAP while the broader trend remains upward.
- Possible confirmation: a bullish close back above the line after the test, or a higher low forming near it.
- Invalidation: a clear close below AVWAP and a failure to retest.
- Failure: price slices through the line without hesitation. A touch alone is never an entry.
Reclaim or Loss of AVWAP
- Anchor: a meaningful swing or event before the cross.
- Condition: price crosses the line and closes on the other side.
- Possible confirmation: a retest from the new side that holds.
- Invalidation: the retest fails and price closes back across the line.
- Failure: price bounces between high and low without any momentum. Not all crosses are reversals.
Post-Event Price Context
- Anchor: the first bar of a gap, earnings release or economic announcement on a generic instrument.
- Condition: traders compare later price with the volume-weighted average since the event.
- Possible confirmation: Price holding on one side of the line over multiple sessions.
- Invalidation: repeated closes on the opposite side.
- Failure: The line is overrun by a later event that alters the situation completely.
AVWAP as a Trade Management Reference
- Anchor: The breakout/entry bar.
- Condition: currently a position is available.
- Possible use: Used when price moves beyond the line, partial exits, and trailing risk.
- Invalidation: not just the line but defined by your plan.
- Failure: set the line as an automatic stop. Stop placement should be based on market structure, volatility and position size. It must also follow your trading plan, including any drawdown rules for a funded account.
Hypothetical example: a hold, then a failed test. This sequence uses an imaginary stock index on a 15-minute chart with exchange volume. All prices and outcomes are hypothetical.
- Anchor: on Monday, price breaks above a 4,990 to 5,000 range on rising volume. The trader anchors AVWAP on the breakout candle.
- Initial hold: on Tuesday, price pulls back to AVWAP near 5,020, closes back above it, and holds a retest. The predefined confirmation is met.
- Failed test: on Thursday, price closes below the line at 5,045. The retest from below is rejected at AVWAP, and price closes lower again.
- Exit: the written plan treats a close below the line plus a failed retest as invalidation. The trader exits rather than hoping for a reclaim.
The same line that appeared to act as support on Tuesday stopped working on Thursday. That is normal.
If you illustrate this sequence on a chart, label the anchor candle and AVWAP line. Also mark each test, the invalidation point, and the data source.
Backtesting. Before testing anchored VWAP trading ideas, write down the anchor rule, confirmation, execution timing, costs, stop logic, and exit logic. Then test across many samples, not a handful of memorable charts.
Using Multiple Anchored VWAP Lines
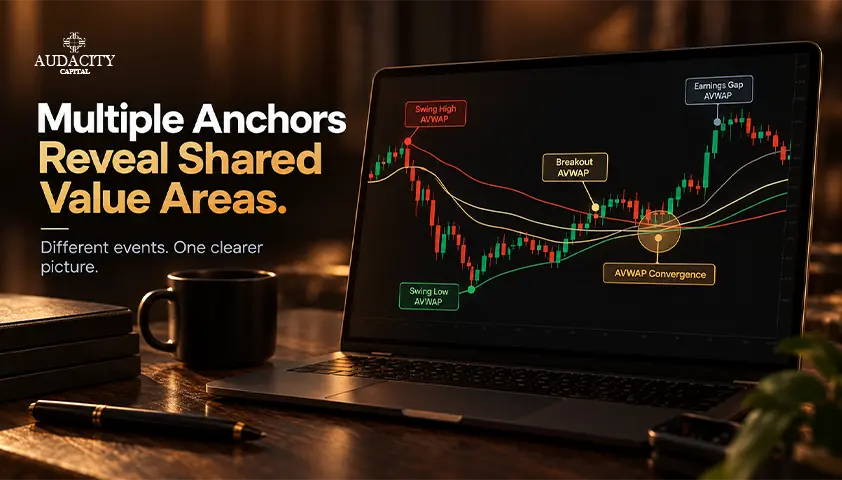
There may be instances when traders will anchor different lines to different valid events, like a major high and a later low. Multiple anchored VWAPs can be used to see how prices relate to multiple moves.
When two or more lines come together, an area is created where different anchored averages are all grouped closely. This is what is referred to as an area of confluence. It is not a guarantee of support or resistance; nor does it imply an institutional position.
Keep track of how price acts in the area and determine your invalidation outside it. In this case, chart hygiene is very important. Only use two or three valid anchors based on one question each.
With too many lines, it becomes possible to identify a level close to almost any price, thereby transforming your analysis into just storytelling. Remove those anchors that no longer provide answers to your questions.
Some trading platforms provide standard deviation bands around the AVWAP as well. This is another form of a platform-specific extension and works best as an overlay.
Does Anchored VWAP Work in Forex and Other Markets
You can plot the line on most liquid markets, but the meaning depends on what volume data feeds the calculation.
Stocks and futures
Exchange-traded stocks and futures normally use venue-reported exchange volume. The line still depends on the instrument, trading hours, continuous-contract construction, and your selected data feed.
Spot forex
Spot FX trades over the counter, so a single consolidated record of executed volume is generally not available to retail platforms. Many show tick volume, which counts price changes, or broker-specific feed activity.
That makes anchored VWAP forex readings a feed-specific measure, and values can differ across brokers. Currency futures volume comes from an exchange, so it is not the same dataset as spot FX either.
If you trade forex, compare AVWAP values only on one consistent feed.
Crypto
Crypto volume is venue-specific unless your platform aggregates multiple exchanges. Identify the source before treating the line as market-wide.
Market | Volume input may represent | Caution |
Exchange stocks and futures | Executed venue volume | Check session hours and contract or venue |
Spot forex | Tick volume or broker feed activity | Values can differ by provider |
Crypto | One exchange or an aggregate feed | Name the venue or aggregation method |
Limitations and Common Mistakes
AVWAP trading becomes unreliable when traders forget what the line is. These are the mistakes worth avoiding.
- Subjective anchors. Two traders can select different bars and get different lines. Write your anchor rule before inspecting later reactions.
- Hindsight fit. Moving the anchor until the line touches later highs or lows is curve fitting. Keep the original anchor in a screenshot or journal entry, and test the rule across many samples.
- Lag and dependence on history. AVWAP uses accumulated past data. An old high-volume period can keep influencing the line long after market context has changed.
- Treating the line as exact. Use AVWAP as a reference or zone. Price can overshoot it, cross it repeatedly, or ignore it entirely. A single touch is not evidence of a repeatable edge.
- Ignoring data and sessions. Different feeds, tick volume, overnight sessions, premarket data, roll adjustments, and chart timezones can all change the calculation. Verify them before drawing conclusions.
- Too many anchors. Adding lines after the move creates false confluence and makes every outcome look explainable. Keep only anchors linked to predeclared questions.
- Unsupported institutional claims. AVWAP does not reveal institutional entries or levels that large players must defend. It shows a volume-weighted average from the selected data, not trader identity or intent.
Conclusion
Using Anchored VWAP well follows a repeatable sequence. Define your question, choose the anchor before viewing the outcome, verify your data settings, read price around the line, and confirm any setup with a written risk plan.
The line gives context from a chosen starting point. It does not predict.
When your process is tested and documented, Audacity Capital's Ability Challenge, Ability One, and FTP give you structured routes to trade company capital. Review the program rules and choose the path that fits your plan.
Frequently Asked Questions
There is no universally best anchor point. You need to find the best-defined event, swing high/low, breakout, or calendar point, based on your analysis question.
Write down the anchor criteria before you look at the subsequent price, so the choice reflects your plan rather than hindsight.
No. Both metrics have their place, as they answer different questions. Standard VWAP is best suited for the current-session analysis, since it starts from the session open and is recalculated daily.
The Anchored VWAP is most appropriate for a selected event or multi-session trend because it can start from any point. Many traders use both, each for its own purpose.
Yes, as long as your chosen anchor and the timeframe correspond to your swing strategy. Anchoring at the breakout or swing that triggered a multi-day movement is usually done.
However, the line is still responsive to past data, and it may break down, which is why you should have structure and invalidation along with it.
Yes, but each line needs an independent reason, such as a major high and a later low. Where lines converge, you get a zone worth observing, not a guaranteed signal. Keep the count to two or three anchors so the chart stays readable and honest.
It is reactive rather than predictive. AVWAP is built from accumulated historical price and volume, so every new bar is blended with older data. That makes it useful for context but slower to respond to sharp moves, especially when the anchor sits far back in time.
It can be plotted on forex charts, but spot forex volume is often tick volume or broker-specific feed data rather than consolidated executed volume.
Compare values only on a consistent data feed, and test the exact implementation on your platform before relying on it in live trading.

Handa nang maglapat ng disiplinadong panganib sa crypto? Galugarin ang mga bagong instrumento ng crypto ng Audacity Capital at dalhin ang iyong diskarte sa pangangalakal.
Matuto PaNewsletter
Sumali sa aming newsletter.
Sumali sa Aming Social Community

Simulan ang Iyong Paglalakbay Ngayon Gamit ang Aming Libreng Pagsubok
Ipagmalaki ang iyong mga kasanayan at tagumpay sa pamamagitan ng mga sertipiko at makakuha ng pagkilala para sa iyong pagsusumikap at dedikasyon mula sa mga potensyal na mamumuhunan at kasamahan.
Libreng PagsubokMga Kaugnay na Artikulo
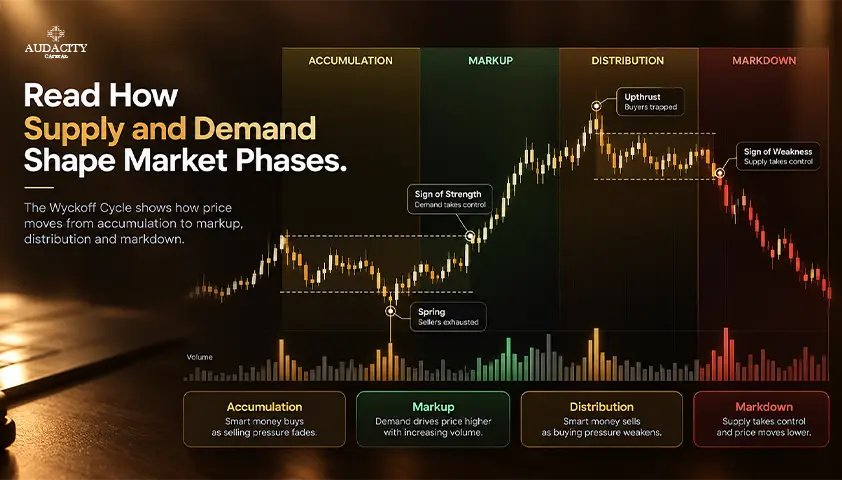
Wyckoff Method Explained: Phases, Rules and Examples
Learn the Wyckoff Method, its three laws, accumulation and distribution phases, trade examples, and the limits of price and volume analysis.

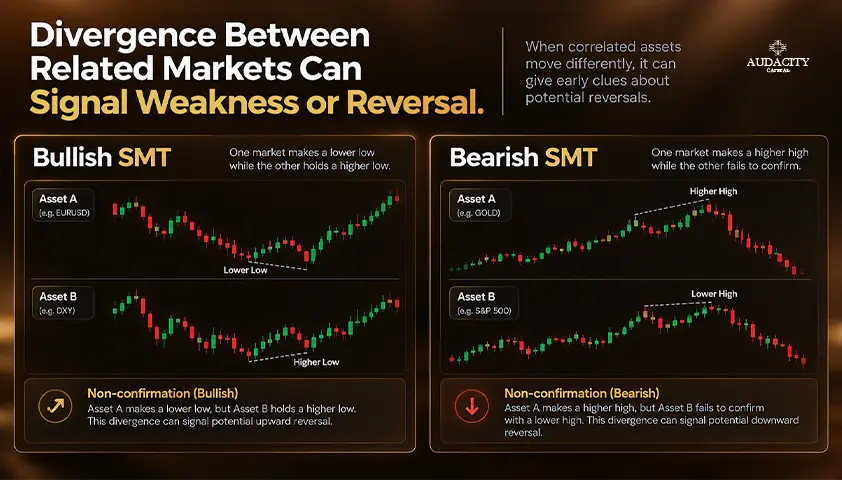
SMT Divergence in Trading: Bullish and Bearish Examples
Learn what SMT divergence means, how bullish and bearish setups form, which markets traders compare, and how to confirm signals and manage risk.
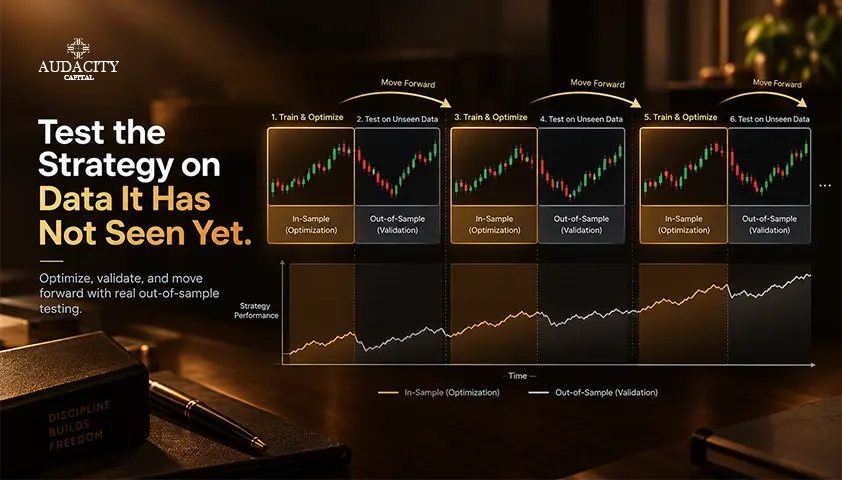
Walk-Forward Analysis in Trading: A Practical Guide
Learn how walk-forward analysis works in trading: in-sample and out-of-sample windows, rolling vs anchored designs, a worked example, and how to read results.
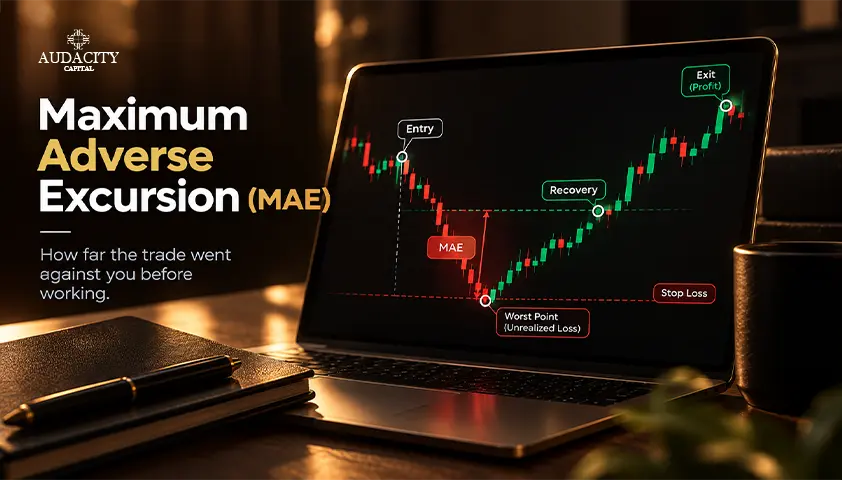
Maximum Adverse Excursion Explained for Traders
Learn how maximum adverse excursion measures a trade's worst open loss, how to calculate MAE, read charts, test stops, and avoid common errors.