


Best Time Frame for Day Trading (2026): 5-Minute vs 15-Minute vs 1-Hour Charts



What Is the Best Time Frame for Day Trading?
The best time frame for day trading is the 15-minute chart for identifying trade setups and the 5-minute chart for executing precise entries. This combination offers the ideal balance between reliable trading signals, manageable trade frequency, and effective risk management.
Most professional day traders also use the 1-hour chart to confirm the overall market trend and the daily chart to identify major support and resistance levels. By combining multiple time frames, traders can improve decision-making, reduce false signals, and increase the probability of successful trades across forex, stocks, futures, and cryptocurrency markets.
Best Day Trading Time Frames at a Glance
Time Frame | Best For | Trade Frequency | Signal Quality |
|---|---|---|---|
1-Minute | Scalping | Very High | Low |
5-Minute | Active Day Trading | High | Medium |
15-Minute | Most Day Traders | Medium | High |
30-Minute | Part-Time Traders | Low | High |
1-Hour | Trend Confirmation | Very Low | Very High |
Our Recommendation
If you're new to trading, start with the 15-minute chart. It provides cleaner price action, fewer false signals, and more time to make decisions.
If you're an experienced trader, use:
- 15-minute chart for trade setups
- 5-minute chart for entries and exits
- 1-hour chart for trend confirmation
This workflow balances opportunity, reliability, and risk management while avoiding the excessive noise found on shorter time frames.
Why the 15-Minute Chart Is the Best Time Frame for Most Day Traders
The 15-minute chart has become one of the most widely used analysis time frames because it strikes the right balance between speed and reliability. Unlike shorter charts, which are often filled with random price fluctuations, the 15-minute chart provides enough market structure to identify high-probability trading opportunities while still generating multiple setups throughout the trading session.
Rather than reacting to every small price movement, traders can focus on meaningful trends, support and resistance levels, and higher-quality chart patterns. This slower pace also allows more time to evaluate risk, calculate position size, and plan entries without making rushed decisions.
Cleaner Price Action
The 15-minute chart filters out much of the intraday noise that affects lower time frames. Trends become easier to identify, support and resistance levels are more reliable, and common chart patterns have a higher probability of success.
Better Risk Management
With more time between candles, traders can plan trades carefully, calculate stop-loss levels, and evaluate risk-to-reward ratios before entering a position. This disciplined approach often leads to more consistent results.
Reliable Technical Signals
Indicators such as moving averages, RSI, MACD, VWAP, and trendlines generally produce more dependable signals on the 15-minute chart than on the 1-minute or 5-minute charts because there is less market noise.
Suitable Across Multiple Markets
The 15-minute chart performs well across:
- Forex
- Stocks
- Futures
- Indices
- Commodities
- Cryptocurrency
This versatility makes it an excellent choice for both beginners and experienced traders.
Why Professionals Still Use Lower Time Frames
Although the 15-minute chart is ideal for identifying trade setups, many professional traders switch to the 5-minute chart only after a setup has been confirmed. The lower time frame helps them fine-tune entries, tighten stop-loss placement, and improve risk-to-reward ratios without changing the overall trade idea.
What Is a Trading Time Frame?
A trading time frame refers to the amount of time represented by each candlestick or price bar on a chart.
For example:
- A 1-minute chart displays one minute of price movement per candle.
- A 5-minute chart displays five minutes of price movement per candle.
- A 15-minute chart displays fifteen minutes of price movement per candle.
- A 1-hour chart displays one hour of market activity per candle.
The time frame you choose directly influences:
- The number of trade opportunities you see each day
- The size of your stop-loss and profit targets
- The amount of market noise you experience
- How long your positions remain open
- Your emotional workload and screen time requirements
Many traders spend years searching for the perfect indicator while overlooking one of the most important decisions in trading: choosing the right chart time frame.
Why the Best Time Frame Is Different for Every Trader
One of the biggest misconceptions in trading is that there is a universally perfect time frame.
There isn't.
A 1-minute chart that works exceptionally well for an experienced scalper can be disastrous for a beginner. Likewise, a 30-minute chart that suits a part-time trader may feel too slow for someone who prefers active trading throughout the session.
The best time frame depends on several factors:
Your Trading Style
Scalpers, day traders, and swing traders all operate on different time horizons.
- Scalpers focus on capturing small price movements and often use 1-minute and 5-minute charts.
- Day traders typically rely on 5-minute and 15-minute charts.
- Swing traders often focus on 1-hour, 4-hour, and daily charts.
Your Available Time
If you can monitor the market for six hours per day, shorter time frames may be suitable.
If you only have one or two hours available, longer time frames are generally more practical.
Your Experience Level
Lower time frames generate more signals, but they also generate more false signals.
New traders often perform better on 15-minute and 30-minute charts because they have more time to think and make decisions.
Your Risk Tolerance
Fast charts create faster decisions.
Some traders thrive in that environment. Others make emotional mistakes when forced to react quickly.
Understanding your own psychology is just as important as understanding the market.
5-Minute vs 15-Minute Chart: Which Is Better for Day Trading?
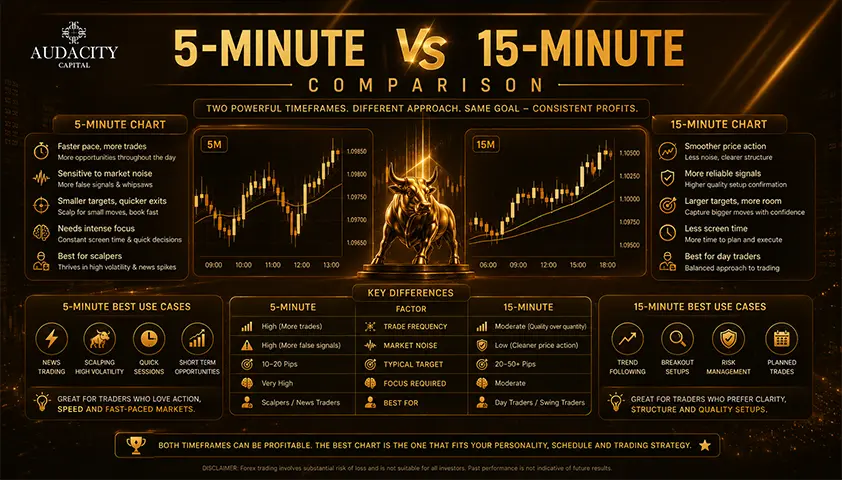
Feature | 5-Minute Chart | 15-Minute Chart |
|---|---|---|
Trade Frequency | Higher | Lower |
Signal Quality | Medium | High |
Noise | Higher | Lower |
Best For | Entries | Analysis |
Beginner Friendly | No | Yes |
Verdict: For most traders, the 15-minute chart is better for finding setups, while the 5-minute chart is better for timing entries.
Best Time Frame for Beginner Day Traders
If you're new to day trading, the best time frame to start with is the 15-minute chart.
Many beginners are naturally drawn to the 1-minute chart because it appears exciting and offers constant trading opportunities. However, shorter time frames also generate significantly more market noise, false signals, and emotional pressure. New traders often end up overtrading, chasing price movements, and making impulsive decisions.
The 15-minute chart provides a much better learning environment. It slows the market down enough for you to analyze price action, identify support and resistance levels, and make decisions without feeling rushed.
Why Beginners Should Start with the 15-Minute Chart
Cleaner Price Action
The 15-minute chart filters out much of the random market movement found on lower time frames. Trends are easier to identify, chart patterns are more reliable, and support and resistance levels become clearer.
More Time to Make Decisions
Unlike the 1-minute chart, where market conditions can change within seconds, the 15-minute chart gives traders time to evaluate setups, calculate risk, and plan entries properly.
Reduced Emotional Pressure
Many new traders struggle because they react emotionally to every price fluctuation. The slower pace of the 15-minute chart helps reduce stress and encourages a more disciplined approach to trading.
Easier Risk Management
Because setups are generally more structured, beginners can focus on learning position sizing, stop-loss placement, and risk-to-reward ratios without being distracted by constant market noise.
A Simple Beginner Workflow
A practical approach for new traders is:
- Use the 1-hour chart to identify the overall market trend.
- Use the 15-minute chart to find potential trade setups.
- Once comfortable, use the 5-minute chart to refine entries and exits.
This approach allows you to understand both the bigger picture and the finer details of trade execution without becoming overwhelmed.
What About the 1-Minute Chart?
Most beginners should avoid the 1-minute chart.
While it can generate a large number of trading opportunities, it also produces more false signals and requires rapid decision-making. Even experienced traders often find the 1-minute chart challenging.
There is nothing wrong with eventually trading shorter time frames, but learning on the 15-minute chart first will help build the skills and discipline needed for long-term success.
Final Recommendation for Beginners
If you're just starting your trading journey, focus on the 15-minute chart for analysis and the 1-hour chart for trend confirmation. Once you become consistently profitable and comfortable reading market structure, you can gradually incorporate the 5-minute chart for more precise entries.
The goal is not to take more trades. The goal is to take better trades.
Every Key Time Frame Explained
1-Minute Chart
The 1-minute chart is the fastest commonly used time frame. Each candle represents just 60 seconds of price action.
Best for: Scalpers who want to enter and exit multiple trades within minutes, extracting small, consistent profits from micro-movements.
Pros:
- Maximum number of trade setups per session
- Very tight stop-loss placement is possible
- Ideal for volatile, fast-moving markets
Cons:
- Extremely noisy — most signals are false
- Demands near-constant screen attention
- Psychological pressure is high; mistakes multiply fast
- High transaction costs from frequent trading
Who should use it: Experienced traders only. If you're new, the 1-minute chart will bleed your account before you learn to read it.
5-Minute Chart
The 5-minute chart is one of the most popular choices among active day traders and is the sweet spot for many scalping strategies.
Best for: Day traders who want frequent setups but with more reliability than the 1-minute chart.
Pros:
- Good balance between trade frequency and signal quality
- Still fast enough to capture intraday momentum moves
- Works well with RSI, MACD, and moving average crossovers
Cons:
- Still generates considerable noise
- Requires active monitoring throughout the session
- News events can instantly invalidate setups
Who should use it: Active day traders who are comfortable monitoring markets throughout the trading session.
15-Minute Chart
The 15-minute chart is arguably the most reliable intraday time frame for the majority of day traders. It filters out the noise of the 1-minute and 5-minute charts while still offering multiple opportunities per session.
Best for: Day traders who want high-quality setups without staring at charts every minute.
Pros:
- Significantly cleaner price action than shorter frames
- Works beautifully with support/resistance levels, trend lines, and candlestick patterns
- Allows time to analyze and act without panic
- Preferred by professional day traders for structural analysis
Cons:
- Fewer trade setups than shorter time frames
- Larger stop-losses required (can mean smaller position sizes)
Who should use it: Intermediate-to-advanced day traders. Also recommended as the first intraday time frame beginners should learn.
Pro Tip: Many professional traders use the 15-minute chart for market structure and then drop to the 5-minute for precise entries.
30-Minute Chart
The 30-minute chart sits between short-term day trading and the longer trend-identification frames. It's particularly useful for identifying intraday trends early in a session.
Best for: Day traders who want a bird's-eye view of the session's direction without going all the way to the hourly chart.
Pros:
- Excellent for identifying opening range breakouts
- Strong signals with high completion rates
- Works well for gap plays and earnings momentum trades
Cons:
- Limited number of setups per day
- Not ideal for volatile, fast-moving days
Who should use it: Part-time traders or those who can only monitor charts during specific windows (e.g., the first 90 minutes of the NYSE session).
1-Hour Chart
The 1-hour (H1) chart is the primary analysis frame for many day traders. It reveals dominant intraday trends clearly and is often used as the "bias-setting" chart.
Best for: Setting directional bias for the day; confirming whether to look for long or short setups on lower time frames.
Pros:
- Very reliable trend identification
- Much less noise than sub-hourly charts
- Ideal for identifying key intraday support and resistance zones
Cons:
- Very few direct trade entries
- Not suited as a primary execution frame for day trading
Who should use it: All day traders should reference the 1-hour chart for context — even if they execute on the 5-minute or 15-minute.
4-Hour Chart
The 4-hour chart is the bridge between day trading and swing trading. While day traders don't execute directly from it, it provides crucial context about the multi-day trend.
Best for: Identifying the broader market direction and high-confluence areas where major institutional orders cluster.
Pros:
- Shows where the "smart money" is positioned
- Reveals major support/resistance zones that matter for days
- Eliminates the risk of trading against the dominant trend
Cons:
- Not practical for executing same-day entries
- Moves are too slow for pure day trading strategies
Who should use it: Every day trader should check the 4-hour chart before the session begins. It's your compass.
Example: Using the 15-Minute and 5-Minute Charts Together
Example:
- Daily chart shows an uptrend.
- 1-hour chart confirms higher highs.
- 15-minute chart pulls back to support.
- 5-minute chart forms a bullish engulfing candle.
- Entry triggered.
- Stop below support.
- Target previous high.
The Multi-Timeframe Analysis Method
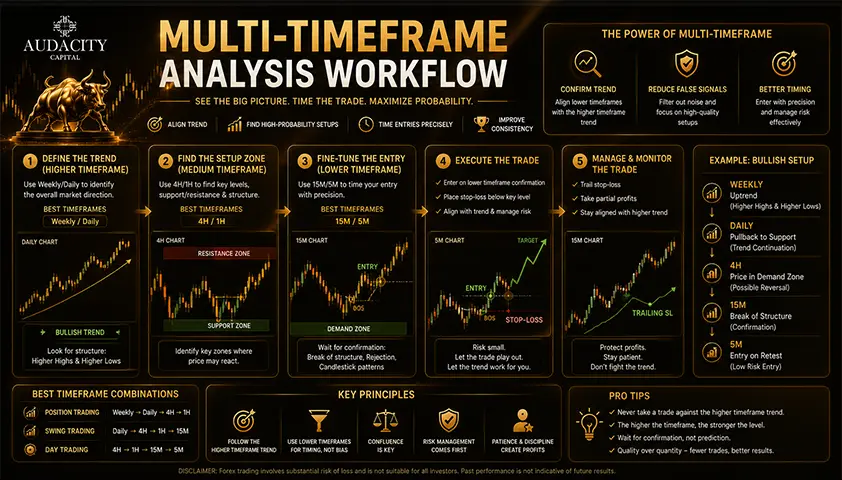
This is the single biggest edge most day traders are not using.
Multi-Timeframe Analysis (MTFA) means reading the same market on 3 different time frames simultaneously — one for big-picture context, one for structure, and one for precise entries. Professional traders almost universally use this approach.
The 3-Chart Framework
Step 1 — The Context Chart (High Time Frame) Use the daily or 4-hour chart to answer: "What is the dominant trend? Where are the major support and resistance zones?"
Only look for trades in the direction of this trend. If the daily chart is making higher highs and higher lows → only look for long entries.
Step 2 — The Structure Chart (Medium Time Frame) Move to the 1-hour or 15-minute chart. Ask: "Where is price pulling back to within the overall trend? Is there a confluence zone where buyers/sellers are likely to step in?"
This is where you identify your trade zone — you're not entering yet, you're watching.
Step 3 — The Entry Chart (Low Time Frame) Drop to the 5-minute or 1-minute chart. Wait for a specific trigger signal — a candlestick reversal pattern, indicator crossover, or break of structure — right at the zone you identified on the structure chart.
This allows you to:
- Enter with very high precision
- Place a tight stop-loss just outside the entry zone
- Target the move identified on the higher time frame
Why MTFA Works
When a trade setup aligns across three time frames, you have institutional-level confluence. Higher time frames show you where large players are positioned. Lower time frames show you exactly when momentum shifts in your favor. Together, you get high-probability setups with controlled risk.
Example: The daily chart shows EURUSD in an uptrend. The 1-hour chart shows a pullback to a key support zone. The 5-minute chart shows a bullish engulfing candle. Three time frames confirm the same trade → high-confidence long entry.
Which Time Frame Is Right for You?
If you are... | Best Time Frame |
|---|---|
Beginner | 15-Minute |
Scalper | 1-Minute + 5-Minute |
Active Day Trader | 5-Minute + 15-Minute |
Part-Time Trader | 30-Minute |
Professional | 15-Minute + 5-Minute + 1-Hour |
Best Time Frame by Experience Level
The ideal day trading time frame changes as your experience grows. Beginners benefit from slower charts that provide more time to analyze the market, while experienced traders often use multiple time frames to improve trade execution and risk management.
Beginners
Recommended Time Frames:
- 15-Minute (Primary)
- 1-Hour (Trend Confirmation)
If you're new to day trading, start with the 15-minute chart. It provides cleaner price action, fewer false signals, and enough time to analyze each setup before entering a trade.
Use the 1-hour chart to understand the broader market trend, then look for high-quality setups on the 15-minute chart. Avoid the 1-minute chart until you've built consistency and confidence.
Why it works:
- Less market noise
- Better decision-making
- Lower emotional pressure
- Easier risk management
Intermediate Traders
Recommended Time Frames:
- 15-Minute (Setup)
- 5-Minute (Entry)
- 1-Hour (Trend)
Once you have a consistent trading plan, combine the 15-minute chart with the 5-minute chart. Use the 15-minute chart to identify trading opportunities and switch to the 5-minute chart to fine-tune entries and stop-loss placement.
This approach increases precision without sacrificing trade quality.
Why it works:
- Better entry timing
- Improved risk-to-reward ratios
- More trading opportunities
- Greater confidence in execution
Advanced Traders
Recommended Time Frames:
- 1-Hour (Context)
- 15-Minute (Setup)
- 5-Minute (Execution)
- 1-Minute (Optional Precision)
Advanced traders often use multi-timeframe analysis to align trades across several charts. The higher time frames define the market trend, while lower time frames provide accurate entry and exit signals.
The 1-minute chart should only be used to refine entries after a valid setup has already been identified on higher time frames.
Why it works:
- Higher trade precision
- Better timing
- Increased flexibility
- Enhanced trade management
Professional Traders
Recommended Time Frames:
- Daily (Market Context)
- 1-Hour (Trend)
- 15-Minute (Trade Setup)
- 5-Minute (Entry)
- 1-Minute (Optional Execution)
Professional traders rarely rely on a single chart. Instead, they combine multiple time frames to create a complete trading plan.
A typical workflow looks like this:
- Daily chart: Identify major support, resistance, and overall market bias.
- 1-hour chart: Confirm the intraday trend.
- 15-minute chart: Find high-probability trade setups.
- 5-minute chart: Execute the trade with precise timing.
- 1-minute chart (optional): Refine entries during fast-moving markets.
This structured process helps professionals stay aligned with the broader trend while improving entry quality and maintaining disciplined risk management.
Quick Comparison
Experience Level | Recommended Time Frames | Best Use |
|---|---|---|
Beginner | 15-Min + 1-Hour | Learn market structure and trend analysis |
Intermediate | 15-Min + 5-Min + 1-Hour | Improve entries and trade execution |
Advanced | 1-Hour + 15-Min + 5-Min (+ 1-Min) | Multi-timeframe analysis and precision entries |
Professional | Daily + 1-Hour + 15-Min + 5-Min (+ 1-Min) | Institutional-style market analysis and execution |
Best Time Frame by Trading Style
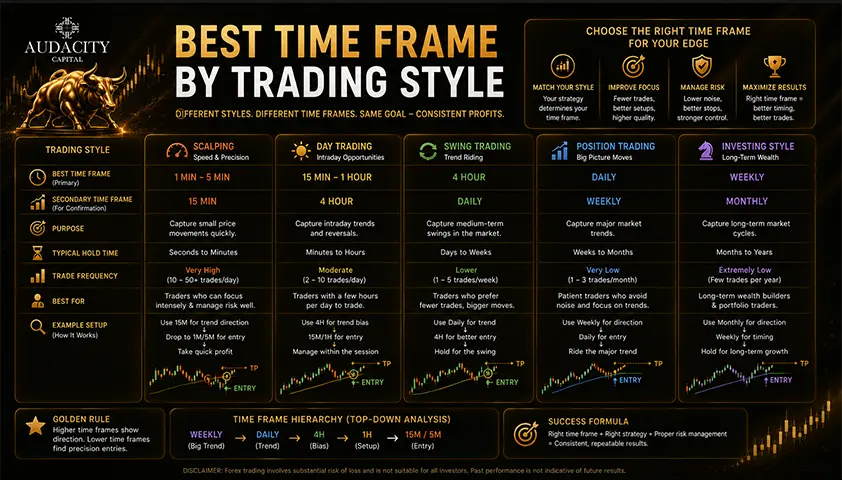
Scalpers → 1-Minute and 5-Minute Charts
Scalpers are the sprinters of trading. They want to be in and out of positions within minutes (sometimes seconds), stacking small wins throughout the day. The 1-minute chart is where most setups are found, with the 5-minute used for confirmation and context.
Recommended setup:
- Execute entries: 1-minute chart
- Confirm structure: 5-minute chart
- Identify bias: 15-minute chart
Key characteristics:
- May execute 20–100+ trades per day
- Tight stop-losses (a few pips/ticks/cents)
- Requires broker with low spreads and fast execution
- High leverage often used (with strict risk management)
Day Traders → 5-Minute and 15-Minute Charts
This is where most active traders live. Day traders open and close all positions within a single session, typically trading 2–10 setups per day.
Recommended setup:
- Execute entries: 5-minute chart
- Analyze structure: 15-minute chart
- Set directional bias: 1-hour chart
- Understand context: 4-hour or daily chart
Key characteristics:
- No overnight positions
- Stop-losses are moderate in size
- Risk is contained to the trading session
Swing Traders (with Intraday Entries) → 1-Hour and 4-Hour Charts
Some swing traders use intraday charts only to time entries into multi-day positions. They don't care about 5-minute noise — they want to enter a swing trade at the best possible intraday price.
Recommended setup:
- Identify trade: Daily chart
- Plan entry zone: 4-hour chart
- Time the entry: 1-hour or 15-minute chart
Best Time Frame for Different Markets
Different markets have different characteristics that affect which time frame works best.
Forex (Currency Pairs)
- Scalpers: 1-minute and 5-minute charts
- Day traders: 15-minute and 1-hour charts
- Best sessions: London and New York overlap (most liquidity)
- Note: Forex runs 24 hours, so time-of-day matters more than in stock markets. The 15-minute chart is particularly effective during high-volume sessions.
Stocks (Equities)
- Most active hours: 9:30–11:30 AM and 3:00–4:00 PM EST
- Scalpers: 1-minute chart during the open
- Day traders: 5-minute and 15-minute charts
- Avoid: The 12:00–2:00 PM "lunch hour" tends to have low volume and unreliable signals on short time frames
Futures (ES, NQ, CL, GC)
- Most popular: 5-minute chart for entries, 15-minute for structure
- Index futures (ES/NQ): The 5-minute chart is extremely popular due to high liquidity
- Commodities (Oil, Gold): 15-minute and 30-minute charts are preferred due to wider spreads
Crypto (Bitcoin, Altcoins)
- Trades 24/7, so session timing matters differently
- Day traders: 15-minute and 1-hour charts are effective
- Scalpers: 5-minute charts work but beware of weekend low-liquidity periods
- Higher volatility means wider stop-losses are needed on any time frame
Best Indicators by Time Frame
Time Frame | Best Indicators |
|---|---|
1-Min | VWAP, EMA |
5-Min | VWAP, RSI |
15-Min | EMA, MACD |
30-Min | EMA |
1-Hour | Trendlines |
Real Trading Exampes
Imagine you're trading EUR/USD:
- Daily Chart: Overall trend is bullish.
- 1-Hour Chart: Price is pulling back to a key support level.
- 15-Minute Chart: A bullish setup forms at support.
- 5-Minute Chart: A bullish engulfing candle confirms the entry.
- Stop-Loss: Below the recent swing low.
- Take-Profit: Previous intraday resistance.
- Result: A high-probability trade aligned with the broader trend and executed with precise timing.
Risk Management Across Time Frames
Your choice of time frame directly affects your risk management strategy. Shorter time frames generate more trading opportunities but also produce more market noise, leading to tighter stop-losses, more frequent trades, and higher transaction costs. Longer time frames provide cleaner price action and more reliable signals but require wider stop-losses and greater patience.
For most day traders, using the 15-minute chart for trade setups and the 5-minute chart for entries offers the best balance between risk, trade frequency, and reward. Regardless of the time frame you choose, always risk only a small percentage of your trading capital on each trade and maintain a consistent risk-to-reward ratio of at least 1:2.
Common Mistakes When Choosing a Time Frame
Mistake 1: Starting Too Small
New traders often gravitate to 1-minute charts because they seem more "active." This is a trap. Shorter time frames produce more noise, more false signals, and more emotional decisions. Beginners should start with the 15-minute or even 30-minute chart and only move shorter after building consistency.
Mistake 2: Switching Time Frames Mid-Trade
If you enter a trade based on a 15-minute setup, don't switch to the 1-minute chart once you're in. The 1-minute chart will almost always make the trade look worse at some point, leading to premature exits or panic. Commit to your entry time frame.
Mistake 3: Ignoring Higher Time Frames Entirely
Executing entirely from a 5-minute chart without checking the daily or 4-hour trend is like driving while looking only at your feet. You'll miss the big picture and trade against dominant institutional flows.
Mistake 4: Using the Same Time Frame for All Markets
The best time frame for EUR/USD may not be the best for Apple stock or Bitcoin. Each market has unique volatility and liquidity characteristics. Test your time frame in the specific market you trade.
Mistake 5: Not Testing Before Going Live
Your preferred time frame should be backtested and forward-tested on a demo account before you risk real money. What feels right intuitively may not perform well in practice.
How to Find YOUR Best Time Frame (Step-by-Step)
Follow this process to systematically identify the time frame that suits you:
Step 1: Define your trading style. Are you scalping, day trading, or swing trading? This narrows your range significantly (see the style guide above).
Step 2: Assess your available time. How many hours can you realistically watch charts? More time = shorter time frames are viable. Less time = stick to 15-minute and above.
Step 3: Start with the 15-minute chart. Regardless of your style, begin here. It's reliable, readable, and forgiving enough to learn on.
Step 4: Paper trade for 30 days. Use a demo account to practice your strategy on the 15-minute chart. Track every trade in a journal.
Step 5: Evaluate your results. If you're profitable (or near-profitable) on paper, test the same strategy on the 5-minute chart. If results improve, stay there. If they worsen, return to the 15-minute.
Step 6: Add a higher time frame. Once comfortable, add the 1-hour chart to your workflow for context and bias confirmation.
Step 7: Refine, don't chase. Don't constantly switch time frames looking for better results. Consistency on one time frame beats mediocrity across five.
Quick Reference Cheat Sheet
Time Frame | Best For | Trade Frequency | Signal Reliability | Screen Time Needed |
1-Minute | Scalpers | Very High (50–100+/day) | Low | Constant |
5-Minute | Active Day Traders | High (10–30/day) | Medium | High |
15-Minute | Day Traders | Medium (3–10/day) | Medium-High | Moderate |
30-Minute | Part-Time Day Traders | Low-Medium (1–5/day) | High | Low-Moderate |
1-Hour | Bias & Trend Confirmation | Low (1–3/day) | High | Low |
4-Hour | Context & Swing Entry Timing | Very Low | Very High | Minimal |
Daily | Big Picture & Key Levels | Reference Only | Highest | Reference Only |
Day Trading vs Swing Trading
Day Trading | Swing Trading |
|---|---|
1M–30M | 4H–Daily |
Intraday | Multi-day |
High screen time | Lower screen time |
Please check our latest guide about Best Timeframe for Swing Trading
Final Verdict: What's the Best Time Frame for Day Trading?
The best time frame for day trading is the 15-minute chart for finding trade setups and the 5-minute chart for executing entries. For the best results, combine them with the 1-hour chart to confirm the trend and the daily chart to identify key support and resistance levels.
This multi-timeframe approach helps reduce market noise, improve entry accuracy, and strengthen risk management across forex, stocks, futures, and crypto markets.
If you're new to day trading, start with the 15-minute chart. As you gain experience, add the 5-minute chart for more precise entries while continuing to use higher time frames for market context.
FAQ
The 5-minute and 15-minute charts are the most widely used among professional day traders. The 5-minute offers frequent setups with good precision; the 15-minute offers cleaner signals with less noise.
No. The 1-minute chart generates too much noise and demands split-second decisions that new traders aren't equipped to handle. Beginners should start with the 15-minute chart and progress shorter only after building a profitable track record.
Yes — and you should. Multi-Timeframe Analysis (MTFA) is standard practice among professional traders. A common workflow: Daily (context) → 1-Hour (structure) → 15-Minute or 5-Minute (entry).
Most professional day traders use the 5-minute chart for execution and the 15-minute or 1-hour chart for structure. They almost always reference a higher time frame (4-hour or daily) for overall market context.
The 15-minute chart during the London/New York overlap (1 PM – 5 PM IST / 8 AM – 12 PM EST) is widely considered the most effective Forex day trading time frame. The 5-minute chart also works well for active scalping during high-volume sessions.
The 15-minute chart is the most reliable for crypto day trading. Crypto is highly volatile, so shorter time frames generate more false breakouts. The 1-hour chart is useful for bias, and the 15-minute for entries.
Yes. In highly volatile conditions (e.g., during major news events), shifting to slightly higher time frames reduces the impact of erratic price spikes. In low-volatility, ranging markets, shorter time frames can reveal more usable setups.
For most traders, the best time frame is the 15-minute chart for analysis and the 5-minute chart for entries.
The 15-minute chart is better for analysis, while the 5-minute chart is better for timing entries.
Some scalpers do, but most professional traders rely on higher time frames and use lower time frames for execution.
Most forex day traders use the 15-minute chart for setups and the 5-minute chart for entries.

Kriptoya disiplinli risk uygulamaya hazır mısınız? Audacity Capital'in yeni kripto enstrümanlarını keşfedin ve ticaret stratejinizi getirin.
Daha Fazla BilgiBülten
Yeniliklerden haberdar olmak için bültenimize katılın.
Sosyal Topluluğumuza Katılın

Bugün Yolculuğunuza Başlayın Ücretsiz Denememizle
Becerilerinizi ve başarılarınızı sertifikalar aracılığıyla gururla sergileyin ve potansiyel yatırımcılardan ve akranlarınızdan sıkı çalışmanız ve özveriniz için takdir alın.
Ücretsiz Denemeİlgili Makaleler

Is Day Trading Gambling? Understanding the Difference Between Trading and Gambling
Is day trading gambling? Learn how trading differs from gambling, when trading can become gambling-like, and why risk management matters.

Day Trading Tips: The Rules That Actually Decide Whether You Survive
Practical day trading tips ordered by what actually matters. Risk rules, discipline, execution, and the 2026 pattern day trader change explained honestly.

How to Create a Day Trading Risk Management Plan?
Build day trading risk management strategies with daily loss limits, position sizing rules, drawdown controls, and a practical trading checklist.
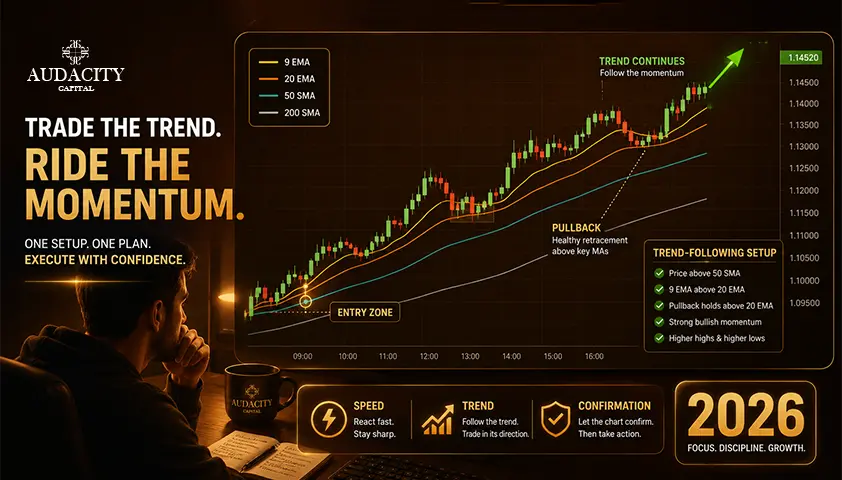
Best Moving Average for Day Trading in 2026
Compare the 9, 20, 50 and 200 moving averages for day trading, when each works best, and how to avoid lag, noise and false signals.