


How Much Should You Risk Per Trade?



Risk per trade is as important a lesson (if not more) than anything and everything you learn about trading. For a large section of people, trading is adrenaline, but that's where they make a mistake of taking too much risk and then find it difficult to recover from one loss, and then another.
So, how much to risk per trade? Well, this doesn't have a universal number, despite the 1% traditional recommendation you may have heard or read elsewhere.
Apart from picking one number, decide the amount based on your account size, stop-loss distance, and the number of open positions. To understand it in depth, this guide looks at how risk per trade works, how to calculate it, and what happens when losses start adding up.
What Does Risk per Trade Mean?
When traders talk about risk per trade, they are referring to the money they are prepared to lose if their trade idea does not work out. The stop-loss level helps estimate that amount. It is not the same as the total money committed to a trade, which is where the difference between risk and position value becomes important.
Consider a trader who has ₹2,40,000 set aside for trading and plans to risk ₹1,200 on a particular position. The shares bought may have a total value of ₹24,000, ₹40,000, or another amount, depending on the entry price and quantity. The ₹1,200 is the intended loss if the stop is reached and executes as expected.
It helps to separate three things before placing an order:
- Risk per trade is the planned amount at risk.
- Position size tells the trader how many shares or contracts are being traded.
- Position value tells the worth of the entire position at the chosen time.
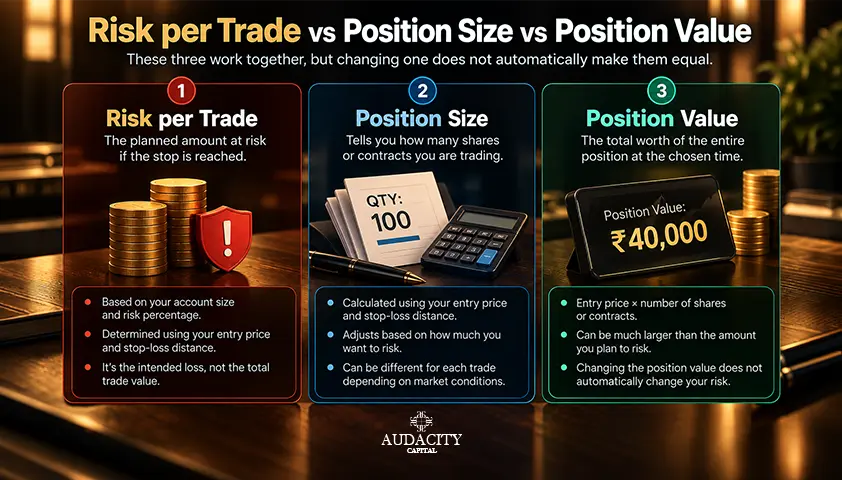
All three work together, but changing one does not automatically make them equal. You can hold a position of ₹40,000 and still plan to risk only ₹1,200 on it.
The calculation is still an estimate. If the price moves sharply or the order is filled beyond the stop level, the realised loss may be higher. Brokerage and other trading charges can also affect the final result.
How Much Should You Risk per trade?
The answer to how much should I risk per trade depends on more than the size of the account. A trader who takes several positions each day may need a different limit from someone who trades less frequently. The stop-loss distance, the behaviour of the strategy, and the possibility of several losses occurring together also need attention.
Take an example where ₹1,60,000 is kept aside for trading and observe the table below to know how different risk percentages result in a planned loss amount.
Risk percentage | Planned loss amount |
0.5% | ₹800 |
1% | ₹1,600 |
1.5% | ₹2,400 |
2% | ₹3,200 |
The figures show what each percentage means in rupees. They do not mean that the trade will necessarily lose that amount, nor do they guarantee that the loss will stop at that figure.
A sensible risk limit should take into account the following:
- The way a strategy has performed over the last few trades.
- If the account can handle a few losses without the financial commitments being affected.
- The amount of risk that is already tied up in other open positions.
- Whether the chosen amount can be followed consistently during difficult trading periods.
There is no benefit in choosing a percentage simply because it is commonly mentioned in trading guides. A figure that looks small on paper may still be too large for a particular account or strategy. That’s because we expect small risk to work for everyone, which would prevent us from understanding the actual risk for that account. When we look at risk per trade, we are looking at converting it into a suitable quantity through entry and stop-loss prices.
Understanding the 1% Risk per Trade Rule
1 risk per trade, or the 1% rule, is almost everywhere like it is a universal value. However, it is not a universal value, but many traders find it a small and simple way to set a limit before entering a position. The calculation is straightforward: take 1% of the current trading account equity and use that amount as the planned risk for the trade. The quantity must then be adjusted to fit the distance between the entry price and the stop-loss.
For example, a trader has ₹1,75,000 in the account and follows an illustrative 1% limit. This gives a planned risk of ₹1,750. After a difficult period, the account balance falls to ₹1,55,000. The same percentage now gives a risk budget of ₹1,550.
The benefit is that the planned amount adjusts as the account changes, rather than staying fixed while the available capital becomes smaller. However, the rule is not a promise that every loss will remain within 1%.
There are a few points to remember:
- The percentage applies to the planned loss, not the full value of the trade.
- The risk amount should be recalculated when the account balance changes, if using a current-equity approach.
- A stop-loss may not execute at the selected price during a gap or a fast market.
- A 1% limit does not mean the risk of losing several open positions simultaneously is removed.
1% is not a suitable rule for all traders, but it is just a way of organising risk. Some traders even choose a lower or different limit based on their circumstances. Understanding the calculation and following the chosen limit matter more than increasing it whenever a trade looks especially promising.
How to Calculate Risk per Trade?
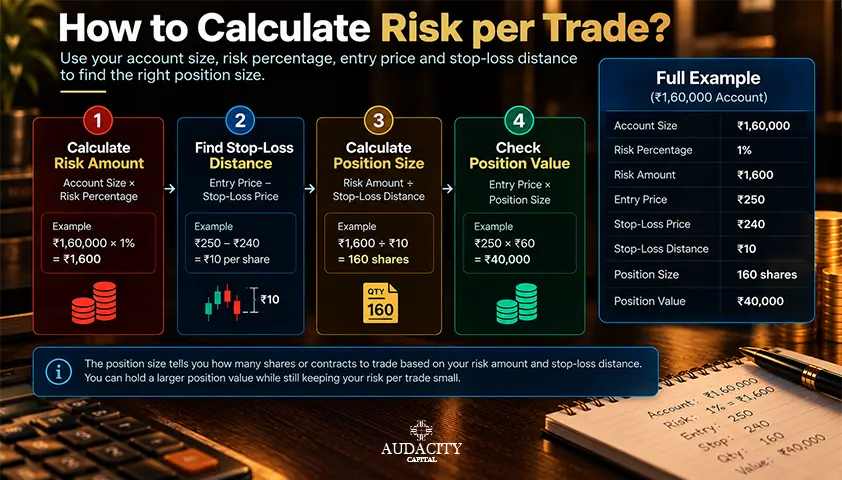
Calculating risk per trade starts with one question:
How much money would be lost if the trade reached its planned exit level?
This amount should be considered before entering the market, because the number of shares alone does not show how much to risk per trade.
Calculate the risk budget with the following formula:
Trading Capital x Risk Percentage = Risk Amount
For Example: XYZ trader has set aside ₹1,25,000 for trading within an illustrative risk limit of 0.8%. This gives a planned risk amount of ₹1,000.
Now consider a stock bought at ₹860, with a stop-loss at ₹835. The price difference is ₹25 per share. If the trader buys 40 shares, the planned loss at that stop price would be:
(Entry Price − Stop-Loss Price) × Quantity = Planned Risk
(₹860 − ₹835) × 40 = ₹1,000
Here, market value is ₹34,400 and planned risk is ₹1,000 (keep both amounts separate).
Now check if the calculation is leaving room for brokerage, possible slippage, and taxes before entering. Also, treat stop-loss as an exit instruction because it doesn’t give surety that an order will execute at the exact price. If the market opens well below the stop or moves sharply, the realised loss may be higher.
For readers who want to take the next step, Audacity Capital's position sizing guide explains how the risk amount relates to trade quantity.
How Losing Streaks Affect Your Trading Capital?
The difficulty with a losing streak is not limited to the money lost on each trade. It also changes how much capital remains and how much return is needed to recover. The larger the fall, the harder it becomes to return to the starting balance.
Consider a ₹1,00,000 account. If the trader risks a fixed percentage of the latest balance, ten consecutive losses would leave the following amounts:
Risk per trade | Account balance after 10 losses | Amount lost |
1% | ₹90,438 | ₹9,562 |
2% | ₹81,707 | ₹18,293 |
3% | ₹73,742 | ₹26,258 |
5% | ₹59,874 | ₹40,126 |
The calculation assumes that each loss is limited to the chosen percentage of the remaining balance. Actual trading results can differ because of charges and execution conditions.
The figures show why a small change in risk percentage can make a noticeable difference over a series of trades. They do not predict how many losses a trader will experience, nor do they establish a suitable percentage for every strategy.
NOTE: Don’t treat old losses as your reason to expect a successful new trade. The market doesn’t owe anyone a winning result, and increasing the quantity of trades just to recover in a go will put your remaining finances under extra pressure.
If your losses are building up, re-check your trading plan, your recent moves, and overall exposure instead of putting money in without any re-evaluation.
Explaining Maximum Risk per trade
Asking for the maximum risk per trade sounds straightforward, but the answer is not a number/ figure. Its answer depends on what the limit is meant to control:
- A trader's own risk budget.
- A broker's margin requirement.
- Or, a funded account's drawdown boundary.
Because these three are very different.
A trader’s budget is a personal limit that controls the amount estimated to be lost on an individual trade. A daily limit is a trading session’s boundary, whereas a total open risk looks at all positions that are exposed to the market.
The difference is more important when many trades open together.
Let’s understand it like this: Trader A has positions in three banking stocks, and Trader B has positions in a banking index. Each trade may look acceptable on its own, but a sharp move across the banking sector could affect them all. The combined risk may be much larger than the trader first expected.
A simple review before entering another position can help:
- How much planned risk is already open?
- Are the positions exposed to the same sector, index or economic announcement?
- Would another losing trade take the account close to its daily limit?
- Does the trade comply with any broker or programme restrictions?
Again, no definite percentage answers all these questions because a personal limit should fit the account and strategy, while external rules must be followed separately. Audacity Capital's official trading guidelines provide the relevant programme information for traders using its funded accounts.
What Changes When Trading Intraday or Futures and Options in India?
Risk attached to a trade partly depends on the market in which it is placed. Stop loss may be planned in the same way across different instruments, but the costs, contract rules, and price movements are not always the same.
For Indian traders, the main differences are worth keeping in mind:
- Intraday positions: Repeated trades can increase transaction costs, even when each individual trade has a small planned risk. Several positions can also lose during the same market move.
- Delivery and swing positions: Holding a stock beyond market hours exposes it to overnight news. If it opens below the stop-loss level, the exit may occur at a worse price.
- Futures contracts: The trader must account for the contract's lot size and how much the underlying price movement changes the contract's value. Leverage can increase the financial impact.
- Options contracts: The risk for an option buyer is different from that of an option seller. A buyer's direct loss is generally limited to the premium paid, while an unhedged seller can face substantially larger losses.
The amount deposited as margin should not be mistaken for the amount at risk. Margin is a requirement for holding the position, while the loss depends on what happens to the market and the structure of the trade.
To understand these instruments properly, SEBI has explained them very clearly, and it serves as a useful reference. The practical lesson is to look at the specific contract and its risks rather than applying the same assumptions to every trade.
Common Risk-Per-Trade Mistakes to Avoid
Having a risk limit is useful only when it is followed after the trade is open. Some decisions can increase exposure without the trader fully recognising the change.
- Never increase risk or take a bigger position after one or consecutive losses. What may look like a step of recovery can add another and may be more significant damage.
- Do not treat 1% as a guarantee because a planned limit won’t prevent slippage, nor can it protect your trade from every market gap.
- Never move stop-loss further away without reducing quantity, or it will increase planned risk.
- Do not ignore brokerage, taxes, and other trading costs, or it can make the final result worse than the calculation suggests.
- Do not overlook the related positions.
- Do not take another risk after winning because a good win or even a proven strategy does not mean the next trade is less likely to lose.
Conclusion
Overall, there’s no definite number for risk per trade that can suit every trader and trading account. Rather than looking for a percentage, start small, know how much you can lose, and learn about the already open risks. Decisions you make to recover earlier losses or after a huge win are emotional and not practical; thus, avoid them.
At the end, have a risk plan ready. It may not remove uncertainty, but it can give you a clearer basis for each decision.
FAQs
If you are a beginner, start with the lowest risk, for example 0.5% to 1%. Starting small helps in understanding how losses affect the account.
No, the 1% risk per trade is not compulsory. It is, though, a commonly discussed risk-management approach, but not a verified rule under SEBI regulations or any equivalent authority.
Calculating risk per trade is simple: decide how much money you can use for trading and what percentage of that you can leave at risk. Once you have both numbers, use the formula "Risk Amount = Trading Capital x Risk %".
Like there’s no minimum risk per trade, there’s no maximum risk per trade as well. What limit you use depends on your trading plan, the exposure across open positions, as well as any applicable broker/ funded-account rule.
You can do so, but if your losses are beyond your original plan, it is wise to take a break and review the trades. Instead of taking another risk immediately, you can journal your trades, check if losses are from the same mistake, and adjust your plan accordingly.

Kriptoya disiplinli risk uygulamaya hazır mısınız? Audacity Capital'in yeni kripto enstrümanlarını keşfedin ve ticaret stratejinizi getirin.
Daha Fazla BilgiBülten
Yeniliklerden haberdar olmak için bültenimize katılın.
Sosyal Topluluğumuza Katılın

Bugün Yolculuğunuza Başlayın Ücretsiz Denememizle
Becerilerinizi ve başarılarınızı sertifikalar aracılığıyla gururla sergileyin ve potansiyel yatırımcılardan ve akranlarınızdan sıkı çalışmanız ve özveriniz için takdir alın.
Ücretsiz Denemeİlgili Makaleler

Break and Retest Trading Strategy for Beginners
Learn the break and retest trading strategy, how to identify valid breakouts, confirm retests, set stop-losses and manage trading risk.

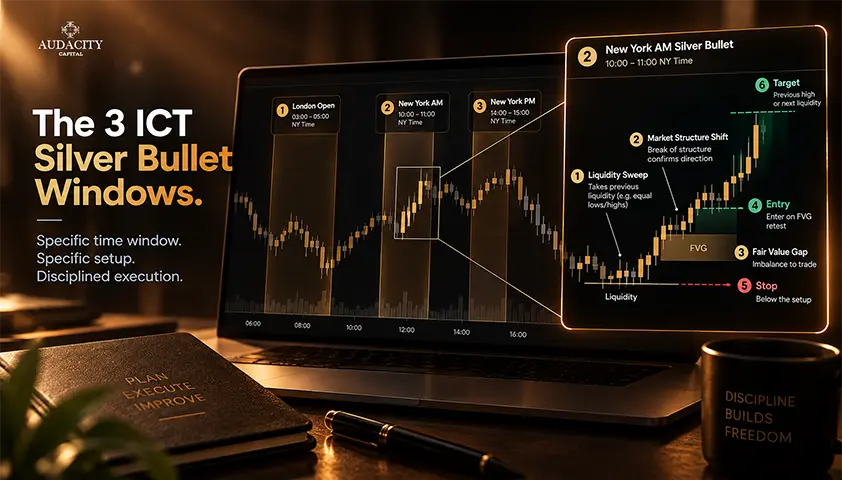
ICT Silver Bullet Strategy: Windows, Setup and Execution Rules
The ICT Silver Bullet windows, the setup step most guides skip, entry and stop rules, and what the published win rates rest on.
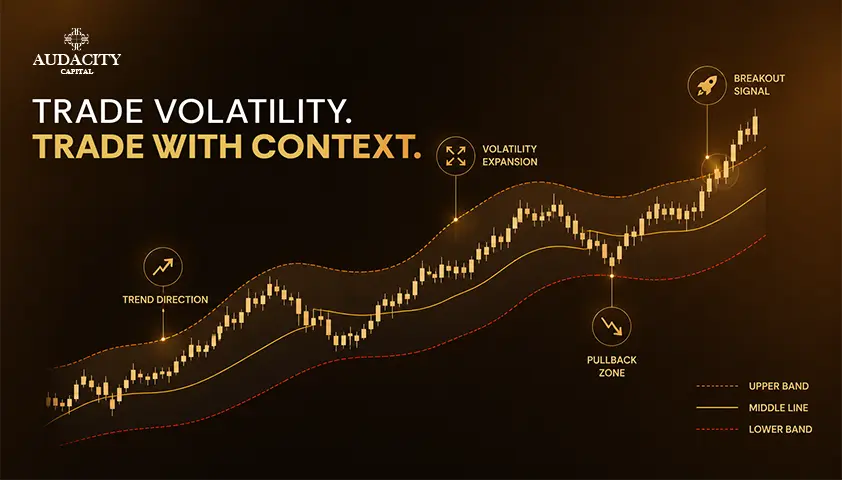
Keltner Channel Trading Strategy: How to Read Volatility With Context
Discover how Keltner Channels measure market volatility, spot trend pullbacks, and confirm breakouts. Includes setup rules, settings, and testing methods.
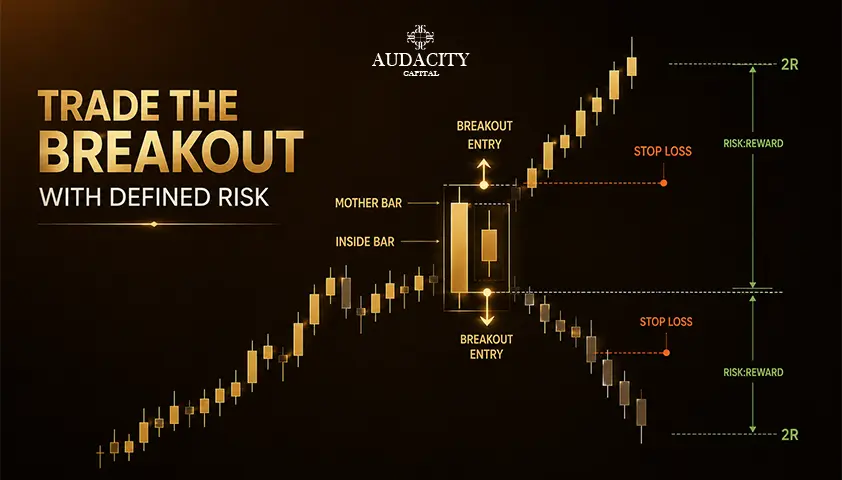
Inside Bar Trading Strategy: Rules, Entries and Risk Guide
Master the inside bar trading strategy with practical rules for pattern identification, entry triggers, stop placement, risk management, and testing.