How ICT Power of Three Works: Accumulation to Distribution


After a daily candle closes, its wick, body, and direction look obvious. None of that was known at the open.
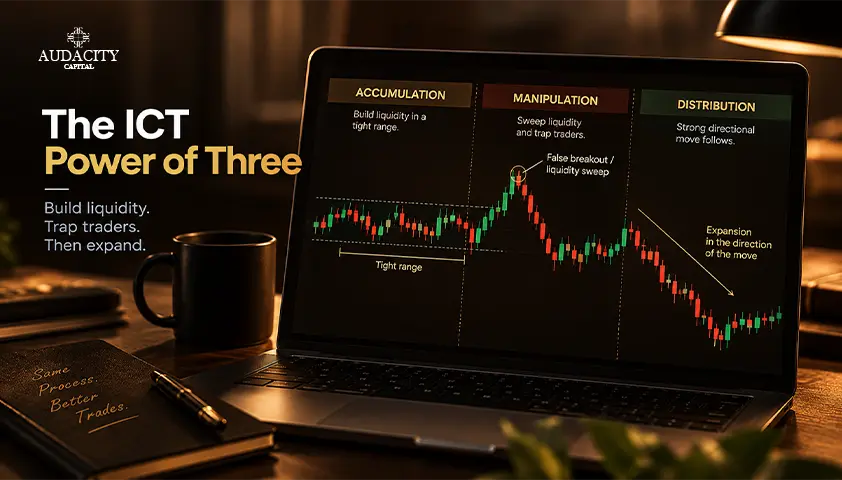
ICT Power of Three, usually shortened to PO3, is a framework from the Inner Circle Trader (ICT) methodology that organizes that unfolding sequence into three phases.
This guide shows how the phases are defined, how bullish and bearish versions differ, where session timing may fit, what confirms a setup, and how to avoid labeling every false break as manipulation.
What Is ICT Power of Three?
ICT Power of Three is a price-action framework that describes a chosen candle or trading period through accumulation, manipulation, and distribution. Traders abbreviate it as PO3 and call the three-stage sequence the AMD model, short for accumulation, manipulation, distribution.
You will also see it written as ICT Power of 3. The idea is the same.
The model expects a range near the opening price, a move beyond one side of that range, and a later expansion in the opposite direction.
PO3 is an interpretive model. It is not a verified record of institutional orders. A candle shows an open, high, low, and close. It does not show who accumulated a position, and it cannot prove that a move was deliberately engineered.
Terms like "institutional intent" and "algorithmic delivery" are part of the ICT vocabulary, so treat them as labels within that framework.
The framework is attributed to Michael J. Huddleston, known as the Inner Circle Trader. If you are new to the wider approach, start with the ICT methodology overview and return here for the PO3 detail.
Read more about What Is ICT in Trading
Start With the Candle and Its Opening Price
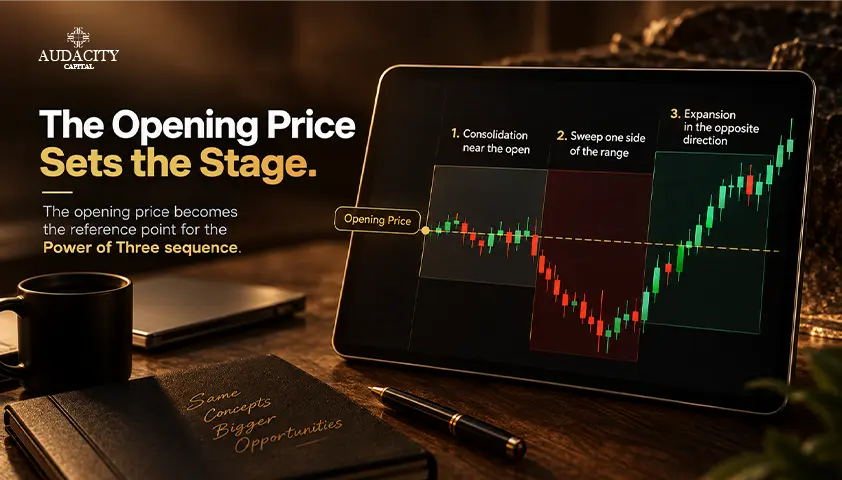
PO3 only makes sense when it is tied to one declared period. Before you label any phase, write down the instrument, candle length, session definition, timezone, opening price, and ending time.
The opening price causes more confusion than any other input.
A daily open can mean midnight New York time, a broker's day boundary, a futures session open, or a cash-market open. Each can produce a different PO3 shape on the same date.
Pick one convention and do not mix them.
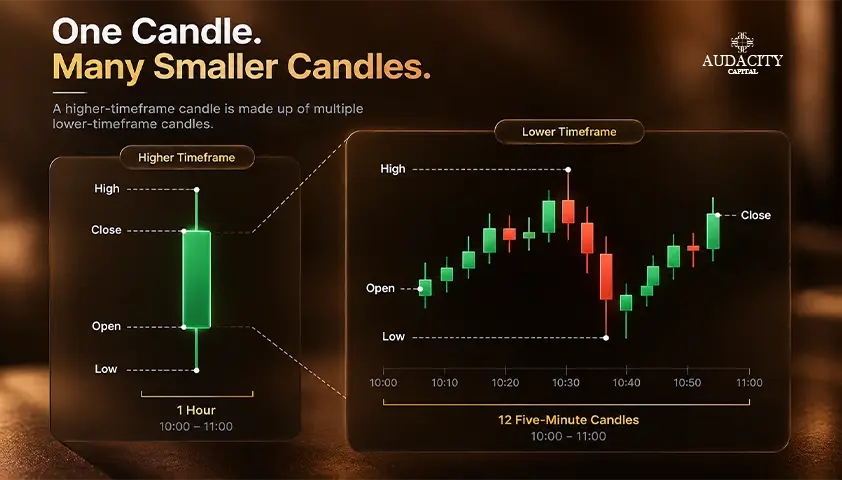
A bullish period is often drawn as Open-Low-High-Close (OLHC). A bearish period is often drawn as Open-High-Low-Close (OHLC). These are simplified paths, not guaranteed sequences.
The low or high that forms first only becomes obvious after the candle has developed, so the live trader never knows at the candle open which path is coming.
Before you study any chart example, label these six items:
- The chosen candle
- The opening price
- The accumulation window
- The levels available before the sweep
- The decision time
- The time the setup expires
If you cannot fill in all six, the chart is not ready to be labeled.
Accumulation, Manipulation and Distribution: The Three Phases
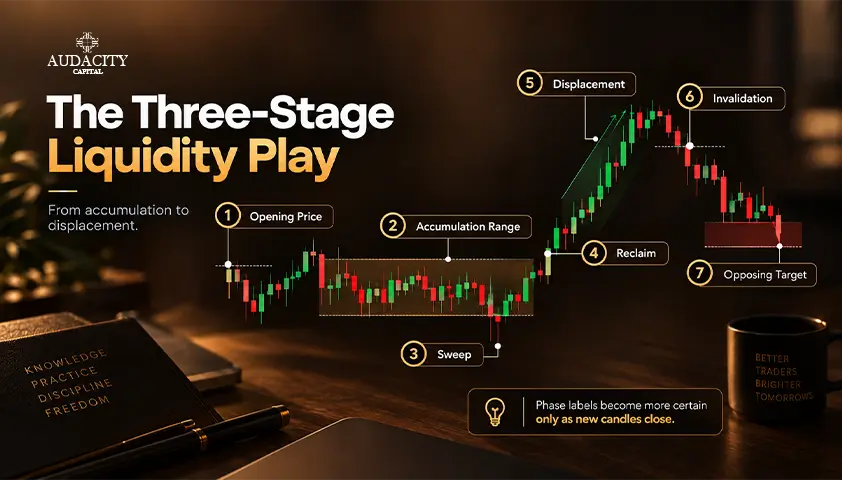
These three phases belong together. They describe one connected sequence, not three separate strategies.
Phase 1: Accumulation: the reference range
Accumulation is a period of relatively contained price movement near the declared open. This is your accumulation range. Mark its high and low using rules you chose before any breakout, such as a fixed time window.
The chart cannot prove that institutions are quietly building positions here. It only shows that the price was contained.
Phase 2: Manipulation: the break that may fail
The manipulation phase is price moving beyond one side of the range, or beyond a prior liquidity level, against the direction of the anticipated expansion.
A wick alone is not enough. The move stays a possible breakout until price rejects the level or fails to hold beyond it.
Phase 3: Distribution: the directional expansion
The distribution phase is a sustained move away from the manipulation extreme, usually back through the range and toward an opposing target.
In PO3, distribution means this expansion leg. It does not mean the same thing as a Wyckoff distribution range.
What is known at each stage?
This table separates what you can observe live from what you cannot. It keeps hindsight labels from posing as signals.
Phase | What can be observed | What remains uncertain |
Accumulation | A declared range near the chosen open | Which side will break and whether the range matters |
Possible manipulation | Price trades beyond one range boundary | Whether the break will fail or continue |
Confirmed failure of the break | Price reclaims the boundary and shifts structure | Whether follow-through will become distribution |
Distribution | Sustained expansion toward a predeclared target | How far it will travel and whether it will reverse early |
Bullish vs Bearish PO3: How the Candle Forms
The Bullish Model
In a bullish Power of Three, price opens near the reference range and trades lower to create the manipulation low. It then reclaims the range or the open and expands higher.
The finished candle may resemble OLHC. During the session, though, the trader needs confirmation before knowing the low is complete.
The Bearish Model
A bearish Power of Three runs in reverse. Price opens near the range and trades higher to create the manipulation high. It then reclaims downward and expands lower. The finished candle may resemble OHLC, with the same live uncertainty.
Feature | Bullish PO3 | Bearish PO3 |
Move against the expected close | Below the open or accumulation low | Above the open or accumulation high |
Liquidity reference | Prior low or sell-side liquidity (resting stops and orders below a low) | Prior high or buy-side liquidity (resting stops and orders above a high) |
Confirmation sought | Reclaim plus bullish structure shift or displacement | Reclaim plus bearish structure shift or displacement |
Invalidation reference | Beyond the manipulation low under the chosen rules | Beyond the manipulation high under the chosen rules |
Distribution direction | Toward an opposing high or target above | Toward an opposing low or target below |
A Hypothetical bearish example:
The daily open is 250.00. The accumulation range runs from 249.80 to 250.20. Price trades up to 250.60, closes back below 250.20, and then breaks structure to the downside.
A trader following a stated rule might look for a pullback entry and aim at a premarked low. All figures are illustrative.
How a Daily PO3 Can Map Across Trading Sessions
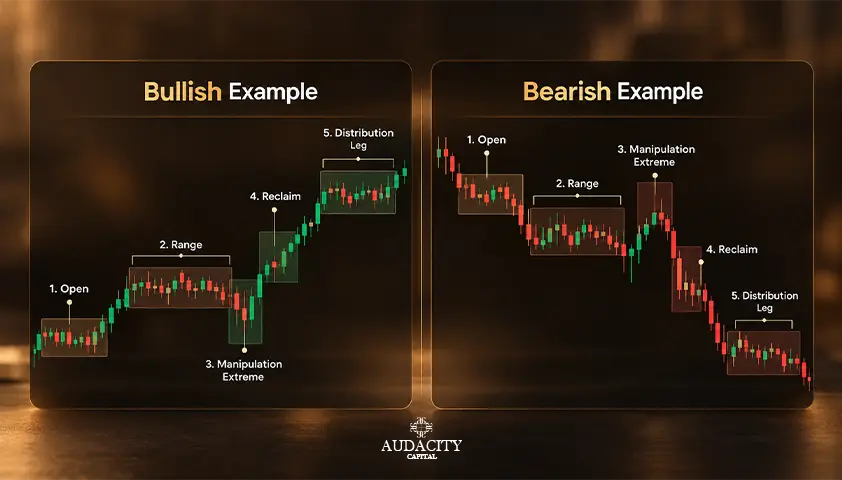
A common forex version of PO3 trading maps the phases onto sessions. The Asian range may provide accumulation. The London session may trade beyond one side of that range. The New York session may then continue the opposite expansion. Each "may" matters.
This is a teaching model, not a daily timetable. Any time you mark on a chart should be in New York time.
Note whether it is Eastern Standard Time (UTC-5, in winter) or Eastern Daylight Time (UTC-4, in summer). Clock changes in the US, UK, and Europe happen on different dates, and India does not observe daylight saving.
For a few weeks each year, the gap between your local time and New York time shifts. Rechecking your session windows is part of the process.
Markets also differ. Forex trades around the clock. Futures have exchange sessions. Stocks have cash hours and extended hours. Crypto trades continuously.
Choose the day and open that match your instrument, and do not apply an Asia, London, New York map mechanically to every market.
Sometimes the day does not fit. Both sides of the overnight range may be swept. Price may never reclaim the open. Expansion may begin before the expected window. In those cases, leave the day unresolved or classify it under a different predeclared rule.
Forcing the textbook order after the close is how false confidence is built.
How to Build a Confirmation-Based PO3 Setup
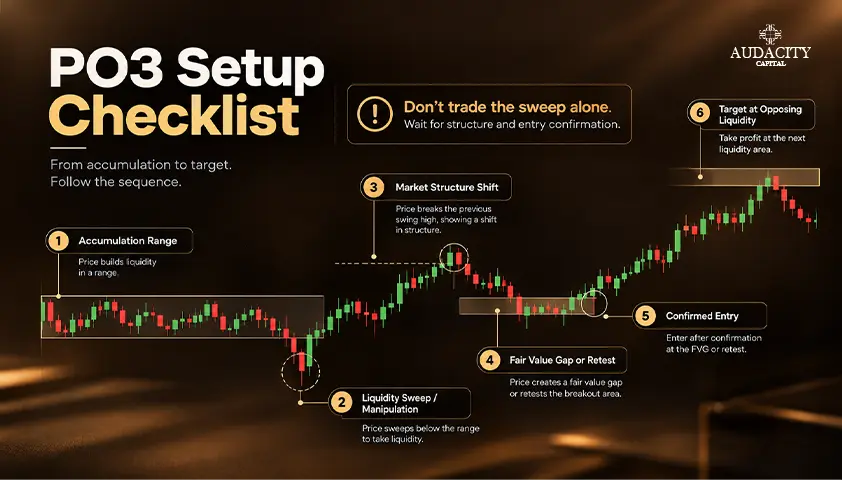
This is the practical core of how to trade ICT Power of Three. Each step states what is known before you move to the next decision.
Step 1: Declare the period and open. Choose the market, candle, timezone, session definition, and opening price. Do this before you look at the later high and low.
Step 2: Form a directional hypothesis. Use higher-timeframe context to set a daily bias and name a specific draw on liquidity, meaning the level price may be attracted toward. Call it a hypothesis, not a certainty. If direction is unclear, prepare both scenarios or skip the trade.
Step 3: Mark the accumulation range. Define how the range high and low are set and when the range stops updating. Do not redraw it after a later reversal.
Step 4: Wait for a boundary to trade through. Record whether price wicks, closes, or accepts beyond the level. A break is only a possible manipulation until rejection or failed acceptance appears.
Step 5: Require confirmation. Choose one test in advance. Options include a close back inside the range, a market structure shift (MSS), or displacement, a strong impulsive move that often leaves a fair value gap (FVG).
A change of character (CHoCH) is one common way traders describe the first structure break against the prior move.
Step 6: Define entry and invalidation. A hypothetical entry might be a pullback after confirmation. Place the invalidation beyond the manipulation extreme only if that matches your tested rule. Calculate position size from the stop distance, not from a round number.
Step 7: Set a target and expiry. Use an opposing range boundary, a prior high or low, or your predeclared draw on liquidity. State when the idea is too late, when the target is too close to justify the risk, and when no trade is the right result.
Risk note: Do not copy a universal 1:2, 1:3, or 1:5 target from another source. Risk-to-reward has to be tested alongside win rate, costs, and the actual market.
Stops and targets should follow a stated invalidation and rules you have tested. Trading involves risk, and no setup guarantees an outcome.
Three Outcomes a PO3 Trader Must Separate
The three sequences below use the same declared open and range rules. The goal is classification under uncertainty, not a showcase of perfect winners. All prices and outcomes are hypothetical.
Outcome 1: Clean bullish sequence
Let’s say, the daily open is 100.00 and the accumulation range is 99.80 to 100.20. Price sweeps down to 99.50, then closes back above 99.80. A bullish structure shift follows.
Under the trader's rule, a pullback entry is taken at 99.95 with an invalidation at 99.45, just beyond the sweep low. The target is a premarked high at 101.20. Risk is 0.50 per unit and the distance to target is 1.25.
If the trader risks 100 in account currency, the position size is 200 units. The reward-to-risk of 2.5 is simply what these made-up levels produce, not a recommended target.
Outcome 2: Genuine breakout, not manipulation
Price closes below 99.80, retests the underside, and continues lower with no reclaim. The bullish hypothesis never confirms. A range break is not automatically a trap, and treating every break as one is a common error.
Outcome 3: Double sweep or unresolved day
Price trades above 100.20 and below 99.80, then rotates around the open without sustained displacement. Classify it as ambiguous or no trade under the selected rules.
Do not rename the final move as distribution just because the session later closes in one direction.
Example | Available evidence | Missing confirmation | Valid action | Invalidation | Journal label |
Clean bullish | Sweep to 99.50, close above 99.80, structure shift | None under the rule | Pullback entry at 99.95 | 99.45 | Confirmed bullish PO3 |
Genuine breakout | Close below 99.80, failed retest | No reclaim | No long | Hypothesis void on the close below range | Failed hypothesis, breakout |
Double sweep | Both range sides traded, price rotated around the open | Sustained displacement and a clean reclaim | Stand aside | No entry rule triggered, so no stop is set | Unresolved, no trade |
Traders often say PO3 is easy to see after the close and hard to identify live. That is the reason this article shows unresolved cases next to clean ones.
A model that only appears in winning screenshots has not been tested, and a few anecdotes about performance do not replace a written rule set.
PO3 vs Judas Swing, Turtle Soup and Wyckoff
These ideas get mixed up because each can involve a range and a failed break. They differ in scope, required sequence, and terminology.
Concept | What it describes | Relationship to PO3 |
PO3 or AMD | The full accumulation, manipulation, distribution sequence for a declared period | The complete framework |
Judas Swing | The deceptive move or sweep against the anticipated direction | Usually the manipulation component only |
A failed breakout and reclaim setup with separate historical and modern rule sets | Can resemble an entry event inside manipulation, but is not the whole cycle | |
A broader market-cycle method with accumulation and distribution ranges across many bars | Uses some shared words, but distribution does not mean the same thing |
Treat these as useful comparisons, not interchangeable definitions. PO3 is not identical to Wyckoff, and Turtle Soup is not always the manipulation phase.
How to Backtest PO3 Without Hindsight

After a candle closes, almost any wick and body can be described as manipulation and distribution. That is hindsight bias, and it makes a weak idea look strong.
A fair test commits to its definitions at a decision time, before the final close is known.
1. Write the rule sheet first.
Predefine the market, data source, candle and timezone, opening price, accumulation start and end, range width rule, qualifying sweep depth, reclaim or structure-shift test, entry timing, stop, target, expiry, costs, and maximum trades per period.
2. Log every outcome.
Record clean setups, failed sweeps, genuine breakouts, double sweeps, no-trade days, and missing data. When testing manually, capture a screenshot at entry time. Do not remove trades because the higher-timeframe story looks wrong after a loss.
3. Compare against a baseline.
Test the PO3 rule set against something simpler, such as the same directional bias without the manipulation filter. If the extra phase logic adds nothing, it may only be explaining the same candles after the fact.
4. Validate out of sample.
Separate the development period from an out-of-sample period. Break results down by instrument, session, volatility regime, and weekday only when those categories were planned in advance. Report trade count, win rate, expectancy, drawdown, and profit factor after realistic costs.
Use a journal template like this one. The sample entries are hypothetical.
Field | Example entry |
Date | Sample date |
Market | Sample index or currency pair |
Chosen open | Midnight New York time, stated as EST or EDT |
Bias recorded time | Time stamped before the sweep |
Range | 99.80 to 100.20 |
Sweep side | Below the range |
Confirmation time | Time of the reclaim and structure shift |
Entry | 99.95 |
Stop | 99.45 |
Target | 101.20 |
Outcome in R | Result in multiples of initial risk |
Regime | Low, normal, or high volatility |
Screenshot link | Image captured at entry time |
Conclusion
ICT Power of Three is a sequence tied to one declared candle and open: a reference range, a possible false break, and confirmed expansion.
The manipulation label is only useful when rejection and follow-through are defined in advance. Everything else is a description written after the fact.
Choose the open, write the rules, accept no-trade days, and judge the model through a complete journal rather than one clean chart.
Educational note: This article is for information only and is not investment, financial, legal, or tax advice. Trading involves risk, hypothetical examples do not guarantee actual results, and local-law restrictions may apply in your jurisdiction. If you want to put a tested rule set to work, explore Audacity Capital's evaluation paths, Ability Challenge and Ability One, or build your foundations first through Trader University.
Related Articles
ICT Kill Zones and Session Timing
Turtle Soup Trading: Rules, Examples and ICT Variations
Frequently Asked Questions
AMD stands for accumulation, manipulation, and distribution. These are phase labels inside the PO3 framework. They describe how a period of price action is organized, not proof of who was buying or selling.
It depends on the declared market and candle. Name the convention, timezone, and session before you start, such as midnight New York time for a forex day. Do not mix midnight, futures, cash, and broker opens in one study.
No. Some days trend from the open, sweep both sides, stay balanced, or never confirm distribution under your rules. Those days are valid data. Classify them honestly instead of forcing the pattern onto the chart.
No. A sweep can be one event inside the manipulation phase. PO3 also includes the range that came before it and the distribution leg that follows. A sweep with no range and no expansion is only a sweep.
No universal best timeframe is established. Define a higher-timeframe period for context and a lower timeframe for execution, then test that exact pairing. Changing timeframes after a loss makes your results impossible to evaluate.

Kriptoya disiplinli risk uygulamaya hazır mısınız? Audacity Capital'in yeni kripto enstrümanlarını keşfedin ve ticaret stratejinizi getirin.
Daha Fazla BilgiBülten
Yeniliklerden haberdar olmak için bültenimize katılın.
Sosyal Topluluğumuza Katılın

Bugün Yolculuğunuza Başlayın Ücretsiz Denememizle
Becerilerinizi ve başarılarınızı sertifikalar aracılığıyla gururla sergileyin ve potansiyel yatırımcılardan ve akranlarınızdan sıkı çalışmanız ve özveriniz için takdir alın.
Ücretsiz Deneme