


Wyckoff Method Explained: Phases, Rules and Examples


A trading range can appear as textbook accumulation for weeks. Then support fails and the chart you carefully labeled becomes a distribution pattern in retrospect.
The Wyckoff Method provides an organized approach to evaluate price, volume, and market structure while keeping multiple possible scenarios open.
This guide presents the fundamentals, a worked example that can lose and the limitations of the evidence. This is for education only and trading involves risk of loss.
What Is the Wyckoff Method?
The Wyckoff Method is Richard Wyckoff's approach to interpreting supply and demand through price, volume and market structure. It was created by Wyckoff based on his observations of the early 20th-century U.S. stock market.
It includes three related yet different skill sets: reading the broader market context, choosing instruments to trade, and timing trades.
What the Composite Man Represents
Wyckoff proposed thinking of the market as though one large operator, the Composite Man, were making large transactions.
It is just a mental pattern when viewing the actions of the market players as a whole. It's not necessarily evidence of a coordinated campaign.
The price and volume only reflect the transaction that has been done; they say nothing about who did it and why.
Never mix up observation ("price closed back inside the range on rising volume") and interpretation ("buyers may be absorbing supply").
A phase label also leaves your entry, stop, exit and position size unresolved. Before trading on the Wyckoff framework, it is necessary to have a trading plan.
The Three Laws of the Wyckoff Method
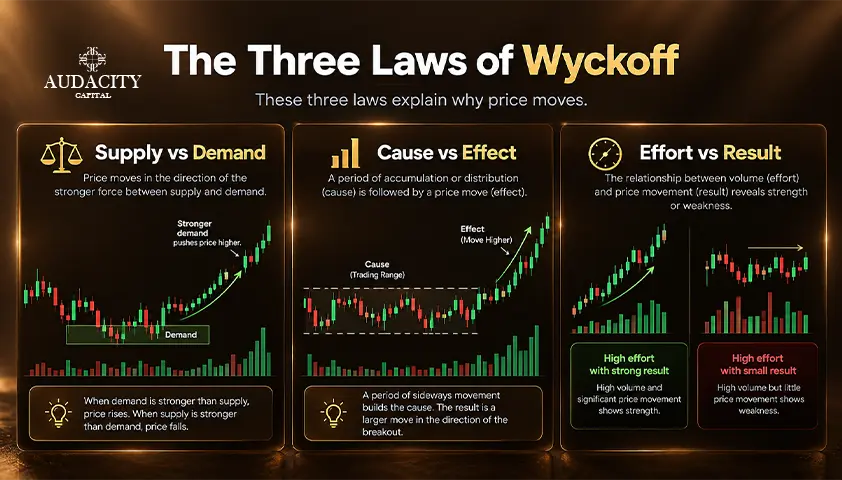
Think of them as guidelines for the method, rather than scientific laws that will predict price action.
1. Supply and Demand
Price rises when the buying forces are stronger than the selling forces. If selling pressure is greater, price will move down. Each transaction involves a buyer and a seller, so the pertinent question is who is in more need?
Make comparisons of rallies and pullbacks across multiple bars. The wide, fast rallies with shallow and quiet pullbacks indicate that demand is prevailing.
2. Cause and Effect
The method considers a trading range to be the cause and a subsequent trend to be a potential effect. Traditionally, analysts used horizontal Point and Figure calculations to estimate a move that might follow a range.
A long sideways range does not always mean that there will be a big movement, nor does it indicate the direction of the movement.
3. Effort Versus Result
Volume is activity or effort. Price progress is the result. When both coincide, the move has support. When heavy volume produces little price progress, something may be absorbing the move.
A narrow spread here means a bar's high-to-low range, not the bid-ask spread. That calls for more context. It's not a definite reversal indicator.
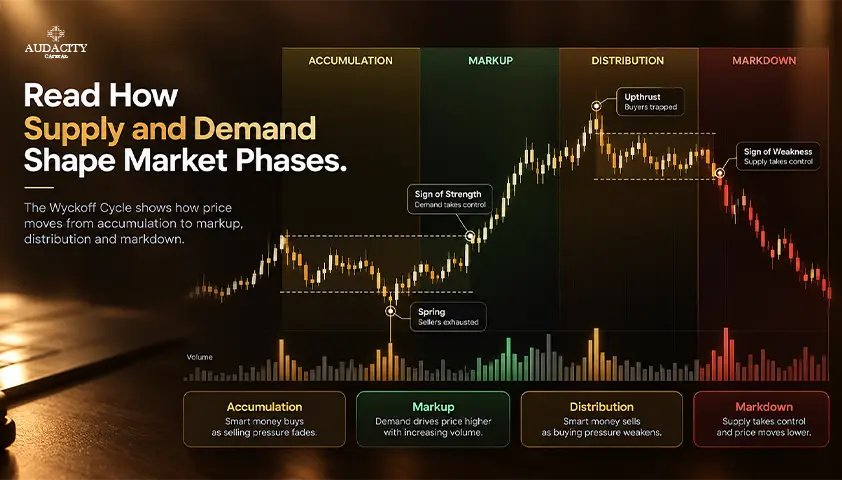
The Four Stages of the Wyckoff Market Cycle
According to Wyckoff, the market goes through four stages of a broad market cycle:
- Accumulation: The base potential after a downtrend when selling pressure gets absorbed before an uptrend.
- Markup: the advance, as price trends higher out of the base.
- Distribution: a potential topping range after an advance.
- Markdown: the fall that comes after.
Not all ranges make a reversal. Reaccumulation is a pause in an uptrend before further markup. Redistribution is a temporary ceiling in a downtrend, which is followed by more declines.
A range can add continuation to the previous trend or it can lead to a reversal, and the previous trend is not a determining factor. It just sets the context.
These four stages are different from the A-to-E Wyckoff phases used to analyze a single range. The cycle may not be rigidly structured and the markets may not go through a complete sequence.
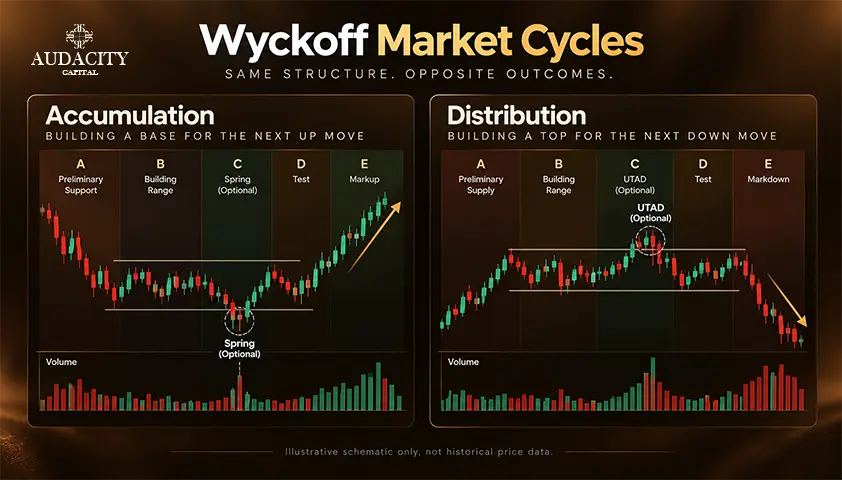
Wyckoff Accumulation and Distribution Phases
A Wyckoff schematic is a simplified version of a trading range and how it resolves. It's rare to find a real chart that's exactly the same. Read through the series of events visible and then reflect on what it might imply regarding supply and demand.
Wyckoff Accumulation
Wyckoff accumulation can begin at a preliminary support (PS) which is a situation where buying has started to slow down a decline.
A selling climax (SC) follows: A sharp decline, sometimes on heavy volume, which can run out sellers. The automatic rally (AR) that follows constitutes the upper limit of the range. A secondary test (ST) then returns to the SC area to determine if selling has faded.
Later, a Wyckoff spring may appear. A spring is defined as a move below the range of support and then back into the range. Not all lower wicks will be a spring; follow-through is important.
A sign of strength (SOS) is an advance on increasing activity toward or through resistance. A last point of support (LPS) is a pullback that is sustained, typically on reduced volume.
Wyckoff Distribution
The Wyckoff distribution is similar but often is not a true inversion.
Preliminary supply (PSY) is the first notable selling into an advance. A buying climax (BC) follows, then an automatic reaction (AR). In this case AR does not signify a rally, it is a reaction lower. A secondary test (ST) is a repeat of the BC area.
An upthrust (UT) is a push above resistance that fails back into the range. With distribution, an upthrust that follows is known as an upthrust after distribution (UTAD), not a label for every short break above the resistance.
A sign of weakness (SOW) is a decline on increasing activity, and a last point of supply (LPSY) is a weak rally that fails to regain much ground.
Phase | Accumulation reading | Distribution reading |
A | The previous downtrend slows down; early support and resistance are seen. | Previous advance slows down; first signs of resistance and support. |
B | Repeated range tests build the case for accumulation. | Repeated range tests establish the evidence of distribution. |
C | Supply is tested. A spring may occur, but is optional. | Demand is tested. A UTAD may occur, but is optional. |
D | Strength builds with rallies and pullbacks that serve as support. | Weakness builds on downswings and slow ups. |
E | Price trades beyond the range in a developing markup. | Price trades beyond the range in a developing markdown. |
The reason Phases D and E remain separate is that the strength or weakness can develop within the range before the price moves out of it. An LPS or LPSY may happen more than once and not all events need to be seen on a schematic.
How to Apply the Wyckoff Method in Five Steps
Wyckoff developed his system for selecting stocks. The steps are still valid in its principles and serve as a checklist; however, stock traders in other markets have to adapt them.
1. Assess the broader market.
Determine whether the market is ranging, marking up or down, and what further development it may take. Stock traders normally use an appropriate major index.
Futures, metals, or crypto traders might consider a structure on a higher-timeframe or a corresponding sector gauge.
2. Select candidates in harmony with that view.
Compare the candidates with a corresponding benchmark, namely relative strength for long positions, relative weakness for short positions. Relative strength in this case implies comparative performance, not RSI.
Forex pairs do not share one stock-market benchmark, so compare each currency's behavior across several pairs instead.
3. Check whether the range supports your objective.
Traditionally, Point and Figure analysis estimated whether the cause was large enough to justify the trade.
4. Judge readiness.
Look for supportive price-volume behavior and successful tests. Wyckoff published nine buying tests and nine selling tests as a checklist for this stage.
5. Align timing and define execution.
Enter only when the instrument and broader market point the same way, with a written plan.
Before testing a Wyckoff trading strategy, record the instrument and context timeframe. Also record the entry timeframe, trigger, invalidation level and exit rule.
Use the same choices when reviewing examples. A later entry can provide more evidence, but it leaves less distance to the target. No timeframe or confirmation removes failure risk.
A Wyckoff Method Trade Example
This Wyckoff Method example is hypothetical and uses a generic instrument on daily bars.
After a decline, price ranges between 100 and 110. A potential spring dips to 99, then returns inside the range. Later, a strength move closes at 111.4.
The next pullback holds at 110.4 on lower volume than the advance. It then closes at 111.2, above the previous bar's high of 111.0.
For this illustration, entry is the next bar's open at 111.3. The planned stop is 110.2, below the known pullback low. The target is previously visible resistance at 113.5. This is one example of a pullback entry after strength, not a universal Wyckoff rule or a Point and Figure projection.
Item | Target reached first | Stop reached first |
Entry | 111.3 | 111.3 |
Planned stop | 110.2 | 110.2 |
Planned target | 113.5 | 113.5 |
Illustrative exit | 113.5 | 110.2 |
Gross result | +2R | -1R |
R is the planned risk unit. Here, the planned price risk is 1.1 units and the possible gain is 2.2 units. Results exclude costs and assume fills at the stated prices.
A stop is not a guaranteed fill price, and gaps can produce worse exits. Do not use this example to infer a win rate, a prescribed reward target or any profit expectation.
Using Wyckoff in Forex and Other Markets
Volume data differs by market. Exchange-traded stocks and futures report traded volume. Spot forex is decentralized, so most platforms show tick volume.
It counts price updates on a feed rather than units traded. That matters when you apply the Wyckoff Method to forex. For crypto, name the exchange and market you are using.
On index and CFD charts, check what the volume field actually represents. It may be missing or provider-specific, and it should not be described as all traded contracts in the underlying market. A related futures feed is a separate instrument, not an identical substitute.
Compare volume only within the same data source, session and timeframe. You can still study price structure when volume is incomplete, but the volume-based reading rests on a narrower evidence base.
Wyckoff Method Risks and Common Mistakes
The most common error is forcing a chart into a schematic. Other mistakes include calling a falling range accumulation too soon. Traders may also treat every sweep of a high or low as a reversal or use vague entry rules.
False breaks happen, and a well-labeled setup can still fail after entry.
Review Without Hindsight
Use bar-by-bar replay with the future hidden. Before revealing each new bar, record your provisional label, the evidence, your trigger and your invalidation level. Keep failed candidates and skipped trades in the log. Never redraw an earlier decision to make it look correct.
Test Before You Trust
Define subjective terms such as "stronger volume" or "confirmed breakout" before testing. Use a consistent data feed and include spreads, fees and slippage. Then test the unchanged rules on a separate period. Judge results by net average outcome and drawdown alongside win rate.
For position sizing, start from your planned loss and stop distance. Do not tighten a stop to fit an oversized position.
If the evidence conflicts or you cannot define invalidation, wait. A setup that looks orderly in hindsight is no substitute for recorded decisions.
Conclusion
Pick one instrument and one entry variation. Record the provisional label, trigger and invalidation before you advance the chart, then review the result honestly against your written rules. Consistent interpretation and a defined point of failure matter more than a perfect label.
For structured further study, the free AudaCity Trader University curriculum includes lessons on Wyckoff accumulation and distribution.
Frequently Asked Questions
No. Both pay attention to market structure and the behavior of large participants, but they are not interchangeable rulebooks. Wyckoff centers on price-volume analysis within ranges and trend cycles.
Many Smart Money Concepts (SMC) approaches emphasize liquidity pools and order blocks instead. Rules vary widely between SMC educators, so compare specific definitions rather than labels.
Wyckoff is the broader framework, covering the market cycle, range phases and instrument selection. Volume Spread Analysis (VSA) focuses more narrowly on volume, a bar's range and where it closes, read in context.
Both draw on effort versus result and supply and demand. Wyckoff still examines individual bars, but within a larger structural view.
No. The Accumulation Distribution Line is a calculated indicator associated with Marc Chaikin. It uses price and volume in a formula to produce a running line.
Despite the shared words, it does not automatically identify Wyckoff phases. A rising line does not confirm that institutions are buying.
Scripts can label events, but only by applying their own chosen definitions. Before relying on one, check when each label became available. See whether the label changes after later bars print and whether it was drawn retrospectively.
A neat label on a completed chart can differ from what was visible live. Some recalculation is simply how certain tools work, so test the timing rather than assuming bad intent.

Ready to apply disciplined risk to crypto? Explore Audacity Capital's new crypto instruments and bring your trading strategy.
Learn MoreNewsletter
Join our newsletter to stay up to date on features and releases.
Join Our Social & Community

Start Your Journey Today With Our Free Trial
Proudly showcase your skills and accomplishments through certificates and get recognition for your hard work and dedication from potential investors and peers.
Free TrialRelated Articles
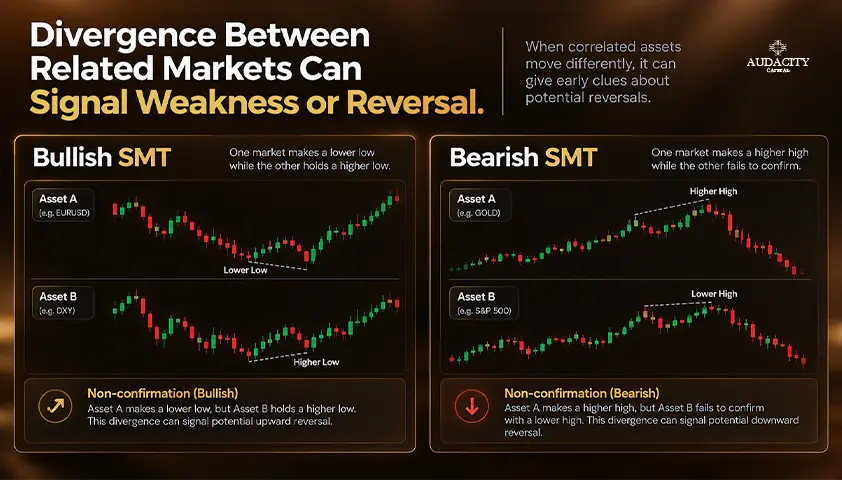
SMT Divergence in Trading: Bullish and Bearish Examples
Learn what SMT divergence means, how bullish and bearish setups form, which markets traders compare, and how to confirm signals and manage risk.


Market Profile Trading: How to Read TPO Charts
Learn Market Profile Trading with TPO charts, value area, POC, initial balance, day types, practical examples, and risk controls.
Cup and Handle Pattern: Criteria, Entry and Real Data
The cup and handle pattern explained: the criteria sources disagree on, how to trade it, and what the performance data actually says.
Turtle Soup Trading: Rules, Examples and ICT Variations
Learn turtle soup trading with original rules, ICT variations, bullish and bearish examples, risk controls, and a practical backtesting checklist.