


Overfitting in Trading: Signs, Causes & How to Avoid It


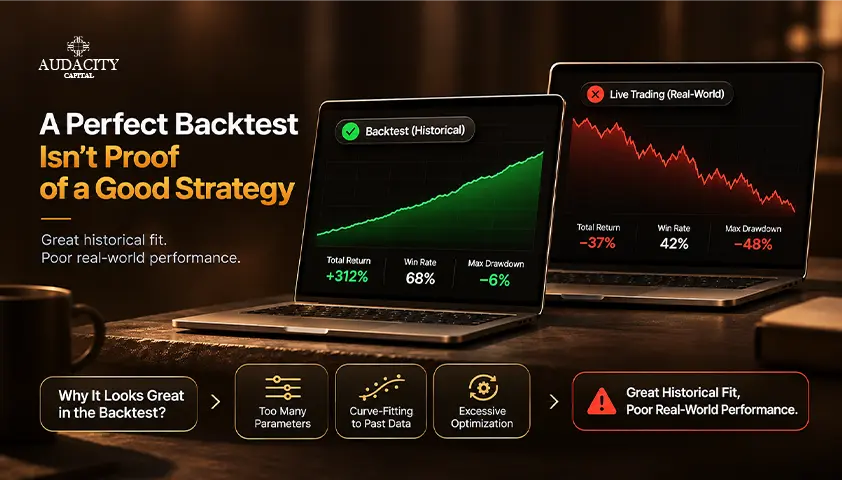
A trader continually improves the strategy. The period of moving-average varies slightly, stop losses are moved by a few pips, the filter appears and all this leads to a better equity curve and smaller drawdowns.
However, these rules don't perform well when they come across a type of market activity they've never seen before.
This can happen as a result of overfitting in trading. The strategy has been adjusted to a previous noise and not the repeatable market relationship. However, this isn't the only reason.
The poor performance on a forward or live test may be caused by execution gap, changing conditions or simply the statistical variance.
In this guide we will discuss what overfitting is, how it arises, signs to look for and ways to mitigate the risk of it.
What Is Overfitting in Trading?
In trading, overfitting occurs when the trading strategy is too closely correlated with the specific characteristics or noise within the historical data it has been trained on.
The rules essentially describe events which happen in that particular sample and not the events which will continue to happen in the future.
It's simply a matter of signal and noise. A signal is a certain pattern of market behaviour or relation that exists beyond the development sample.
Noise is any movement that at first looks like it follows a pattern but in reality does not represent a reliable relationship. The overfitted strategy does not differentiate between the two.
In theory, the tactic can be a very attractive one:
- Outstanding historical returns
- An eye-catching equity curve
- Low historical drawdowns
- Excellent risk-adjusted performance
However, the very same system might fail to replicate these attributes in out-of-sample testing.
There are several terms for this type of problem. In curve fitting, rules are created to follow past prices. Over-optimization is the setting of parameters that exceed what the evidence warrants.
Data snooping refers to searching for the same data over and over until patterns are suspected as being discoveries.
Overfitting trading strategies doesn't only happen in complex systems or machine learning. It can affect algorithmic trading methods, indicator systems as well as manually optimized trading strategies. It can also influence discretionary trading, where the trader is continually tweaking the rules based on past trades.
A trading system does not require many indicators to become "overfitted." Even two perfectly fit indicators can be exposed to overfitting.
How Does Overfitting Happen in Trading?
Overfitting does not occur due to a single major mistake. Instead, it is a result of the trader's routine work that makes it unnoticed.
Excessive Parameter Optimization
The trader keeps changing the values of moving-average periods, indicators' thresholds, distances to the stop-loss and take-profit levels, the lookback period and entry filters.
Trying out various parameter values is quite normal. The issue begins when the parameters are always selected because of their high profitability in the past.
Rules Created According to Historical Drawdowns
This process could be very familiar. A losing period appears on the backtesting, the trader realizes how he could avoid it, adds some filter and improves historical results.
This is repeated many times and gradually evolves into a narration of events instead of a broad trading scheme.
Testing Too Many Strategy Variations
One of the most overlooked is multiple testing. If a trader tries 20 different indicator combinations, 10 different stop-loss settings and 5 market filters, they will get 1,000 combinations.
After trying so many combinations, one will certainly look impressive just because there are so many choices to attempt. Even the simplest looking strategy can be very overfit, because of the apparent simplicity while the search process is really complicated.
Selecting Certain Markets or Time Frames
Results will vary according to the product used. Choosing the best performing currency pairs, market hours, time frames or volatility conditions based on the numbers alone is the first step in bias.
Repeatedly Using the Same Validation Data
Once the trader sees out-of-sample performance and modifies the strategy, this set of data is used in the development process and should no longer be considered an independent validation set.
Example of an Overfit Trading Strategy
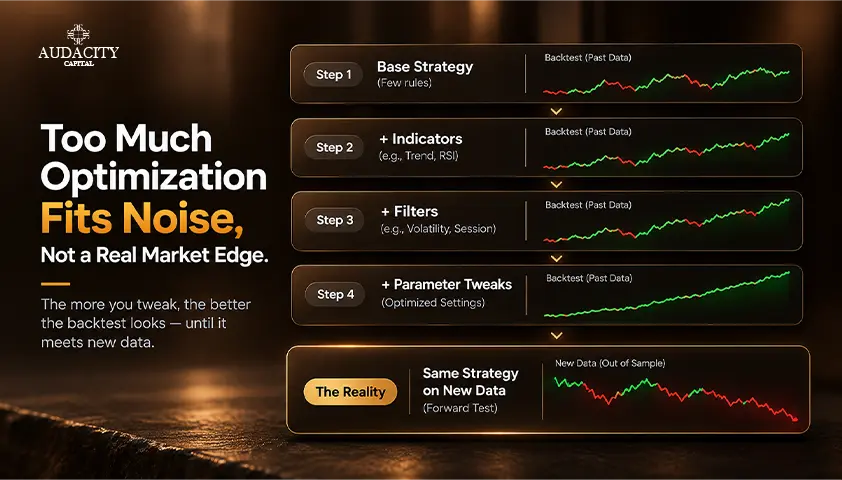
Let's take a hypothetical case. A trader initially has a very simple moving-average crossover system. It shows fairly decent, but not steady performance over several years of historical market data.
The trader then decides that he would like to make the system better. He adjusts the moving average period, applies different stop loss distances, adds an RSI filter and filters out specific trading hours. He sets his take-profit and stop trades for historically weak days of a week.
Every modification makes the historical equity curve better and eventually one specific combination comes up with a very good equity curve.
The trader then sets the parameters, and implements them onto unseen data. Performance drops dramatically.
Stage | Strategy Development | Result |
Initial strategy | Few predefined rules | Moderate historical performance |
Optimization | Multiple parameter combinations tested | Performance improves |
Additional filters | Historical shortcomings eliminated, one by one | Backtest becomes unusually strong |
Unseen data | Rules frozen | Performance deteriorates |
But just one bad out-of-sample test period doesn’t necessarily mean overfitting. There is a sample size issue, market situation, and execution aspects. But still, the trend in this case is quite a common path towards overfitting of the trading strategy.
The problem here is not that the trading system includes a certain set of rules. The problem is that those rules are repeatedly chosen due to their predictive power on the same historical data.
Overfitting vs Underfitting in Trading
When you find it hard to learn and adapt, you may think that the only possible strategy is the simplest one. That overcorrects.
Underfitting is the case when the strategy is too simple to detect the useful structure in the data. Overfitting is the case when it fits too much to past data and noise. The objective here is neither simplicity nor minimum complexity, it is fit for purpose, supported by evidence of robustness.
Underfitting | Reasonable Fit | Overfitting | |
Historical fit | Weak | Useful | Extremely strong |
Complexity | Often too low | Appropriate | Tends to be too many or too specific |
Captures useful structure | Poorly | Better | Signal + historical noise |
Expected generalization | Weak | More robust | Often weak |
One point worth considering here. Even complexity doesn't necessarily mean overfitting. Simple strategies selected after hundreds of trials can also suffer from selection bias, as the best strategy was selected among a great number of alternatives.
Signs a Trading Strategy May Be Overfit
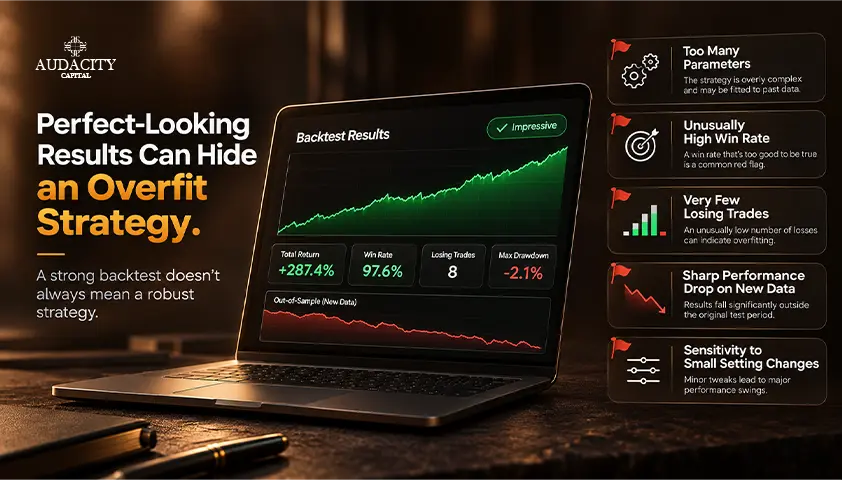
Being able to spot overfitting in trading strategies begins with a crucial piece of information: none of the following indicators, by itself, would be enough to prove that your strategy is overfitted. However, their presence together should be taken into account.
Exceptional Backtest but Weak Unseen Results
The strategy gives an exceptionally good performance based on the backtest data used, yet underperforms badly based on new data never seen before by the algorithm.
While this would be a very strong indicator, it is not conclusive evidence, because factors such as differences in execution, changing market conditions, and small number of observations must be taken into consideration.
Performance Depends on One Exact Parameter Setting
Consider a strategy that works excellently for a moving-average value of 14 and considerably worse for 13 and 15.
This sort of parameter sensitivity indicates that the algorithm probably relies on some sample-specific characteristics. A wide range of similar parameter values that give reasonable results is always preferable.
Too Many Rules and Exceptions
Be wary of such conditions as trading only at specific hours, not trading on a certain day of the week, setting extremely precise indicator values or considering a very specific historical case.
It does not mean that complexity itself means overfitting. The problem arises when many rules were introduced as exceptions to cover up the historical losses.
Performance Comes From a Small Number of Trades
In case a big part of historical profit comes from several trades, think about what will happen after they are stripped out. If total performance is substantially different, the edge is probably weaker than it looks.
Results Depend on One Market or Period
A strategy may look excellent on one currency pair, in one of the market regimes, or across one historical window, while performing very differently elsewhere.
Specialization is not automatically overfitting, since some strategies are intentionally designed for specific environments. The warning sign is unexplained dependence on a narrowly selected sample.
The Backtest Looks Unusually Perfect
An exceptionally smooth equity curve, tiny historical drawdowns or unusually consistent results deserve extra scrutiny, especially after extensive optimization. Smooth performance does not automatically mean manipulation or overfitting.
Treat these signs as a prompt for further robustness testing, not as a reason to discard the strategy automatically.
How to Avoid Overfitting in Trading
No process removes the risk entirely, but these principles make it more manageable.
1. Start With a Trading Hypothesis
Define why the strategy should work before searching through historical combinations. A hypothesis does not guarantee validity, but it reduces the temptation to create rules solely because they improve past results.
2. Keep Unnecessary Complexity Under Control
Every indicator, parameter or filter should have a clear purpose. This is not an argument for always using fewer indicators. It is a caution against complexity that exists mainly to repair specific historical failures.
3. Separate Development and Evaluation Data
Choose what data will be used for the development and what data will be kept aside until optimization starts. If you keep using the aside data to verify the model and adjust the strategy according to the outcomes, the data becomes of no use as independent evidence.
4. Limit Unstructured Parameter Searches
Trying out various parameter values is common practice. Running hundreds or even thousands of parameters and choosing the best historical performance of all raises chances of choosing noise.
5. Prefer Stable Parameter Regions
The strategy must not rely on one best parameter value. You should choose parameter regions where there is a reasonable similarity of behavior.
6. Verify the Strategy Using Unseen Data
Out-of-sample verification tests the finalized strategy on historical data that was not used during its development process. It is one of the key stages of strategy validation, provided the strategy is not adjusted after every verification result.
7. Apply Walk-Forward Analysis When Suitable
Walk-forward analysis is another approach that can be used to analyze whether the development process remains stable throughout the sequential historical periods.
8. Forward Test Frozen Rules
Testing a developed strategy on new market data provides additional evidence. The rules should be frozen prior to testing. Otherwise, you will lose most of the independence of the test by continuing to change the rules based on new results.
9. Include Realistic Trading Costs
Include spreads, commissions and slippage where relevant. Otherwise, your strategy may appear to be more robust from a historical perspective than it will be during real-life application.
10. Test Strategy in Suitable Market Conditions
Where appropriate, check how the strategy behaves in trending, ranging, high and low volatility markets. Not all strategies need to work equally well in all market conditions. The purpose is to understand where its assumptions hold and where they break down.
Can You Completely Eliminate Overfitting?
No validation can remove the risk of overfitting completely. Trading research is mostly based on past observations, but financial markets are non-stationary. Relationships, volatility, participants, liquidity and market structure may change.
The strategy can be thoroughly tested for robustness but act differently at some point in the future. On the other hand, underperformance does not necessarily indicate overfitting of the initial strategy.
The aim of a good research then should not be the proof of future profitability. It should be the reduction of the probability that the observed historical success was a result of luck, biases or noise.
This moves the goal from perfection to robustness of the strategy: the proof that the results are fairly stable in different data, settings and conditions, and not just nicely adjusted to one particular historical path.
Conclusion
The best looking backtest does not necessarily mean the best trading strategy.
A perfectly optimized past outcome may even give less informative evidence than a very simple strategy whose behavior turns out to be quite stable across different datasets, parameter values, and validations.
That is why the negative result of validation should be considered as information rather than the goal of optimization. It can indicate the errors of the strategy, which is extremely valuable.
The purpose of creating the strategy is the discovery of the rules that have some chance to survive beyond the historical sample in which they were formed.
This article is for information purposes only and does not constitute investment, financial or tax advice. Trading is subject to risk. Past performance is not indicative of future results.
Frequently Asked Questions
No, it doesn’t have to. The more samples we have, the higher the probability to estimate performance accurately, but this will not prevent overfitting. There can be a case when a trader optimizes his strategy using the large database, especially when he tests multiple rules, parameters and strategy versions.
Thousands of history samples similar to each other, such as overlapping trades in the same trend pattern, do not necessarily mean thousands of independent samples of information.
It's not necessarily overfitting. Iteration is a natural part of the development process of any trading strategy. However, the overfitting problem begins when the same rules are repeatedly changed mainly due to the fact that the effects of such actions are already known on the same historic dataset.
If the rule change makes sense, then the improved strategy should be backtested on a data set that was unaffected by the decision-making process.
Yes, it can. Overfit strategy doesn't necessarily imply negative returns right away. The overfit strategy may work successfully for some time due to favourable market conditions.
In general, the problem is that the results may inflate expectations concerning reliability or sustainability of any edges revealed in historical data sets. Therefore, profitable trading itself doesn't imply that the strategy wasn't overfitted during research.

Kriptoya disiplinli risk uygulamaya hazır mısınız? Audacity Capital'in yeni kripto enstrümanlarını keşfedin ve ticaret stratejinizi getirin.
Daha Fazla BilgiBülten
Yeniliklerden haberdar olmak için bültenimize katılın.
Sosyal Topluluğumuza Katılın

Bugün Yolculuğunuza Başlayın Ücretsiz Denememizle
Becerilerinizi ve başarılarınızı sertifikalar aracılığıyla gururla sergileyin ve potansiyel yatırımcılardan ve akranlarınızdan sıkı çalışmanız ve özveriniz için takdir alın.
Ücretsiz Denemeİlgili Makaleler
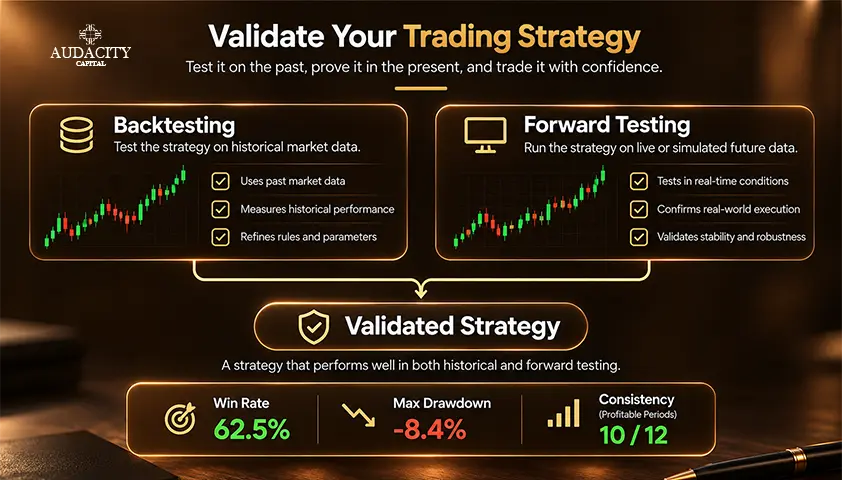
Backtesting vs Forward Testing: How to Validate a Trading Strategy
Compare backtesting vs forward testing, learn how each works, why results differ, and how traders use both to validate a trading strategy.


Stochastic Oscillator
Learn how to use the stochastic oscillator in trading, interpret overbought and oversold levels, spot crossovers, and adjust settings.

NQ in Trading – What is NQ in Trading?
Learn what NQ means in trading, how E-mini Nasdaq-100 futures work, their contract specifications, trading hours, strategies and risks.
Calmar Ratio: Meaning, Formula and Examples
Learn what the Calmar Ratio means, how to calculate it, interpret results, and compare it with Sharpe and Sortino ratios.