
Hanging Man Candlestick Pattern: How to Trade It?
Ask a room full of new traders to pick out a hanging man candlestick pattern on a chart and chances are, all of them would be able to identify it. Ask them what they should be doing about it, and that's where the account losses start.
It is one of the most well-known yet misused candlesticks used by technical traders today.
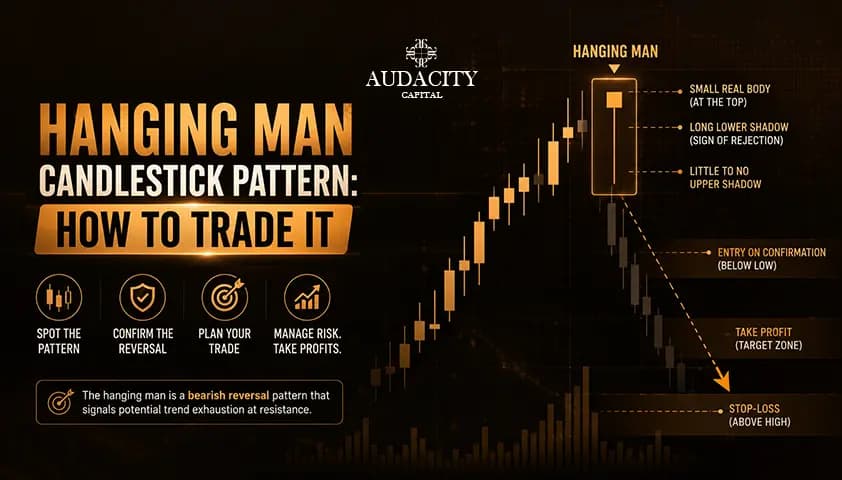
The pattern is relatively simple to understand. The hanging man is a single-candle bearish reversal pattern that appears after an uptrend. It features a small body and long lower wick, indicating that sellers have started their attempt to challenge the uptrend.
One crucial element that we will keep repeating throughout this guide: the hanging man is a warning sign, not a trading trigger.
Below you will learn how to spot this candle, distinguish it from a hammer, how to trade it, and its reliability levels when the hype is stripped away.
What Is the Hanging Man Candlestick Pattern?
Let's start with the definition as precision in this step will solve almost all of the subsequent errors.
The hanging man is a single Japanese candlestick positioned at the top of an uptrend which indicates a possible bearish reversal. The name is derived from its shape, which resembles a hanging man with a dangling limb.
Read the candle as a story about control. The market has been trending up. Then, in one session, sellers manage to drive prices down really hard before the buyers recover ground by the end of the session.
At first glance the candle is nothing special: a small body close to the session high. The long tail beneath is what's important. It's the first sign in a while that sellers are moving this market.
That's an answer to the question which traders are constantly asking: is the hanging man bullish or bearish?
It's bearish but in context. Without a prior uptrend, the pattern is of no value. The exact same candle shape in a different location carries the opposite meaning, which we will untangle shortly.
Hanging Man in the right context represents a classical example of a trend exhaustion. An uptrend continues, but its momentum has been weakened.
What the Hanging Man Looks Like (Anatomy)
First, two vocabulary terms, since the anatomy will not make any sense without them:
- The real body is the thick portion of the candle that lies between the open and close.
- The shadow, or the wick, is the thin line past the body that indicates the extent to which price moved before rejection.
With that in place, a valid hanging man has three features:
- A small real body in the upper portion of the candle's range. The open and close are nestled together close to the session high.
- A long lower shadow, at least two to three times the length of the body. This is the characteristic of a wick. It tracks how low the sellers lowered the price before the buyers raised the price.
- Little or no upper shadow. Price found no way to get a foothold on the top.
What about color? It isn't as important as most beginners think.
Red and green hanging men are both valid. A red body with the candle closing below the open is generally interpreted as somewhat bearish as the buyers were unable to recover the open.
However, location trumps color all the time. Not a red hanging man in the middle of nowhere is important, but rather a green one following a strong uptrend.
Quick identification checklist
- Forms after a clear uptrend.
- Small real body near the top of the candle's range.
- Reduce shadow by 2-3 times the body length.
- Minimal or no upper shadow.
Did all four boxes have a tick? You've got a hanging man to watch. Not trading yet. Watching.
The Psychology Behind The Hanging Man Candlestick Pattern
A candlestick is a condensed history of a day's trading action between buyers and sellers. The hanging man represents a battle that bulls can never feel good winning even though they are the winners.
Walk through the session. Sellers came out in full force and kept prices well under the open. This long lower wick cannot be a coincidence.
It is the first to appear in many sessions and is a sign of the coordinated selling pressure that happens at the peak of a move. The buyers had absorbed everything until that candle. Now they were forced onto defense.
The buyers fight back and regain nearly everything. Prices get pushed up to previous highs towards the close of the session. It is because of this push by buyers that makes the hanging man a warning. The candle dies at the end of the day with sellers hurting the buyers.
However, everything depends on the next candle. If sellers react to the warning, it becomes a signal. But when the buyers overlook the warning and push prices higher, the hanging man fails.
That's the entire purpose of the confirmation rule below, and the most important point in this article.
Hanging Man vs Hammer: Clearing Up the Confusion
If you only fix one mistake after reading this guide, fix this one.
The most common mistake that people make with this pattern is confusion over the hanging man vs hammer, and why not, the two candles are the same in appearance.
Small body, long lower shadow, little upper shadow. Place them side by side on a blank screen and you can't tell them apart.
The difference is solely in terms of location.
- The hammer forms after a downward trend. Its long lower wick shows sellers tried to extend the decline and got rejected, which makes it a bullish signal of a potential bottom.
- The hanging man appears after an uptrend. The same wick shows sellers attacking a rising market, which makes it a bearish signal of a potential top.
Identical shape, opposite meaning. Prior to labeling any small-bodied, long-tailed candle, scan the chart to the left and determine what trend created it.
Here, context is not a detail. It's the entire pattern.
Hanging Man Vs Hammer at a Glance
Feature | Hanging man | Hammer |
|---|---|---|
Shape | Small body, long lower shadow | Identical |
Where it appears | After an uptrend | After a downtrend |
Signal | Bearish reversal | Bullish reversal |
What it warns of | Trend top, buyer exhaustion | Trend bottom, seller exhaustion |
Trade bias | Look for shorts on confirmation | Look for longs on confirmation |
Hanging Man vs Shooting Star and Other Bearish Reversals
There are two other patterns that are grouped in with the hanging man so it's worth separating them out.
The shooting star also occurs during an uptrend, but it is a mirror image of the hanging man: a long top shadow and a small bottom shadow.
This means that the buyers pushed prices up during the session while sellers pulled them down. This is rejection from above, and not from below.
The evening star is an exception. This pattern has three candles, a large bullish candle followed by a smaller indecision candle, followed by a big bearish candle.
It's a similar topping story, but extended over three sessions of one.
All three are top-of-trend warnings. The hanging man is the one with the long, bottom wick.
How to Trade the Hanging Man Pattern (Step by Step)
Well, now for the part promised in the title. Let's check how to trade the hanging man as a systematic repeatable process.
Before the steps, a framing note: this is how traders typically approach the setup, for the purpose of education.
Note: It is not a recommendation or a system to copy without testing.
Step 1: Confirm the context
No uptrend, no hanging man. Check that price has been printing higher highs and higher lows into the candle. Even better, search for the pattern at or near a resistance or supply level where sellers have entered the market previously.
A hanging man that is floating in the middle of a sideways range has very little weight and is best ignored.
Step 2: Wait for confirmation
Don't short the hanging man itself. If you are able to remember one thing from this guide, remember this one.
Wait for the next candle, the confirmation candle, to confirm the warning. The ideal confirmation is typically when a bearish candle closes below the hanging man's real body.
That close proves sellers followed through on the threat the wick made. Without it, you are betting that buyers will fold, and very often they do not.
Step 3: Entry
There are two choices that traders typically make:
- Aggressive entry: short on the close of the confirmation candle. You capture more of the move but accept a wider effective stop.
- Conservative entry: wait for a small pullback towards the broken level or wait to enter when the hanging man breaks below the low. You can possibly miss that trade altogether, but when it fills, it can be a more rewarding risk.
Both ways are NOT “right.” It is important to make the selection beforehand, write it down and use it consistently.
Step 4: Stop-loss
A stop-loss is a predetermined sell-off that can limit your losses when the trade goes against you. In this case, the logical stop is just above the hanging man's high. The logic is simple: When price moves back over that high, buyers are in control and the pattern has failed. At that point there is nothing left to hope for, only a small loss to take.
Step 5: Target and take-profit
The candle doesn't really have a price, so traders borrow one from a different source. There are common levels to exit with profits, also called take-profits, including:
- The closest previous price support point, on which buyers have held prices up.
- A Fibonacci retracement of the prior uptrend.
- A fixed R-multiple, where R equals the amount risked between entry and stop. A 2R target aims to make twice the risk, a 3R target three times. This allows you to stay ahead of the risk-reward ratio even if not every trade is successful.
Please note: These are mechanics and not trading suggestions. Hanging Man reversals do not happen in every case. Position size management will help you far better than any technical analysis pattern.
Improving Reliability: Confirmation and Confluence
One hanging man alone is unreliable. A hanging man along with confirming evidence would be a better indicator. Traders term this as confluence, which refers to the alignment of multiple independent signals. Things that make the pattern more effective:
- Location on resistance or supply levels. A hanging man appearing on a resistant level prior to selling is much more valuable compared to one that appears on an open level area.
- Volume confirmation. A volume surge on the hanging man or confirmation candle indicates no thin market, but a real sell.
- Indicator agreement. Bearish RSI divergence, when price forms a new high while RSI does not, and/or bearish MACD crossover provides further confirmation of fading momentum.
- Higher timeframes. Daily and weekly hanging men are more significant than intraday ones, which create lookalike candles on a regular basis.
The principle is simple. The pattern is one clue. Every independent signal in agreement with it increases the chances. But nothing makes those odds a sure thing.
A Worked Example
The below is an example of a hypothetical, illustrative trade, from start to finish. Not a recommendation and not a typical outcome.
Imagine a forex pair that has been strong for 3 weeks on the daily chart, and is heading towards a zone of resistance where the price has reversed twice this year.
On Tuesday, a hanging man prints: it opens at 1.1050, sells off to 1.0980 during the session, then recovers to close at 1.1045, leaving a long lower wick that probes into the resistance zone. The volume is definitely higher than the recent average.
The trader does nothing at this time. On Wednesday, a bearish candle closes at 1.0970, below the hanging man's low. That's the confirmation.
- Entry: short at 1.0970 on the confirmation close
- Stop-loss: 1.1065, just above the hanging man's high, risking 95 pips
- Target: prior support near 1.0780, roughly 190 pips away, a 2R target
The trader sells at the support level and the price continues to fall in the next sessions, leaving him twice the amount he risked!
Now the honest part. Do the same set-up again, and Wednesday could close higher too, without any trade.
Or confirmation could fire and price could reverse straight through the stop for a 1R loss. These are normal and expected results.
The stop was there because the pattern can fail and the 2R target was there because winners outnumber losers over a series of trades.
Common Mistakes to Avoid
1. Trading without confirmation. Shorting the hanging man itself produces constant false entries. Fix: always wait for a bearish candle to close below its body or low.
2. Ignoring trend context. The same candle after a downtrend is a hammer, a bullish pattern. Fix: verify a real prior uptrend before labeling it a hanging man.
3. Over-relying on the pattern. No candle works in isolation. Fix: require confluence from levels, volume, or indicators before acting.
4. Ignoring volume. A low-volume hanging man often reflects thin trading, not real selling. Fix: favor setups where volume spikes on the pattern or confirmation.
5. Ignoring key levels. A hanging man mid-range carries little weight. Fix: prioritize ones forming at resistance or a supply zone.
6. Skipping the stop or risk sizing. A failed pattern without a stop becomes an account problem. Fix: define your stop above the high and your risk per trade before entering.
How Reliable Is the Hanging Man, Really?
Most pattern guides dodge this question. Here is the straight answer.
On its own, the hanging man is a low-to-moderate reliability signal that produces frequent false positives, especially on lower timeframes and without confirmation.
That should make sense given the psychology. The candle closes near its high, meaning buyers won the session's final exchange.
Researchers who have tested candlestick patterns statistically, most notably Thomas Bulkowski, have found the hanging man acts as a reliable reversal only a minority of the time when taken in isolation.
Treat any specific win-rate figure with skepticism: candlestick statistics are contested and vary widely by market, timeframe, and how strictly the pattern is defined.
The honest framing is this.
The hanging man is probabilistic, not predictive. Its value comes from context and confluence: a genuine uptrend, a meaningful level, volume, and confirmation.
Not from the candle itself. No pattern guarantees a reversal, and risk management is what keeps your account intact on the many occasions when this one fails.
Trading carries significant risk, and hypothetical examples like the one above do not guarantee real results.
Where the Hanging Man Fits a Disciplined Process
Put the pieces together and the hanging man earns a modest, useful place in a trader's toolkit. It is one clue among many.
It works inside a process built on trend context, confirmation, confluence, defined risk, and honest review of results.
Traders who treat a single candle as a guaranteed signal tend to be the ones who blow up. Traders who treat it as one input in a tested, risk-managed system tend to be the ones who last.
Recognizing the pattern is step one. Trading it well takes a rules-based process, strict risk control, and enough screen time to trust your own execution.
That is the kind of disciplined trading Audacity Capital is built to support, with simulated funded accounts offering up to 90% profit share and free education through Trader University, so you can build skill with structure instead of risking large amounts of your own capital.
If you want to put your price-action skills inside a proper framework, explore Audacity Capital's funding programs. No pattern and no funded account makes anyone profitable.
Related Articles
Candlestick Patterns Explained: How Traders Read Price Action
Bullish Engulfing Candlestick Pattern: The Complete Trader's Guide
Bearish Engulfing Candlestick Pattern: The Complete Trader's Guide
Which Chart Is Best For Beginners In Forex Trading? Why?
Frequently Asked Questions
The hanging man is bearish, but only when it appears after an uptrend. It warns of a potential market top by showing that sellers were able to drive price sharply lower during the session. On its own it is a warning of trend exhaustion, not a confirmed reversal signal.
They share an identical shape: a small real body with a long lower shadow. The difference is location. The hammer forms after a downtrend and signals a potential bullish reversal. The hanging man forms after an uptrend and signals a potential bearish reversal. Trend context determines the meaning.
Yes. The hanging man is a warning, not a standalone signal, and it fails frequently without follow-through. Most traders wait for a confirmation candle, typically a bearish candle closing below the hanging man's body or low, before considering a short position.
Low to moderate on its own, with frequent false signals. Reliability improves meaningfully with confirmation, a volume spike, formation at resistance or a supply zone, and higher timeframes such as the daily or weekly chart. No combination of factors makes the pattern a guaranteed reversal.
Daily and weekly charts generally produce more meaningful hanging man signals than intraday charts. Lower timeframes are noisier, so small-bodied candles with long lower wicks appear constantly without carrying real significance. Many traders use higher timeframes for the signal and lower ones for entry timing.
The common placement is just above the high of the hanging man candle. If price trades back above that high, buyers have reasserted control and the setup is considered invalid, so the stop exits the trade with a small, predefined loss.
هل أنت مستعد لتطبيق مخاطر منضبطة على العملات المشفرة؟ استكشف أدوات التشفير الجديدة من Audacity Capital واجلب استراتيجية التداول الخاصة بك.
اعرف المزيدالنشرة الإخبارية
انضم إلى نشرتنا الإخبارية.
انضم إلى مجتمعنا الاجتماعي
ابدأ رحلتك اليوم مع تجربتنا المجانية
اعرض مهاراتك وإنجازاتك بفخر من خلال الشهادات واحصل على تقدير لعملك الجاد وتفانيك من المستثمرين المحتملين والأقران.
تجربة مجانيةمقالات ذات صلة
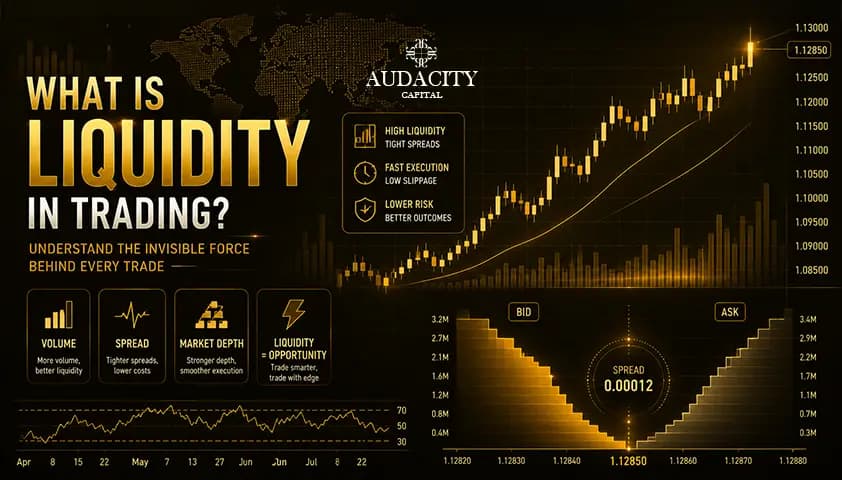
What Is Liquidity in Trading? A Complete Guide
What is liquidity in trading? Learn how volume, the bid-ask spread, and market depth shape your costs, plus high liquidity vs low liquidity explained with examples.

5 Best Free Paper Futures Trading Platforms
Compare the best free paper futures trading platforms in 2026. Practice futures trading risk-free with real-time market data, advanced charting, and simulated trading accounts.

What Is Pre-Market Trading? Hours, Strategy & How to Trade
Pre-market trading lets you trade stocks before the 9:30am ET open. Learn the hours, how it works, what you can trade, and the risks involved

CFD Trader Guide: How to Become a Profitable CFD Trader?
Learn how to become a profitable CFD trader: master leverage, manage costs, control risk, and build a tested strategy. An honest, practical guide for beginners.