


Supertrend Indicator: Explained


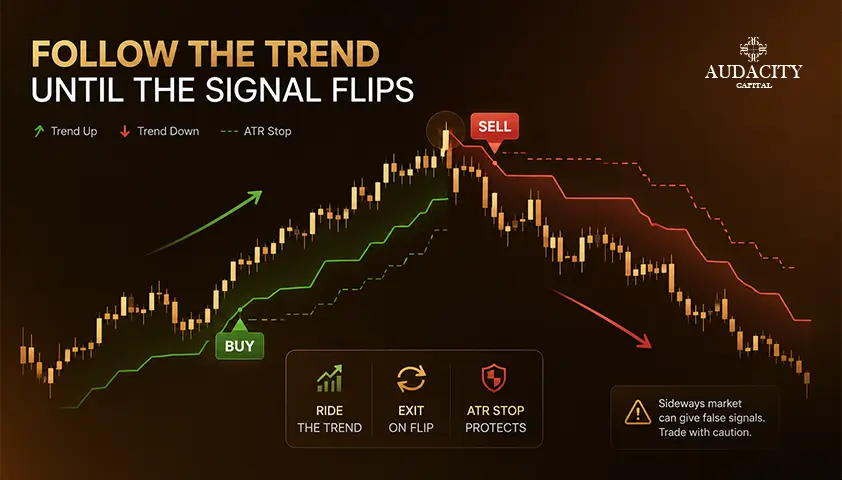
The Supertrend indicator is a trend-following tool based on the Average True Range (ATR). It plots a single line that changes its positions and colors along with the trend.
The line appears below the price and turns green in an uptrend and goes above the price and becomes red during a downtrend. When the price crosses the line, the tool flips, indicating a possible change of direction.
It was created by French trader Olivier Seban and became quite popular as it looks clean, reads at a glance, and adapts to changing volatility.
This article will describe what the indicator is, how it is calculated using ATR and multiplier, how to interpret the line, how to adjust it, how to trade it and where it fails.
Educational content only, not investment advice. The Supertrend works best in trending conditions and whipsaws in ranges. No indicator will give a guaranteed result and most retail traders lose money.
What the Supertrend Indicator Is
The Supertrend is a trend-following indicator that is based on volatility. It draws a single line which serves as dynamic support and resistance. During uptrends, the line is below price, and during downtrends the line is above price.
The switching of lines occurs only when the price closes through the active band. It was introduced by Olivier Seban and has gained widespread use on TradingView, broker platforms, and even custom charts on forex, indices, stocks, and cryptos.
It is characterized by its ATR connection. A volatility measure is used to offset the line from price, not a fixed distance. The distance tends to increase as ATR increases. As ATR decreases, the distance tends to get smaller. One of its chief features is this volatility adjustment, as opposed to fixed-distance approaches.
How is the supertrend calculated?
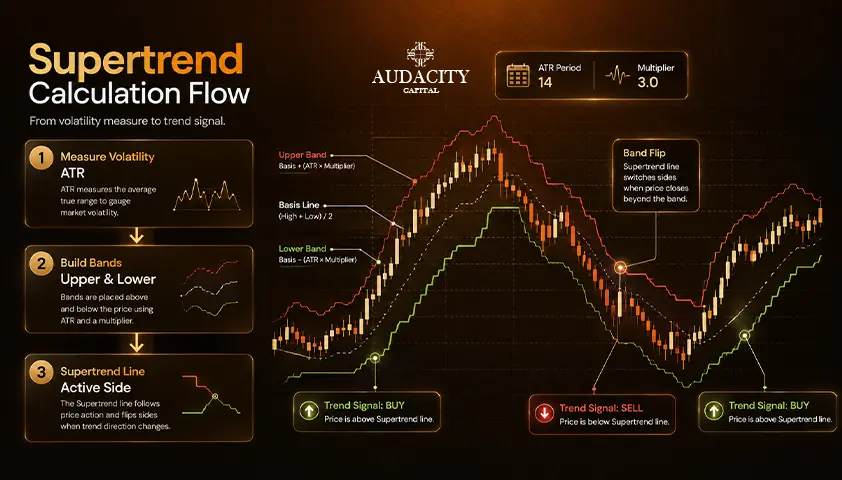
The formula is not as complicated as it appears. Start with the midpoint of each bar:
HL2 = (High + Low) / 2
The basic upper band is:
Upper Band = HL2 + (ATR × Multiplier)
The basic lower band is:
Lower Band = HL2 − (ATR × Multiplier)
The flip logic makes it unique compared to a simple channel indicator because the output will be the bands that are only capable of moving in the same direction of the trend. The lower band will keep rising throughout uptrends and the upper one falling during downtrends.
The Supertrend indicator changes direction whenever the price closes outside of its active band, switching to green below price on an upside flip and red above price on a downside one.
Two parameters determine everything:
- The ATR period, which determines how many bars worth of volatility go into the calculation. 10 is the usual default value.
- The multiplier, which determines how far away from the price the bands are in terms of ATRs. 3 is the usual default value.
As the indicator is based on ATR, knowledge of ATR is a must beforehand. If you do not know what Average True Range is, study it before moving on here.
The values provided are indicative only. Some platforms use an ATR length of 7 or 14 as opposed to 10. The flip logic may vary slightly depending on the implementation. Verify the exact formula of your platform.
How to Read the Supertrend?
The line is easy to read: a green line under price indicates an upward trend that can serve as trailing support for long trades. A red line above price means a downward trend and serves as a trailing resistance for short trades.
Color and location changes mean a trend reversal is possible and constitute the main signal of the tool.
Traders also commonly use the line as a trailing stop. Its distance from price depends on volatility and isn't constant at a certain number of pips or points.
That's what makes it useful in trend trading.
A flip is a signal to consider and not a confirmation of anything. Flips within the range are usually false, and assuming that a trade entry should be placed automatically after a flip is the quickest way to lose money on this indicator.
Supertrend Is ATR Bands That Flip: The Multiplier Trade-off
In a nutshell, the Supertrend is a combination of ATR-based bands that flip with the price action. The multiplier manages the distance of those bands from the market.
Knowing how that thing works is key to making the indicator useful.
1. The multiplier is the dial
A higher multiplier moves the lines away from price. You get fewer flips, trend signals that are less noisy and fewer whipsaws in exchange for later entries and wider trailing stops.
A lower multiplier leaves the lines closer to price. Signals come in quicker, but false flips are more frequent, particularly in ranges.
ATR period also influences responsiveness. A longer period results in a smoothed volatility, while a shorter period leads to higher responsiveness.
In other words, the multiplier determines responsiveness; ATR period determines how smooth volatility is.
2. The volatility-adaptive edge
A stop that is set for a fixed distance cannot be adjusted. This way the indicator can change the trailing distance depending on current market conditions. That is one of the main advantages of using ATR in the calculations.
3. Best settings, honestly framed
There is no standard setting. The common settings of 10 and 3 could serve as an example for many different markets and timeframes.
The more narrowed settings like 7 and 2 will be quicker to react, but may result in more whipsaws.
On the other hand, wider settings like 14 and 4 provide a smoother line but slower responses and wider stops.
They should only be viewed as an example for testing on your particular market and timeframe, not as guaranteed optimal settings.
The aim is to achieve a balance between responsiveness and noise. Always backtest your particular setup before trading with real money.
How to Use the Supertrend in Your Trading?
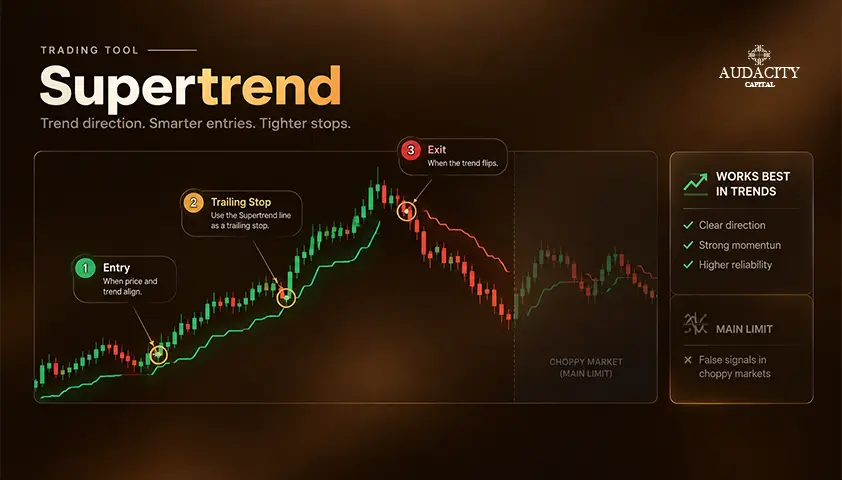
To learn how to trade with supertrend indicator setups, you need to know its four main applications.
1. Trend filter and entries
Use the color and side of the line to define trading bias. If the line is green and below price, only take long setups from other tools or price action. If the line is red and above price, only take shorts.
Alternatively, use a fresh flip as a timing cue. The setup should still align with the higher-timeframe trend and your existing entry rules.
2. Trailing stop
The Supertrend can also be used as a trailing stop. Enter based on a separate setup, then move the stop toward the Supertrend line as the trend develops. Exit when price closes on the other side of the line. The changing distance can help keep the stop away from routine price noise.
3. Confluence
A supertrend strategy built on raw flips alone is fragile. Pair the line with a momentum tool such as the RSI or MACD, a higher-timeframe trend read, or a volume filter.
Many traders also wait for a pullback toward the line instead of chasing price after a large move. This can provide a more favorable entry on trend continuations.
4. Multi-timeframe use
Read the Supertrend on a higher timeframe to establish direction. Then use a lower timeframe to look for entries. This can help filter out some of the low-quality flips that appear on faster charts.
Every rule above is illustrative. Backtest any configuration on the specific instrument and session before risking capital, and expect losing trades even when the process is sound.
Limitations and Common Mistakes
Common mistakes
- Trading raw flips inside a range.
- Leaving the multiplier at its default without testing it on the actual market.
- Chasing price far from the line instead of waiting for a pullback.
- Ignoring higher-timeframe context.
- Treating a 5-minute flip as if it overrides a daily trend.
- Using the indicator as a complete trading system rather than one component of a broader process.
Limitations
- The Supertrend can whipsaw in sideways markets. The volatility offset does not always prevent repeated false flips when price lacks a clear direction.
- It also lags. ATR uses historical data, and the standard flip is confirmed only after the relevant price movement.
- Some implementations update during the current bar. This can look like repainting until the bar closes. For consistency, judge signals using closed bars and check how your platform handles intrabar updates.
- On MT4 and MT5, Supertrend is commonly added through a custom indicator, while TradingView provides it as a built-in indicator. On its own, the indicator does not guarantee a statistical edge.
The Supertrend works best as part of a broader trading process that includes confluence, position sizing, and risk management. To see whether it fits your trading style, test it on a demo or simulated account and journal the results before risking real capital.
Conclusion
The Supertrend is a trend-following indicator based on ATR which alternates green and red according to the trend direction.
The indicator is a good volatility adaptive trailing stop. The multiplier controls the balance between responsiveness and whipsaw and the ATR period determines the smoothness of volatility calculation.
There is no magical value for both parameters.
The proper way of applying the indicator is to use it as a trend filter and a trailing stop but not as a signal generator.
Test the settings and entry criteria on a certain market and timeframe, add context from price action, higher timeframes, or other indicators where appropriate.
Test the strategy on a demo or simulated account, record the results, and analyze them before you risk your money. In combination with another trading approach, the Supertrend indicator can become a valuable addition.
Frequently Asked Questions
The common default is an ATR period of 10 and a multiplier of 3. Tighter settings such as 7 and 2 react faster with more whipsaw, and wider settings such as 14 and 4 produce smoother lines with later signals. Test on the specific market and timeframe rather than assuming any configuration is optimal.
Yes. The Supertrend is built using the Average True Range and a multiplier. As ATR changes, the distance between the line and price changes too. This gives the indicator its volatility-adaptive behavior.
Some implementations update within the current bar until it closes, which can look like repainting on live charts. Rely on closed-bar signals to avoid acting on movements that reverse before the bar ends, and verify how the specific platform version behaves before trading it.
You can, but it whipsaws in ranges and offers no edge without context. Most traders add a filter such as a higher-timeframe trend read, RSI, or MACD, and use the line mainly as a trailing stop rather than as a standalone entry signal.
Both follow trend, but the Supertrend offsets its line by a volatility-based ATR distance and flips only on a close beyond the active band. A moving average sits at a fixed calculation of price and does not adapt to volatility, so the Supertrend responds to changing conditions in a way a moving average cannot.
Both are trend-following flip tools frequently used as trailing stops. The Supertrend is built on ATR volatility bands, while the Parabolic SAR is an accelerating stop-and-reverse level that tightens over time regardless of volatility. Both whipsaw in ranges and neither is reliable without confluence.
It works on any timeframe. Higher timeframes produce fewer and cleaner flips, while lower timeframes produce more flips with more noise. Performance improves in trending conditions on any timeframe and degrades in ranges on all of them.
It can be, because it provides a clear intraday bias and an adaptive trailing stop. Intraday ranges do generate whipsaws, though, so a higher-timeframe filter, sensible settings for the session being traded, and confluence with another tool matter more on faster charts than on daily charts.

هل أنت مستعد لتطبيق مخاطر منضبطة على العملات المشفرة؟ استكشف أدوات التشفير الجديدة من Audacity Capital واجلب استراتيجية التداول الخاصة بك.
اعرف المزيدالنشرة الإخبارية
انضم إلى نشرتنا الإخبارية.
انضم إلى مجتمعنا الاجتماعي

ابدأ رحلتك اليوم مع تجربتنا المجانية
اعرض مهاراتك وإنجازاتك بفخر من خلال الشهادات واحصل على تقدير لعملك الجاد وتفانيك من المستثمرين المحتملين والأقران.
تجربة مجانيةمقالات ذات صلة
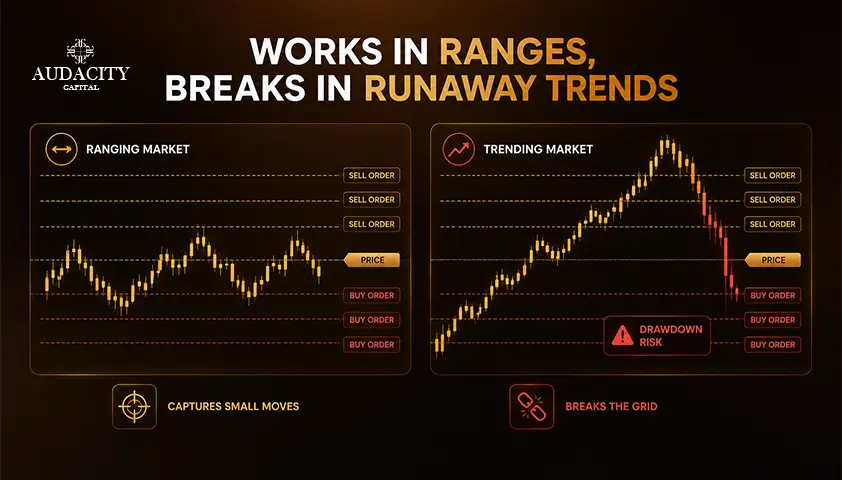
Grid Trading: How It Works and Where It Breaks
Placing orders across a range can profit from chop without predicting direction, but a trend can blow it up. See the mechanics and the failure mode.

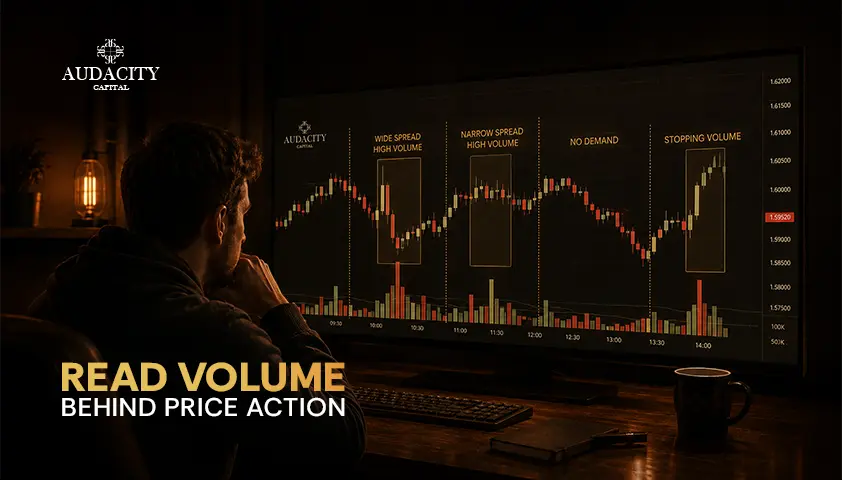
Volume Spread Analysis (VSA) Explained
Learn how volume spread analysis uses price range and volume to reveal supply and demand. Master key signals, market context, and limits.
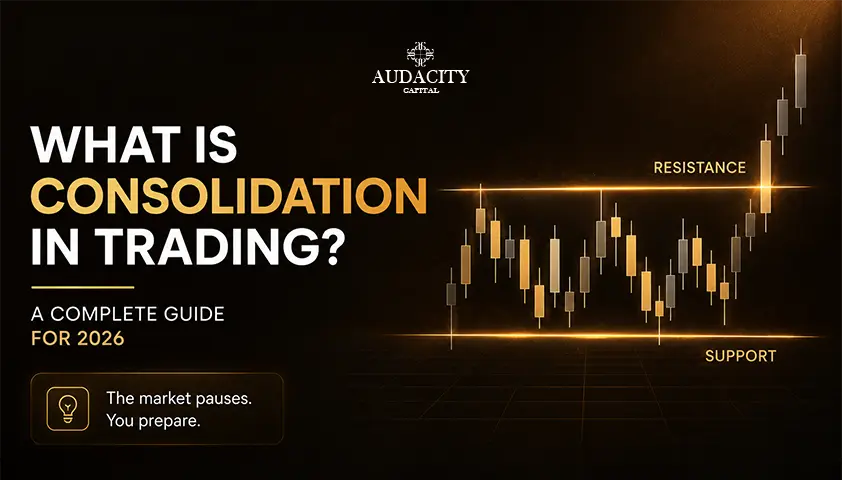
What Is Consolidation in Trading? A Complete Guide for 2026
Learn what consolidation in trading means, why it happens, how to identify consolidation patterns, spot breakouts, avoid false signals, and trade sideways markets.
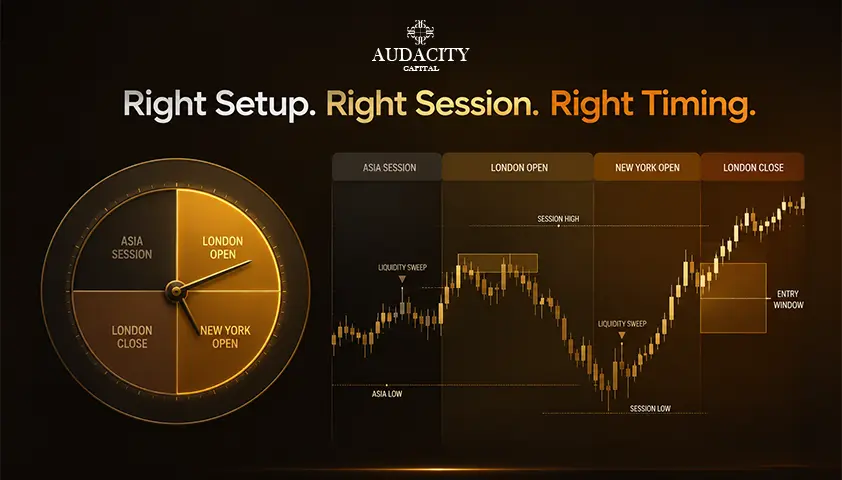
ICT Kill Zones and Session Timing: A Practical Guide for Intraday Traders
See the main ICT kill zone times for London, New York and Asia, plus DST rules and a simple workflow for using session timing.