



Bearish RSI Divergence: How to Spot It, Confirm It and Trade It



Introduction
Price can keep climbing long after the buying pressure behind it has started to fade. Traders who only watch candles often miss that shift until the market has already turned. Bearish RSI divergence is one of the most widely used tools for catching it earlier.
The idea is simple. When price makes a higher high but the Relative Strength Index (RSI) makes a lower high, momentum is no longer agreeing with price. Buyers are still pushing, but with less force each time. That disagreement can be an early sign that an uptrend is running out of steam.
The catch is that divergence on its own is not a sell signal. Plenty of traders have shorted a "perfect" divergence only to watch price grind higher for another week. Used properly, though, with confirmation, structure and sensible risk management, bearish divergence becomes a genuinely useful part of a reversal or pullback strategy.
This guide covers what bearish RSI divergence is, the two main types, how to spot it without forcing it, how to confirm it, and how to build a complete trade around it.
A Quick Refresher on the RSI
The Relative Strength Index was developed by J. Welles Wilder and introduced in 1978. It is a momentum oscillator that measures the speed and size of recent price changes and plots the result on a scale from 0 to 100.
A few basics worth keeping in mind:
- Default setting: 14 periods. On a daily chart that means the last 14 days, on a 1-hour chart the last 14 hours.
- Overbought and oversold: readings above 70 are traditionally considered overbought, and readings below 30 oversold.
- The 50 line: often overlooked, but useful. Sustained readings above 50 suggest bullish momentum, while readings below 50 suggest bearish momentum.
The key point is that RSI measures momentum, not direction. A market can stay overbought for a long time in a strong trend. That is exactly why divergence matters more than a single overbought reading: it tells you momentum is weakening, not just that it is high.
Read more about RSI Divergence: A Complete Guide
What Is Bearish RSI Divergence?
Bearish divergence occurs when price and the RSI move in opposite directions at swing highs.
Specifically, regular bearish divergence forms when:
- Price prints a higher high, and
- The RSI prints a lower high at the same time.
In plain terms, price has reached a new peak but the momentum behind that peak is weaker than it was at the previous one. The rally is still going, but it is running on less fuel.
You will most often see it at the end of an extended uptrend, after a sharp impulsive move, or as price pushes into a major resistance level. It is a warning, not a verdict.
Regular vs Hidden Bearish Divergence
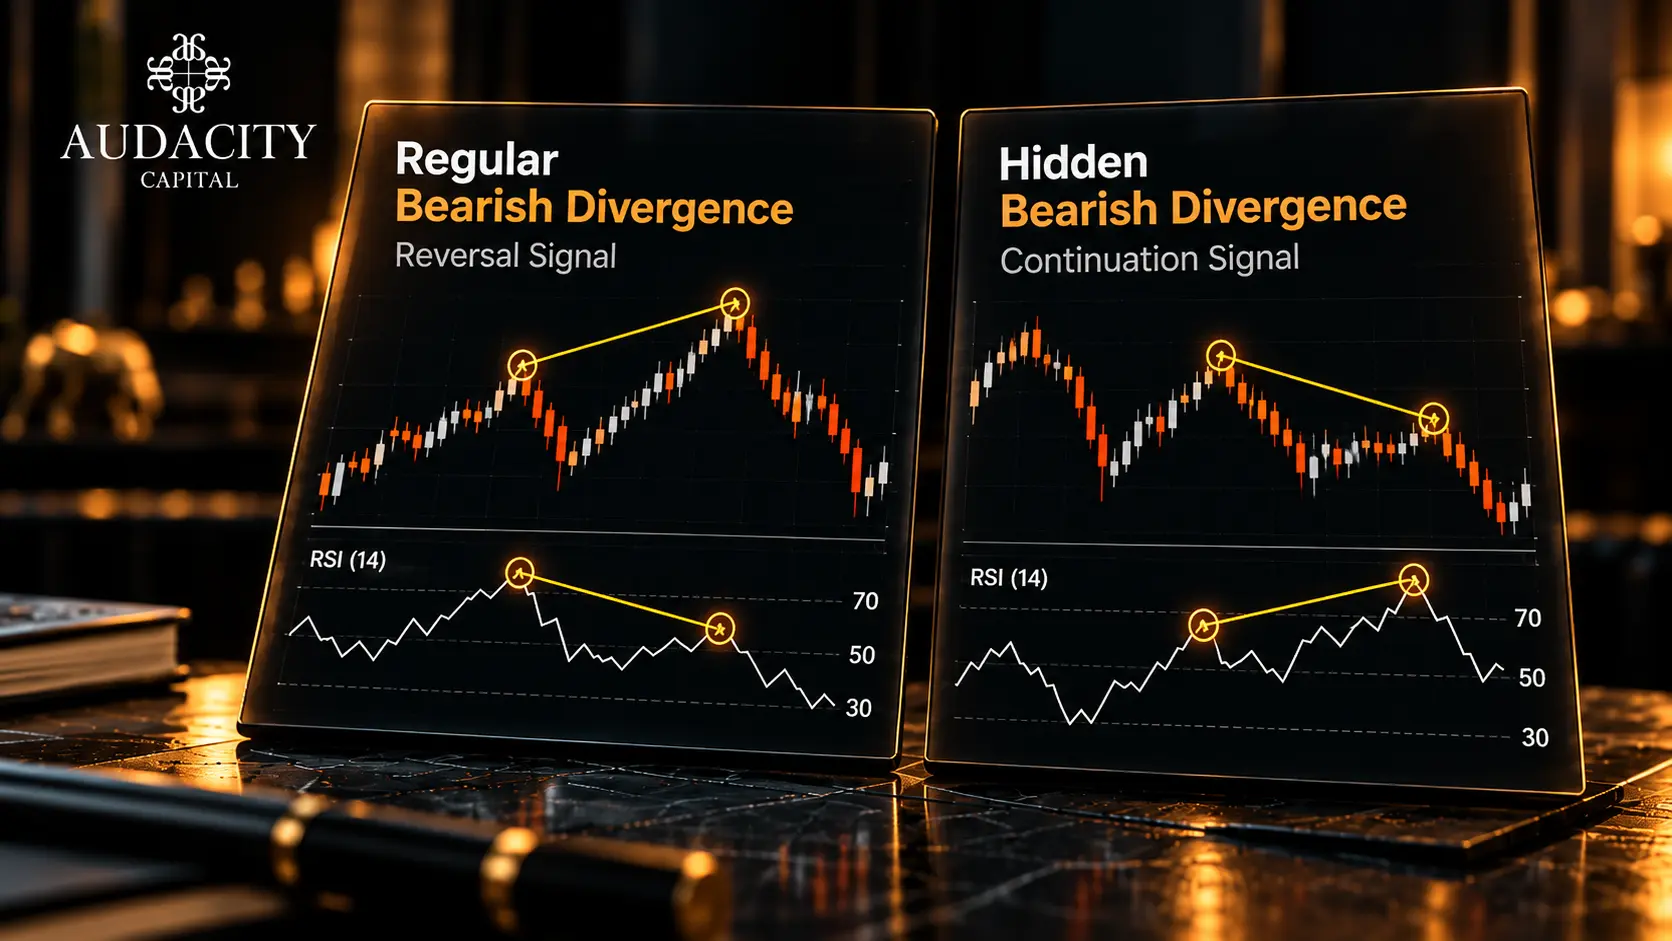
There are two types of bearish divergence, and they mean very different things.
Regular Bearish Divergence (Reversal Signal)
- Price: higher high
- RSI: lower high
- Context: found in an uptrend
- Implication: the uptrend may be weakening and a reversal or deeper correction could follow
This is the version most traders mean when they talk about bearish divergence.
Hidden Bearish Divergence (Continuation Signal)
- Price: lower high
- RSI: higher high
- Context: found in a downtrend, usually during a pullback
- Implication: the pullback is losing steam and the dominant downtrend is likely to resume
Hidden divergence is often considered more reliable". It’s a widely held view among traders, but we don’t have data behind it, and stating it as fact is easy to challenge. It trades in the direction of the existing trend rather than against it. If the market is already making lower highs and lower lows, a hidden bearish divergence on a pullback can offer a well-timed entry back into the move.
A useful way to remember the difference: regular divergence looks for the end of a trend, hidden divergence looks for the end of a pullback.
Why Bearish Divergence Works
Momentum tends to change before price does. Think of a ball thrown upwards. It keeps rising for a moment after it starts to slow, then stalls and falls. Markets behave in a similar way.
When an uptrend is healthy, each new high is driven by strong buying, and the RSI rises with it. As the trend matures, a few things start to happen:
- Early buyers begin taking profits.
- Fewer new buyers are willing to pay higher prices.
- Each push higher is smaller or slower than the last.
Price may still squeeze out a new high, often by triggering stop losses or breakout orders above the previous peak, but the effort behind it is weaker. The RSI picks up on that drop in effort, which is why it can flag exhaustion before the chart structure breaks.
How to Identify Bearish Divergence Correctly
Most divergence mistakes come from poor identification rather than poor execution. These rules keep things objective.
1. Compare swing highs, not random candles
Divergence only counts at clear swing highs: peaks with lower highs on either side. Comparing two arbitrary points on a chart will show you "divergence" everywhere.
2. Align the RSI peaks with the price peaks
The RSI high you compare should line up with, or sit very close to, the matching price high. If the RSI peak happened several candles before the price peak, you are not comparing like with like.
3. Be consistent with wicks or closes
Some traders measure price highs using wicks, others using candle closes. Either works, but pick one and stick to it. Mixing them creates false signals.
4. Look for adjacent swings
The two highs should be relatively close together, typically within 5 to 60 candles on your chosen timeframe. Divergence between highs that are months apart on a 15-minute chart is meaningless.
5. Favour divergence from overbought territory
Divergence where the first RSI peak was above 70 tends to carry more weight. It shows momentum was genuinely stretched before it started fading.
6. Notice when it stacks
Sometimes price makes three or more higher highs while the RSI makes successively lower highs. This is often called triple divergence, and it tends to signal more significant exhaustion than a single divergence.
Choosing the Right Timeframe
Divergence appears on every timeframe, but its reliability is not equal across them.
- Higher timeframes (4-hour, daily, weekly): fewer signals, but they tend to be more meaningful and lead to larger moves. Swing traders usually work here.
- Lower timeframes (5-minute, 15-minute): many more signals, but also far more noise. Divergence here often produces small pullbacks rather than full reversals.
A practical approach is to identify divergence on a higher timeframe and then drop to a lower one to time the entry. For example, spot divergence on the 4-hour chart, then wait for a break of structure on the 15-minute chart before acting.
Always check the higher-timeframe trend too. A bearish divergence on the 1-hour chart is far less convincing if the daily chart is in a strong, clean uptrend with no sign of resistance overhead.
Confirmation: The Step Most Traders Skip

This is where most of the edge lies. Divergence tells you momentum is fading. Confirmation tells you sellers have actually stepped in.
Useful forms of confirmation include:
Break of market structure
The strongest confirmation is price breaking below the most recent higher low, the swing low between the two divergent highs. That break shows buyers have lost control of the structure, not just the momentum.
RSI crossing below 50
When the RSI drops below the 50 line after a divergence, momentum has shifted from bullish to bearish territory. Some traders also watch for the RSI breaking below its own previous trough.
Bearish candlestick patterns
A bearish engulfing candle, shooting star or evening star at the second high adds weight, particularly on higher timeframes.
Location
Divergence that forms at a meaningful level, such as a higher-timeframe resistance zone, a round number, a previous weekly high or a supply area, is considerably more reliable than divergence floating in the middle of nowhere.
You do not need every form of confirmation at once. But trading divergence with none of them is essentially guessing the top.
Entry Methods
There are three common ways to enter once a bearish divergence has formed.
1. Aggressive entry
Enter short as soon as the second high is confirmed, usually after a strong bearish rejection candle. This gives the best price and the tightest stop, but the lowest probability, because structure has not yet broken.
2. Break-of-structure entry
Wait for price to close below the swing low between the two highs, then enter on that close. Probability improves, but the entry price is worse and the stop has to be wider.
3. Retest entry
Wait for the break of structure, then for price to pull back into the broken level (or into a nearby supply zone) and reject it. This is usually the best balance of probability and risk-to-reward, although some moves will not retrace and you will miss them.
Many traders favour the retest entry because it confirms both the shift in momentum and the shift in structure, while still offering a defined, reasonable stop.
Trading divergence on a funded account
On a funded account, a good setup is only half the job. The other half is staying inside the account’s risk rules while you wait for divergence to play out. A few adjustments help.
Size for the daily limit, not just the trade. Most prop accounts cap daily loss at around 4 to 5%. At 1% risk per trade, it takes four or five consecutive losses to reach that limit. At 2 to 3%, two losing divergence trades can end your day, or your account.
Count correlated trades as one. Divergence often appears across several related markets at once, such as EUR/USD, GBP/USD and the dollar index. Shorting all three is one idea with triple the risk. Pick the cleanest setup.
Watch floating profit at the daily reset. Many firms reset the daily loss limit at rollover from the higher of balance or equity. A winning short held overnight can raise your floor, so a reversal the next day breaches the limit sooner than you expect. Taking partial profits before rollover, as in the worked example, reduces that risk.
Factor in holding costs. Higher-timeframe divergence trades can run for days. Commission and overnight swaps reduce what reaches your account, so check your account’s trading costs before you set targets.
Accept that divergence fails. Because it can repeat several times in a strong trend, plan for a string of losses before a winner. Your risk per trade should let you survive that string comfortably
Stop Loss Placement and Profit Targets
Stop loss
The logical stop for a bearish divergence trade sits above the second (higher) high, with a small buffer to account for spread and volatility. If price breaks above that high again, the divergence idea has failed and there is no reason to stay in.
Avoid tucking the stop just a few pips above the high with no buffer. That area is often swept before a genuine reversal begins.
Profit targets
Sensible targets include:
- The most recent swing low or demand zone below price
- The origin of the final impulsive leg that created the higher high
- A fixed risk-to-reward multiple, such as 1:2 or 1:3
- The 50-period or 200-period moving average, which often acts as a magnet during corrections
Taking partial profits at the first target and moving the stop to breakeven is a popular way to manage the trade, especially when you are trading against the higher-timeframe trend.
Combining Divergence with Market Structure and Liquidity
Bearish divergence pairs particularly well with smart money and market structure concepts.
A common high-probability pattern looks like this:
- Price is in an uptrend and forms a clear swing high.
- Price then pushes just above that high, sweeping the buy-side liquidity resting there (breakout buyers' entries and short sellers' stop losses).
- At the same time, the RSI prints a lower high, forming bearish divergence.
- Price then reverses sharply and breaks below the most recent higher low, a change of character.
- Price retraces into a bearish order block or fair value gap created by that move, offering an entry.
In this setup, the divergence explains why the new high was weak, the liquidity sweep explains what the move above the high was for, and the structure break confirms that control has changed hands. Each element strengthens the others.
You can trade divergence without any of these concepts, but if you already use market structure, layering them together tends to filter out a large share of weak signals.
Common Mistakes to Avoid
Treating divergence as an automatic sell signal
Divergence shows weakening momentum, not a guaranteed reversal. Without confirmation, you are trying to call a top.
Shorting strong trends too early
In powerful trends, the RSI can diverge two, three or four times while price keeps rising. Each divergence looks convincing and each one fails. If the trend is clean and strong, divergence alone is not enough reason to fight it.
Forcing the pattern
If you have to squint to see it, it probably is not there. Good divergence is obvious at a glance.
Ignoring the higher timeframe
A lower-timeframe divergence pointing against a strong higher-timeframe trend usually leads to a small pullback at best.
Misreading divergence as it forms
Divergence is only confirmed once the second swing high is complete. While price is still rising, the RSI reading can change. Acting before the swing has actually formed leads to signals that "disappear".
Trading around high-impact news
Major releases such as central bank rate decisions or inflation data can override technical signals entirely. Divergence before a scheduled event is far less reliable. If you do trade through news, size down and widen your stop to account for the spike
Using poor risk management
Even good divergence setups fail regularly. Risking a fixed, modest percentage per trade keeps those losses manageable.
Worked Example: EUR/USD on the 4-Hour Chart
The figures below are illustrative and used purely to demonstrate the process.
The setup
EUR/USD has been in an uptrend for several weeks on the 4-hour chart, making consistent higher highs and higher lows.
- First swing high: price peaks at 1.0950, with the RSI reading 74 (overbought).
- Pullback: price retraces to a higher low at 1.0905.
- Second swing high: during the London session, price pushes above the previous high to 1.0985, sweeping the liquidity above 1.0950. This time the RSI only reaches 66.
Price has made a higher high. The RSI has made a lower high. That is regular bearish divergence, and the first RSI peak was in overbought territory.
Confirmation
Two 4-hour candles after the second high, price closes below the higher low at 1.0905. The structure has broken. The RSI also drops below 50, confirming that momentum has shifted to the sellers.
Entry
Rather than chasing the breakdown, the trader waits for a retest. During the New York session, price pulls back to just above the broken level and rejects it with a bearish candle.
Stop loss
The stop is placed above the second high with a 10-pip buffer, at 1.0995. That is a risk of 80 pips.
Position sizing
- Account size: $100,000
- Risk per trade: 1%, or $1,000
- Pip value: approximately $10 per standard lot on EUR/USD
- Position size: $1,000 ÷ (80 pips × $10) = 1.25 standard lots
Targets
- Target 1: the previous demand zone at 1.0835, which is 80 pips away (1:1 risk-to-reward). Half the position is closed here and the stop moves to breakeven.
- Target 2: the origin of the last impulsive leg at 1.0755, which is 160 pips from entry (1:2 risk-to-reward).
Outcome
If both targets are hit, the trade returns $500 on the first half (80 pips × 0.625 lots × $10) and $1,000 on the second half (160 pips × 0.625 lots × $10), These figures exclude spread, commission and overnight swap. On a 4-hour trade held for several days, those costs can take a noticeable bite out of the reward, so factor them into your targets
If the setup had failed and price had broken above 1.0995, the loss would have been capped at the planned $1,000.
The value of this example is not the profit figure. It is the sequence: divergence spotted, structure broken, entry on a retest, stop above the invalidation point, and position size calculated from a fixed percentage of risk.
Key Takeaways
- Bearish RSI divergence means price makes a higher high while RSI makes a lower high: momentum is fading.
- Regular divergence warns of a reversal in an uptrend; hidden divergence signals a downtrend is likely to continue.
- Divergence is a warning, not a trigger. Wait for a break of structure or RSI crossing below 50.
- Stops go above the second high with a buffer; size every trade from a fixed percentage of risk.
- In strong trends, divergence can fail repeatedly, so don’t fight a clean trend on divergence alone.
Want to practise spotting divergence before risking capital? Try it on a free Audacity trial account, or build the foundations first with the free Audacity Trader University.
Frequently Asked Questions
It is reliable as a sign of weakening momentum, but not as a standalone reversal signal. Its reliability improves significantly when combined with confirmation, such as a break of market structure, and when it forms at meaningful resistance levels.
The default 14-period setting is the most widely used and works well for most traders. Shorter settings make the RSI more sensitive and produce more signals, many of them noisy. Longer settings smooth the indicator but react more slowly.
Regular bearish divergence forms when price makes a higher high and the RSI makes a lower high, suggesting a possible reversal of an uptrend. Hidden bearish divergence forms when price makes a lower high and the RSI makes a higher high, suggesting a downtrend is likely to continue after a pullback.
Higher timeframes, such as the 4-hour and daily charts, generally produce more reliable signals. Lower timeframes generate more signals but with more noise. Many traders identify divergence on a higher timeframe and use a lower one to time the entry.
Yes, often. In strong trends, divergence can appear several times while price continues higher. That is why confirmation and a clearly defined stop loss above the second high are essential.
Yes. The concept applies to any liquid market where momentum can be measured, including indices, commodities such as gold and crude oil, and cryptocurrencies. The same rules on swing highs, confirmation and risk management apply.

Bereit, diszipliniertes Risiko auf Krypto anzuwenden? Entdecken Sie die neuen Krypto-Instrumente von Audacity Capital und bringen Sie Ihre Trading-Strategie mit.
Mehr erfahrenNewsletter
Treten Sie unserem Newsletter bei, um auf dem Laufenden zu bleiben.
Treten Sie unserer sozialen Gemeinschaft bei

Beginnen Sie Ihre Reise heute Mit unserer kostenlosen Testversion
Präsentieren Sie stolz Ihre Fähigkeiten und Leistungen durch Zertifikate und erhalten Sie Anerkennung für Ihre harte Arbeit und Ihr Engagement von potenziellen Investoren und Kollegen.
Kostenlose TestversionVerwandte Artikel

Risk of Ruin in Trading: Formula, Examples and How to Reduce It
Learn what risk of ruin in trading means, how the formula works, what affects it, and how position sizing can reduce the chance of account failure.


How to Stress-Test a Trading Strategy With Monte Carlo
Learn how Monte Carlo simulation reshuffles trades, estimates drawdown and losing-streak ranges, and tests a strategy beyond one backtest.
Sortino Ratio in Trading: How It Measures Downside Risk
Learn what the Sortino Ratio means, how to calculate it using downside deviation, and how traders use it to compare risk-adjusted performance.

Maximum Favorable Excursion: How MFE and MAE Read a Trade
Learn how Maximum Favorable Excursion and MAE reveal a trade's best and worst open moves, exit giveback, and possible entry or exit problems.