


Risk of Ruin in Trading: Formula, Examples and How to Reduce It


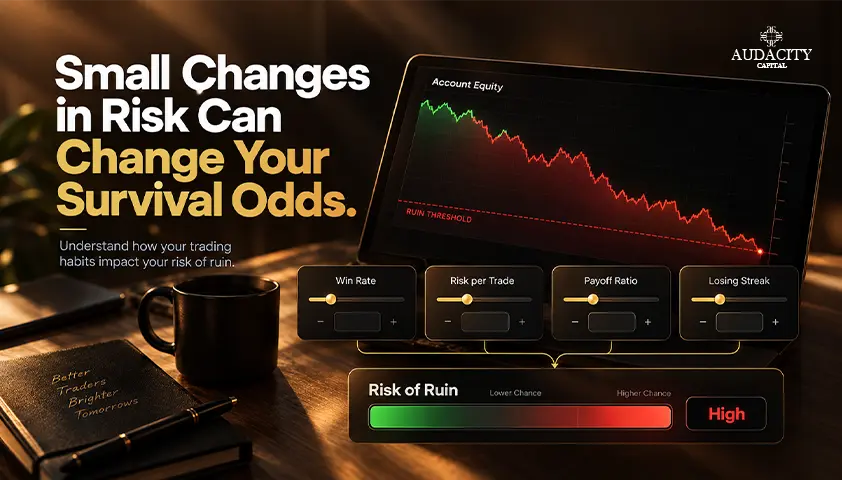
A strategy can have a genuine edge and still blow through its loss limit. Positive expectancy tells you what happens on average across many trades. But it says nothing about whether your account will still be standing when that average finally shows up.
If position size is too large, an ordinary losing streak can end the run before the edge has time to work.
That is the core question behind risk of ruin: can the account survive long enough for the edge to play out?
In trading, "ruin" is a pre-set level at which trading must stop. It might be zero, a personal drawdown threshold, a margin constraint, or a funded account loss limit.
This guide covers:
- what risk of ruin means,
- the inputs that drive it,
- the classical formula and its assumptions,
- a full worked example,
- how position sizing changes the result,
- how it differs from expectancy and drawdown,
- where the math breaks down,
- how funded-account rules change the problem,
- and how to test your own risk more realistically.
What Is Risk of Ruin in Trading?
Risk of ruin is the probability that an account reaches a defined loss boundary before a stated stopping condition, or ever, if no stopping condition is set.
The idea comes from gambling mathematics, where "gambler's ruin" described a player betting until their bankroll hit zero.
Trading borrowed the concept because the underlying problem is the same: a sequence of uncertain outcomes, a finite amount of capital, and a point beyond which you cannot continue.
The important difference is that traders rarely define ruin as zero. Most traders stop long before total bankruptcy, either because they choose to or because a rule forces them to.
A self-funded trader might decide that a 20% or 30% drawdown means the strategy is broken and trading must pause. A funded trader faces a harder line: the firm's maximum loss limit. Cross it, and the account ends regardless of how much balance technically remains.
This is why ruin must be defined before any calculation. The same strategy produces a very different trading risk of ruin depending on whether the boundary sits at zero or 10% below the starting balance.
Here is a simple illustration. A $50,000 account with a fixed floor at $45,000 does not have $50,000 of room to lose. It has a $5,000 capital buffer.
Every risk calculation should start from that buffer, not from the headline balance.
What Determines Risk of Ruin?
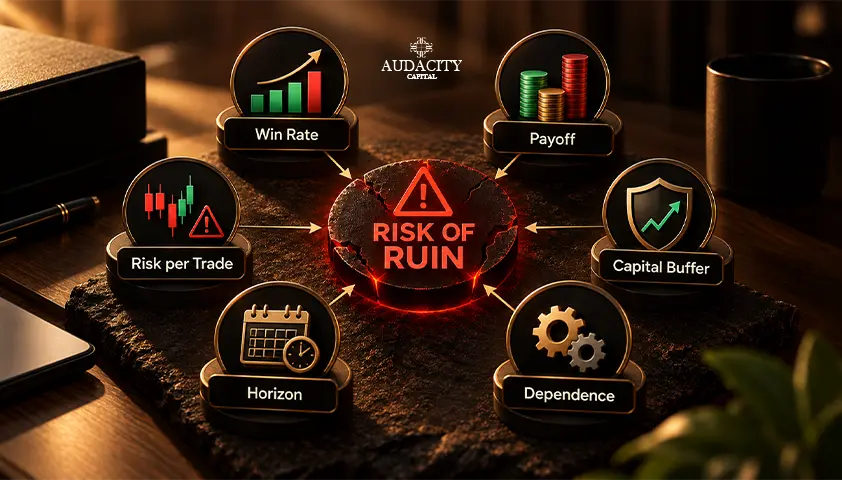
Many traders assume a high win rate keeps them safe. It does not. Risk of ruin comes from several inputs working together, and win rate is only one of them.
Win Rate
Win rate is the share of trades that close in profit. Its counterpart, the loss rate, is the share that close at a loss. A higher win rate generally lowers the chance of hitting the boundary, because losses arrive less often.
The catch is that win rate means little on its own. A 70% win rate paired with tiny winners and large losers can still drain an account. So can a strong win rate combined with oversized positions, because a few losses in a row can wipe out the buffer.
Reward-to-Risk or Payoff Ratio
The reward-to-risk ratio, also called the payoff ratio, compares the size of your average win to your average loss. A strategy that wins 2R for every 1R it loses can afford to be wrong more often than one that wins 1R for every 1R lost.
Payoff affects both expectancy and the path the account takes. Strategies with large, infrequent winners tend to produce longer losing streaks, which puts more pressure on the buffer even when the long-run average is positive.
Risk Per Trade
Risk per trade is the amount you stand to lose if a position hits its stop. It is the input you control most directly, every time you place an order.
Larger risk per trade means fewer losses fit between your current balance and the ruin boundary. If your buffer is $5,000 and you risk $1,000 per trade, five straight losses end the account. Risk $250 and it takes twenty.
Capital Buffer
The capital buffer is the distance between current equity and the chosen ruin point. Change the buffer and you change the trading risk of ruin, even if the strategy and position size stay exactly the same. A trader with a $10,000 buffer has twice the room of one with $5,000, which can reduce the modeled probability dramatically.
Trading Horizon
Classical formulas measure eventual ruin over an unlimited number of trades. Real traders usually care about something narrower: what is the chance of breaching the boundary over the next 50, 100 or 500 trades?
These are different questions with different answers. A finite horizon usually produces a lower breach probability than an unlimited one, because there is less time for a bad sequence to appear.
Trade Dependence and Correlation
Most simple models assume each trade is independent of the last. Live markets do not always cooperate. Losses can cluster when market conditions shift, and several open positions in related instruments can move together.
When that happens, real outcomes can be worse than a model built on independent trades suggests.
The Risk of Ruin Formula
The classical risk of ruin formula is elegant, but it only fits one specific situation. Before using it, it helps to know exactly what that situation is.
The model assumes:
- Trade outcomes are independent of one another.
- The win probability stays constant over time.
- Every trade wins or loses the same fixed monetary amount.
- The ruin boundary is fixed and does not move.
- There are no withdrawals or deposits.
- There is no profit target and no time limit, so the horizon is unlimited.
Under those conditions, the variables are defined as follows:
Symbol | Meaning |
p | Probability of a winning trade |
q | Probability of a losing trade, equal to 1 - p |
R | Fixed monetary gain or loss per trade |
N | Starting distance to the fixed loss boundary divided by R |
The formula for this simplified equal-payoff, fixed-floor, unlimited-horizon model is:
RoR = (q / p)^N, when p > 0.5
When p is 0.5 or lower, eventual ruin under this model is 100%. With no edge, or a negative one, and an unlimited number of trades, the account will eventually hit the floor.
Two things stand out. First, the ratio q / p captures your edge: the further p rises above 0.5, the smaller that ratio becomes. Second, N sits in the exponent, which means the number of risk units in your buffer has a powerful effect on the result.
This risk of ruin formula is a teaching tool, not a universal answer. Strategies with unequal win and loss sizes, percentage-based position sizing, trailing loss boundaries or finite challenge windows all break its assumptions.
Those cases need a different analytical model or a simulation. Any risk of ruin calculator built on this equation inherits the same limits.
Risk of Ruin Calculation Example
Here is one example calculation from start to finish.
Setup:
- Starting balance: $50,000
- Fixed ruin floor: $45,000
- Fixed win or loss per trade: $500
- Win rate (p): 56%
- Loss rate (q): 44%
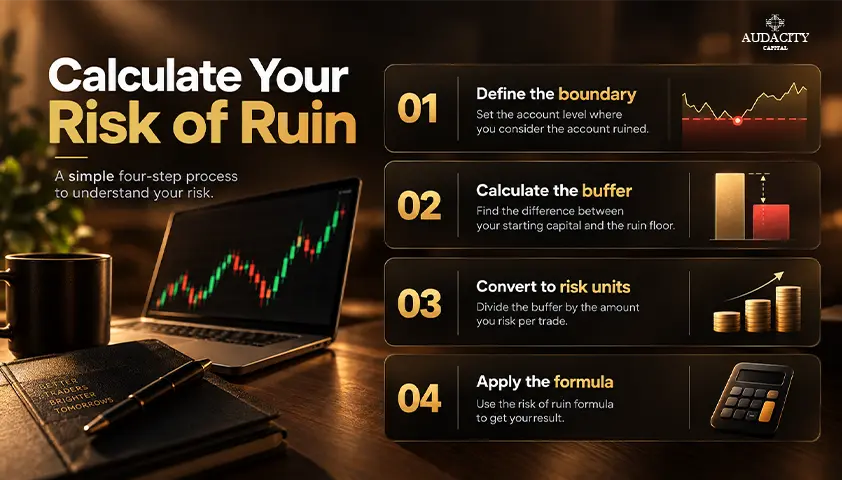
Step | Action | Result |
1 | Define the boundary | Ruin floor = $45,000 |
2 | Calculate the buffer | $50,000 - $45,000 = $5,000 |
3 | Convert to risk units | N = $5,000 / $500 = 10 |
4 | Apply the formula | RoR = (0.44 / 0.56)^10 ≈ 8.97% |
The ratio 0.44 / 0.56 is about 0.786. Raised to the 10th power, it comes to roughly 0.0897, or about 8.97%.
What does that number mean? Under the stated assumptions (independent trades, a constant 56% win rate, fixed $500 outcomes, a fixed floor and an unlimited horizon), a strategy like this one would eventually reach the $45,000 floor in roughly 9 out of 100 hypothetical runs.
What does it not mean? It is not a prediction that your specific account has an 8.97% chance of failing. Your real win rate may differ from 56%. Your wins and losses will not be exactly $500. Your trades may be correlated. The number is a model output that helps you compare choices, not a forecast of your future.
How Win Rate and Reward-to-Risk Affect Risk of Ruin
The equal-payoff formula only works when wins and losses are the same size. Most real strategies do not trade that way, so it helps to understand how win rate and payoff combine through trading expectancy.
Trading expectancy is the average result per trade, usually expressed in R, where 1R is the amount risked. If your average loss is 1R and your average win is bR, the breakeven win rate is:
Breakeven win rate = 1 / (1 + b)
With a 2R average win, breakeven is 1 / 3, or about 33.3%. With a 1.5R average win, it is 1 / 2.5, or 40%. With a 1R average win, it is 50%.
Win rate | Average win | Average loss | Expected result per trade |
35% | 2R | 1R | +0.05R |
40% | 1.5R | 1R | 0R |
50% | 1R | 1R | 0R |
55% | 1R | 1R | +0.10R |
The table shows why neither number works alone. A 35% win rate is profitable with 2R winners, while a 50% win rate is flat with 1R winners.
The 40% and 50% rows both break even despite very different win rates.
The 2R and 1.5R rows are here to teach expectancy only. The closed-form formula from the previous section does not apply to them, because their wins and losses are unequal.
Estimating ruin for those strategies requires a finite-horizon model or a Monte Carlo simulation.
Positive expectancy also does not automatically mean low risk of ruin. The 35% strategy above has a small edge and will produce long losing streaks. If it is traded with large size against a tight boundary, it can fail long before its +0.05R average has a chance to matter. Expectancy tells you whether a strategy is worth trading.
Position size and the loss boundary decide whether the account survives long enough to find out.
How Position Sizing Changes Risk of Ruin

Of every input in the model, position sizing is the one you can change today, on your next trade, without altering your strategy at all.
Reducing fixed monetary risk per trade increases the number of risk units between the account and the ruin floor. Because N sits in the exponent, the effect is far from linear.
Using the same example, with a 56% win rate and a $5,000 buffer:
Fixed risk per trade | Risk units (N) | Modeled eventual RoR |
$1,000 | 5 | ~29.94% |
$500 | 10 | ~8.97% |
$250 | 20 | ~0.80% |
$125 | 40 | ~0.0065% |
Note: Illustrative model only, based on the simplified equal-payoff, fixed-floor, unlimited-horizon formula. These are not recommended position sizes.
Halving risk from $500 to $250 does not halve the modeled risk of ruin. It cuts it from about 9% to under 1%. Same strategy, same edge, same boundary. The only change is how many losses the account can absorb.
There is a trade-off. Smaller positions mean smaller gains per trade, and in a time-limited evaluation, very small size can make a profit target harder to reach. Position sizing is about balancing survival against progress, not shrinking size indefinitely.
Fixed-Dollar vs Fixed-Percentage Risk
The table above uses fixed-dollar risk, where every trade risks the same amount regardless of account balance. Many traders use fixed-percentage risk instead, such as risking a set percentage of current equity.
With fixed-percentage sizing, the monetary stake shrinks after losses and grows after wins. That naturally slows the approach to the floor during drawdowns. It also means the simple formula no longer matches perfectly, because R is no longer constant.
When the floor is fixed in dollars and the stake scales with equity, the path to ruin changes, and simulation becomes the more reliable way to measure it.
Risk of Ruin vs Drawdown vs Trading Expectancy
These three metrics are often confused, but each answers a different question.
Metric | Question it answers | Main limitation |
Trading expectancy | What is the expected result per trade? | Does not show the path or chance of crossing a failure boundary. |
How far did equity fall from a peak in a sample? | Historical drawdown is not a probability, and future drawdown can be larger. | |
Risk of ruin | How likely is a defined loss boundary to be reached? | Depends heavily on model assumptions, sizing and the chosen boundary. |
Used together, they give a fuller picture. Expectancy tells you whether the strategy has an edge. Drawdown shows how rough the ride has been. Risk of ruin estimates whether the account is likely to survive the ride under your current sizing.
Why a Profitable Strategy Can Still Have a High Risk of Ruin
Positive expectancy describes the average outcome. It does not describe the order in which wins and losses arrive, and that order is what determines whether you hit the boundary.
Picture a strategy with a solid edge, traded with five risk units of buffer. If the first five trades happen to be losses, the account is finished. The strategy may have gone on to win the next twenty trades, but the account never gets there.
This is sequence risk: the average was favorable, and the path was fatal.
Losing streaks are normal in any strategy with a win rate below 100%. The tighter the buffer relative to position size, the shorter the streak needed to end the account.
Correlation makes this worse. Three open trades on closely related currency pairs or indices can behave like one position three times the size.
If they all hit their stops together, the account takes a single large loss rather than three independent small ones. Effective exposure is often higher than the per-trade risk suggests.
Live results also tend to drift from backtests. Market regimes shift. Spreads, commissions and slippage eat into small edges. Execution in real time is rarely as clean as historical data.
If your live win rate or payoff is even slightly worse than the backtest assumed, your real risk of ruin may be meaningfully higher than your calculation showed.
What Risk of Ruin Formulas Cannot Predict
Clean formulas are useful because they isolate the key relationships. They become misleading when traders treat them as exact descriptions of live trading. Here is what the classical model leaves out:
1. Daily loss limits that reset on a schedule and can end trading before the overall floor is reached.
2. Trailing drawdowns that move upward with balance or equity, shrinking the effective buffer after gains.
3. Profit targets and finite challenge deadlines, which add new stopping conditions.
4. Percentage-based position sizing, where the stake changes as equity changes.
5. Variable winners, partial exits and occasional losses larger than the planned stop.
6. Slippage, gaps, commissions and spread, which shift real outcomes away from planned ones.
7. Correlated trades and clustered losses that violate the independence assumption.
8. Win-rate and payoff estimates that change over time as markets evolve.
When your actual trading rules differ from the simple assumptions, a risk of ruin calculator based on the closed-form formula will give you a tidy number that may not reflect your real situation.
A Monte Carlo simulation is often the better tool in these cases. Instead of solving one equation, it generates thousands of randomized trade sequences using your estimated win rate, payoff distribution, position sizing and account rules.
You then count how many paths breach the boundary within your chosen horizon. Stress testing goes a step further by deliberately feeding the simulation worse assumptions than your backtest shows, so you can see how fragile or robust your sizing really is.
How Funded Account Rules Change Risk of Ruin
For funded traders, ruin is not a personal choice. The program rules define it. This changes the problem in several specific ways, so it helps to map each rule onto the risk model.
Audacity Capital is a proprietary trading firm, and traders on its programs operate within the rules of a simulated funded account, so the same logic applies there.
Maximum Loss Limit
In a funded or evaluation account, the ruin point is typically the maximum loss boundary, not zero. Your capital buffer is the distance between current equity and that limit.
A large account balance can still come with a relatively small buffer, which is why sizing should be based on the loss limit rather than the headline account size.
Daily Loss Limit
A daily loss limit adds a second boundary that operates on a shorter timescale. A trader can fail the account on a single bad day even with plenty of room left before the maximum loss limit.
This means position sizing has to respect both constraints: how many losses fit within the day, and how many fit within the overall buffer.
Static vs Trailing Drawdown
A static boundary stays fixed at one level, which makes it easier to model and closer to the classical formula's assumptions. A trailing boundary moves up as the account reaches new highs.
After a run of gains, the buffer may be no larger than it was at the start, so the risk of ruin does not fall as much as balance growth might suggest. Trailing structures almost always call for simulation rather than a closed-form estimate.
Read more about Static Drawdown vs Trailing Drawdown: Which Is Better?
Profit Targets and Evaluation Windows
A trading challenge adds another stopping condition: reach the profit target before hitting the loss boundary, and in some cases before a deadline. This is a different problem from infinite-horizon gambler's ruin.
The question becomes "what is the probability of reaching the target first?" rather than "what is the probability of ever hitting the floor?"
Rules vary between programs, so the boundaries that define ruin for an Ability Challenge, Ability One or FTP account should always be checked against the current program terms before you build any sizing plan around them.
How Traders Can Reduce Risk of Ruin
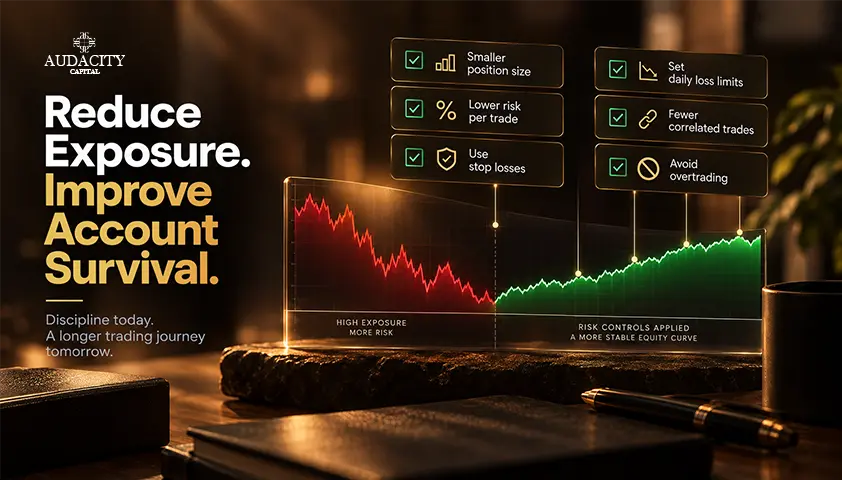
No method eliminates risk of ruin. The aim is to reduce it in ways that connect directly to the model's inputs.
1. Define the actual ruin boundary before sizing trades.
Identify every hard limit that applies to you, including personal thresholds, daily limits and maximum loss rules. Your buffer is measured from the nearest one.
2. Reduce risk per trade when the available capital buffer is small.
As the sensitivity table showed, more risk units can reduce modeled ruin sharply. A thin buffer calls for smaller position sizing.
3. Base win-rate and payoff assumptions on a meaningful sample after costs.
A handful of trades says little. Include spreads, commissions and realistic slippage in your figures.
4. Stress-test with worse numbers than your backtest shows.
Try a lower win rate, a smaller average win and occasional larger losses. If the account only survives under ideal assumptions, the sizing is too aggressive.
5. Account for overlapping and correlated positions.
Treat related trades as combined exposure. If three positions tend to move together, size them as if they were one.
6. Use Monte Carlo or other path-based testing when rules are complex.
Trailing drawdowns, daily limits, profit targets and variable payoffs all justify simulation over a single formula.
7. Recalculate as live results or account rules change.
Your edge is not fixed. Neither is your buffer. Revisit the numbers regularly, especially after a drawdown or a change in program.
Conclusion
Risk of ruin is a decision framework, not just a formula. Before committing to any position size, work through four questions:
Where is the failure boundary? Define it precisely, whether it is a personal threshold or a funded account loss limit.
What is the edge, realistically? Estimate winrate and payoff from a meaningful sample after costs, then assume live results may come in slightly worse.
How much room do you really have? Size every trade against the available capital buffer, not the account balance.
Can the account survive realistic adverse paths? Test your sizing against losing streaks, correlated losses and tougher assumptions, using simulation where the rules are complex.
Traders who answer these questions before they trade give their edge the time it needs to show up. Those who skip them often learn about sequence risk the hard way.
Keep the limits in view, too. Risk of ruin is a probability model built on assumptions. A low number does not guarantee survival, and a high number does not mean failure is certain.
It is a tool for making better sizing decisions, not a forecast of what will happen to any individual account.
Frequently Asked Questions
Risk of ruin is the probability that a trading account reaches a defined loss boundary, such as zero, a personal drawdown threshold or a funded account loss limit. It estimates whether an account can survive adverse trade sequences long enough for a strategy's edge to play out. The result depends on the assumptions used, so it is a model rather than a prediction.
In the simplified case where every trade wins or loses the same fixed amount, the formula is RoR = (q / p)^N, where p is the win probability, q is the loss probability and N is the number of risk units between current equity and the ruin floor. This only applies when p is above 0.5 and the horizon is unlimited. For unequal payoffs, percentage-based sizing or complex account rules, a Monte Carlo simulation is usually more appropriate.
There is no universal threshold that suits every trader. An acceptable level depends on your goals, the consequences of hitting the boundary and how confident you are in your win-rate and payoff estimates. Many traders prefer to keep modeled risk low and then stress-test it with worse assumptions, since real results can differ from the model.
In practice, no. Under the classical formula, the modeled value approaches zero as the number of risk units grows, but it never quite reaches it. Live trading also introduces gaps, slippage, correlation and changing market conditions that no model fully captures, so some risk always remains.
Not on its own. A high win rate can still lead to ruin if average losses are much larger than average wins or if position sizes are too large for the available buffer. Win rate, payoff ratio and risk per trade need to be evaluated together.
Position size determines how many losses fit between your current equity and the ruin boundary. Smaller risk per trade creates more risk units, which can lower modeled risk of ruin sharply because that number sits in the exponent of the formula. The trade-off is slower progress, which matters when a profit target or time limit applies.
Yes. Positive trading expectancy describes the average result, not the order in which wins and losses arrive. If positions are large relative to the buffer, a normal losing streak can reach the boundary before enough winners occur to recover.
Maximum drawdown measures the largest historical decline from an equity peak in a given sample. Risk of ruin estimates the probability of reaching a defined loss boundary under a set of assumptions. Drawdown looks backward at what did happen, while risk of ruin models what could happen, and future drawdowns can exceed historical ones.
A risk of ruin calculator can help you compare position sizes and understand how vulnerable your account may be, but it cannot predict whether a specific account will breach its rules. Most calculators use simplified assumptions that do not reflect daily loss limits, trailing drawdowns, profit targets or evaluation windows. Simulations that include the actual program rules give a more relevant estimate, though still not a guarantee.

Bereit, diszipliniertes Risiko auf Krypto anzuwenden? Entdecken Sie die neuen Krypto-Instrumente von Audacity Capital und bringen Sie Ihre Trading-Strategie mit.
Mehr erfahrenNewsletter
Treten Sie unserem Newsletter bei, um auf dem Laufenden zu bleiben.
Treten Sie unserer sozialen Gemeinschaft bei

Beginnen Sie Ihre Reise heute Mit unserer kostenlosen Testversion
Präsentieren Sie stolz Ihre Fähigkeiten und Leistungen durch Zertifikate und erhalten Sie Anerkennung für Ihre harte Arbeit und Ihr Engagement von potenziellen Investoren und Kollegen.
Kostenlose TestversionVerwandte Artikel
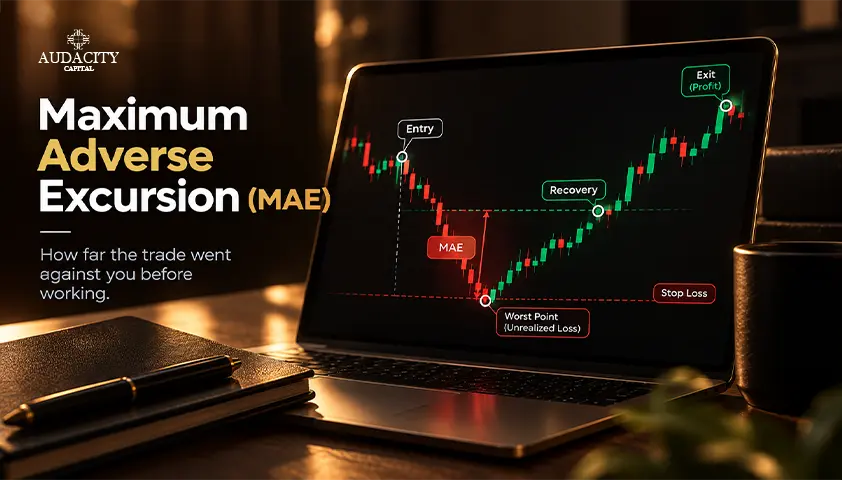
Maximum Adverse Excursion Explained for Traders
Learn how maximum adverse excursion measures a trade's worst open loss, how to calculate MAE, read charts, test stops, and avoid common errors.

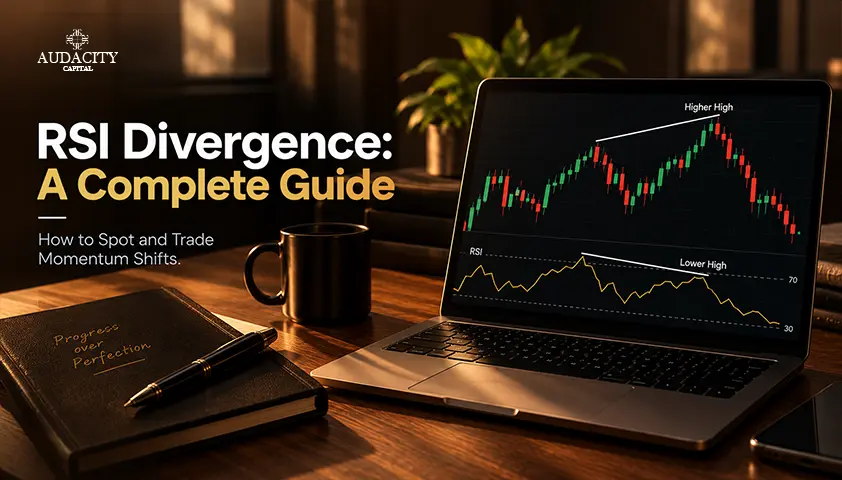
RSI Divergence: A Complete Guide to Spotting and Trading Momentum Shifts
Learn what RSI divergence is, explore bullish, bearish and hidden divergence, and discover how to identify, confirm and trade RSI divergence.

Market Profile Trading: How to Read TPO Charts
Learn Market Profile Trading with TPO charts, value area, POC, initial balance, day types, practical examples, and risk controls.
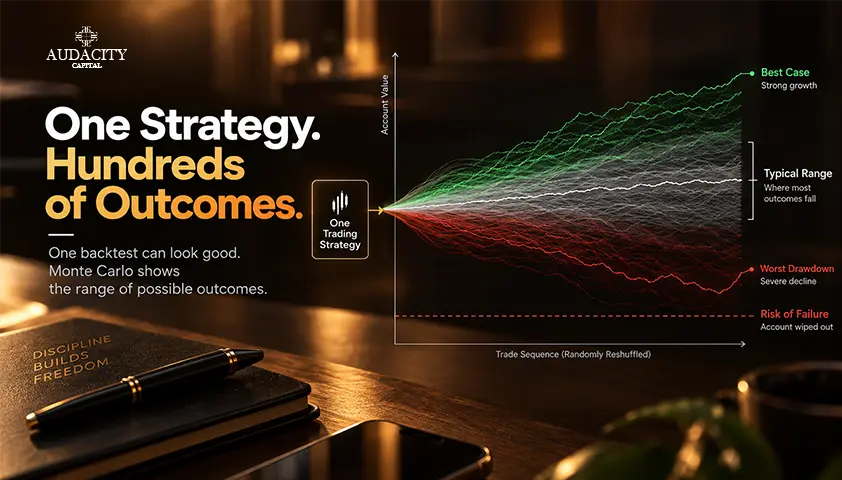
How to Stress-Test a Trading Strategy With Monte Carlo
Learn how Monte Carlo simulation reshuffles trades, estimates drawdown and losing-streak ranges, and tests a strategy beyond one backtest.