


Stochastic Oscillator vs RSI: How They Differ and How to Use Them


Introduction
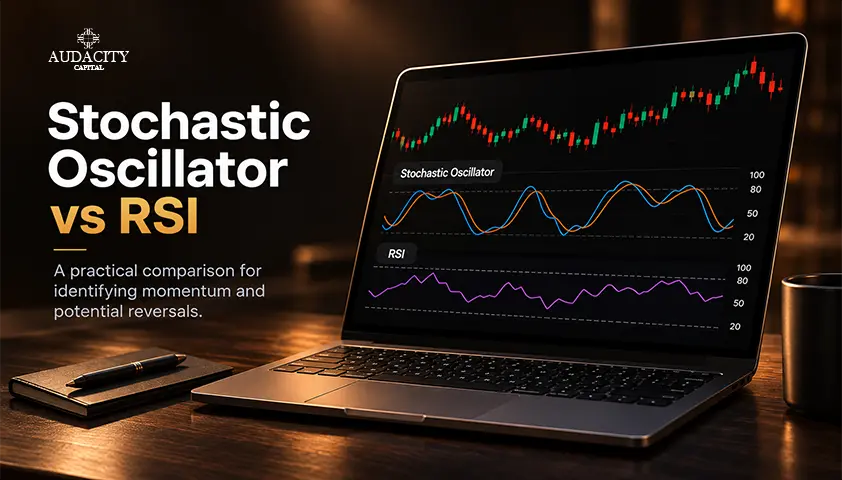
The Stochastic Oscillator vs RSI comparison helps traders understand how these two popular momentum indicators identify potential overbought and oversold conditions. Although both use a scale of 0 to 100, they measure price momentum differently.
The Stochastic Oscillator compares an asset's closing price with its high-low range over a specific period. In contrast, the Relative Strength Index (RSI) measures the speed and magnitude of recent price changes by comparing average gains and losses.
These differences can produce different trading signals depending on market conditions and indicator settings. However, neither indicator guarantees a price reversal, and both can generate misleading signals.
Understanding how they work can help you decide which indicator better suits your trading strategy. In this guide, we'll compare their formulas, settings, signals and practical applications, while also explaining how Stochastic RSI differs from the regular Stochastic Oscillator.
What Is the Stochastic Oscillator?
The Stochastic Oscillator is used to determine how the closing price relates to the highest high and lowest low over a specified period of time. As a result, it can help traders determine price momentum and identify entry points. The indicator contains two lines: one being %K, which shows how far the closing price has moved from the most recent range, and %D, which is a moving average of %K.
Typically, the overbought and oversold levels are set at 80 and 20. If the reading goes over 80, then we know the price is at the higher end of the most recent range. Below 20 means the price is at the lowest point in the most recent range. This doesn’t mean that a reversal will happen because prices can stay in overbought or oversold conditions during strong trends.
Common Stochastic Oscillator Settings
A common oscillator setting is 14, 3, 3. This means that the oscillator will have a 14-period lookback and smoothed-out %K and %D lines. Traders may wish to change these settings depending on what they are looking for and how long they are trading for.
Fast settings will make the oscillator react quicker to price movements but can cause more false signals. Slow settings will smooth out any volatility but may cause delayed signals. The Slow Stochastic Oscillator(Link to the Slow Stochastic Oscillator article) uses smoothing to reduce sensitivity to short-term price fluctuations.
What Traders Use It For
The Stochastic Oscillator is used by traders to identify momentum changes, potential trade setup opportunities, and divergence. Crossovers between %K and %D lines can be used to identify changes in short-term momentum.
For example, a bullish crossover below 20 could indicate increasing upward momentum. A bearish crossover above 80 could indicate declining momentum. However, generally, they will be used in conjunction with support/resistance levels, trends, and price action.
What Is the Relative Strength Index (RSI)?
Relative Strength Index (RSI) is a momentum oscillator used by traders to measure the speed and magnitude of recent price movements. Just like the stochastic oscillator, RSI also has a range between 0 and 100.RSI measures the ratio between average gains and losses over a certain period. This can be converted into a number between 0 and 100.
Generally, the higher the value, the stronger the bullish momentum, and the lower the value, the stronger the bearish momentum. Unlike the Stochastic Oscillator, the RSI does not compare the closing price of an asset to its recent high-low range but compares the ratio of recent gains and losses.
Common RSI Settings and Levels
The default setting for the RSI is 14 periods. This means that the indicator will look back at the last 14 candles on your chart. Traders can change this value. The lower the value, the more sensitive the RSI becomes. Using a higher value will generally smooth out the RSI.
The default overbought and oversold levels are 70 and 30. If the RSI is above 70, it may be indicating that there is strong bullish momentum. If it is below 30, it may be indicating that there is strong bearish momentum. Some traders will change these levels depending on what they are trading, market conditions, or strategy.
How Traders Use RSI
Traders can use RSI to determine the strength of momentum, identify possible reversals and divergences. For example, if the price is making higher highs but RSI is forming lower highs, this could be an indication that momentum is slowing.
In ranging markets, RSI can be useful to identify any possible turning points as it will often be near 70 or 30. However, during strong trends, RSI can be overbought/oversold for long periods.
Stochastic Oscillator vs RSI: Key Differences
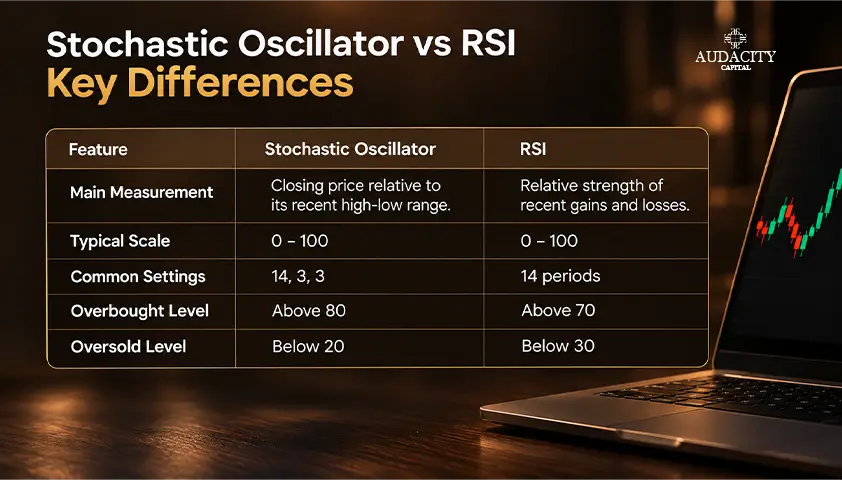
The main difference between the Stochastic Oscillator and the Relative Strength Index (RSI) lies in how they measure momentum. Although both range from 0 to 100, they use different calculations and can produce different signals on the same price chart.
Difference in Calculation
The Stochastic Oscillator compares the closing price of the market to the high and low over the chosen period. This shows how near the close is to the high or low. RSI, on the other hand, compares the average gain and average loss over the chosen period. If the average gain is higher than the average loss, then the RSI will generally rise. Conversely, if the average loss is higher than the average gain, then the RSI will generally fall.
This difference can cause the two indicators to give conflicting results. The market could be closing near the high of the recent range when the average gain has not been particularly large recently. Alternatively, the RSI can remain high due to a recent positive trend, but the most recent close is not near the high of the range.
Difference in Signal Sensitivity
The Stochastic Oscillator provides quick signals when the closing price is moving within its recent range. It has 2 lines (%K & %D), which can produce crossing signals that can be helpful when identifying short-term changes in momentum.
RSI measures the ratio of recent gains and losses, so it will respond based on the volatility and magnitude of price movements. The sensitivity will vary depending on the period used. Neither one will always be quicker or more reliable. It mostly depends on the price movement, settings, and time frame.
Difference in Trading Signals
When comparing RSI vs. Stochastic Oscillator, traders should consider how each indicator generates signals. The Stochastic Oscillator gives signals when there is a crossover. This can indicate that there has been a change in momentum. RSI shows when the momentum is above 70 or below 30, which can indicate there is very strong momentum in one direction.
Both can be used to show divergences. But this does not guarantee that there will be a reversal. To improve your analysis, you can check if there is a trend in the direction of the price, if there are any support and resistance levels, and look at the price action.
Feature | Stochastic Oscillator | RSI |
Main Measurement | Closing price relative to its recent high-low range. | Relative strength of recent gains and losses. |
Typical Scale | 0–100 | 0–100 |
Common Settings | 14, 3, 3 | 14 periods |
Overbought level | Above 80 | Above 70 |
Oversold Level | Below 20 | Below 30 |
Common Signals | %K/%D crossovers, threshold exits, divergences. | Threshold changes, divergences, failure swings. |
Potential Advantage | Shows where the close sits within its recent range. | Assesses the balance between upward and downward momentum. |
Potential Limitation | Can generate frequent signals in choppy markets. | Can remain overbought or oversold during strong trends. |
Stochastic Oscillator vs RSI Trading Signals
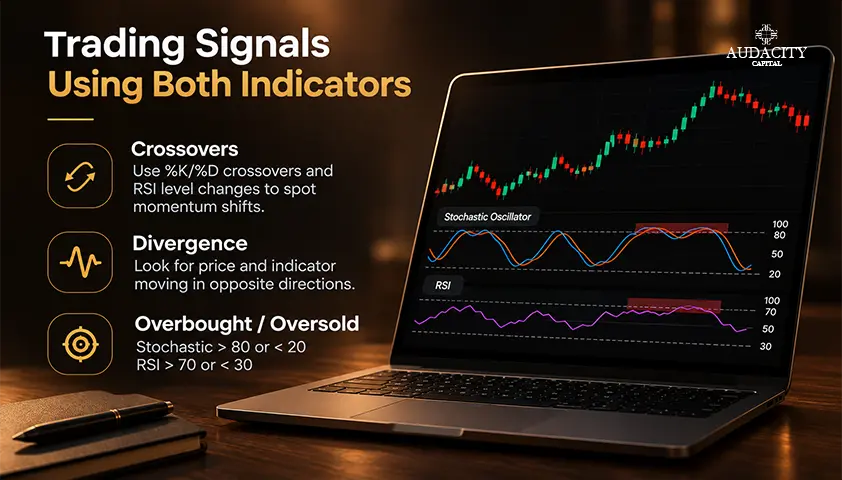
These are some of the trading signals you can use when using both of these trading indicators:
Identifying Overbought and Oversold Conditions
The stochastic oscillator and RSI can be used to determine overbought and oversold conditions. However, depending on the situation, one indicator could be overbought; that is, stochastic > 80 and the other not, i.e., RSI < 70.
This could be because the currency pair has closed near the high of its recent range, causing the Stochastic to enter overbought territory, but the RSI has not entered overbought territory because there hasn’t been as much recent positive momentum.
Alternatively, the Stochastic could enter oversold territory (< 20) before the RSI enters oversold territory (< 30). This can help traders see momentum from both sides but does not guarantee a reversal.
Understanding Bullish and Bearish Divergence
A divergence is when price and indicator move in opposite directions. When price creates a lower low but the indicator creates a higher low, this is known as bullish divergence. This can indicate that selling pressure is losing strength. Bearish divergence occurs when price creates a higher high, but the indicator creates a lower high. This can indicate buying momentum is losing strength. Traders should know that both indicators can show this pattern; however, there may not be any reversal.
Using Crossovers to Assess Momentum
The Stochastic Oscillator can produce crossovers when the %K and %D lines cross. Bullish crossovers can indicate strengthening momentum, and bearish crossovers can indicate a loss of momentum. The signals are often watched around the 20 and 80 levels.
The RSI cannot produce crossovers of two lines in its basic form. Traders may watch the momentum by looking at price moving above and below the 30 and 70 levels, as well as looking for changes in momentum and divergences.
A Practical Trading Scenario
Assume that EUR/USD is in an uptrend and pulls back towards support. The Stochastic Oscillator falls below 20, and the RSI starts to approach 35. This means that the price is at the low end of the recent range and there is weakening bullish momentum.
If the Stochastic lines then cross over in a bullish manner and the RSI starts to rise, this may indicate that the pullback is losing momentum. However, we want to see confirmation from the price as well. Perhaps a bullish candle or a breakout above the short-term swing high.
Stochastic RSI vs Stochastic Oscillator: What Is the Difference?
What Is Stochastic RSI?
The Stochastic Relative Strength Index (Stochastic RSI or Stoch RSI) is a momentum indicator that applies the Stochastic calculation to RSI values rather than directly to price data. This indicator shows how far the current RSI value is between its highest and lowest values during a given period.
When shown as a percentage, the Stochastic RSI, like the standard Stochastic Oscillator, will range between 0 and 100. Levels of 80 and above are often used to indicate potential overbought conditions, and levels below 20 to indicate potential oversold conditions.
How the Two Indicators Differ
The main difference in Stochastic Oscillator vs Stochastic RSI is the data each indicator uses. The standard Stochastic Oscillator uses the closing price against the most recent range of the high and low values. The Stochastic RSI, on the other hand, uses the RSI value against its most recent range.
This makes the Stochastic RSI react faster to changes in the RSI value, producing more frequent signals. The standard Stochastic Oscillator reacts to changes in the closing price against the most recent range. Remember, both can generate false signals, especially in a choppy market.
Stochastic RSI vs Stochastic Oscillator in Practice
When comparing Stochastic RSI vs Stochastic Oscillator, traders should consider how each behaves in different market conditions. The Stochastic RSI provides traders with a way to identify short-term momentum changes due to it being an additional calculation on top of an existing momentum indicator. However, this can also result in false signals.
The standard Stochastic Oscillator gives traders a clearer indication of where the closing price is within its recent range. If traders are looking to identify the position of price, they may prefer this indicator. Both indicators will not always give better signals, as it largely depends on the asset, time frame, settings, and strategy you are using.
Which One Should Traders Choose?
The indicator you choose depends on your trading goals and how much noise you are willing to ignore. If you want more momentum signals, using Stochastic RSI may be best for you. However, if you want to see where the close is in relation to the recent range, then using the standard Stochastic Oscillator may be better for you.
It is also important to understand the difference between the three indicators. RSI shows you the average gain/loss ratio. The Stochastic Oscillator shows you where the close is in relation to the recent range. And the Stochastic RSI applies the Stochastic formula to the RSI values. Whatever settings you choose, it is best to test them and ensure that you are using price action and risk management to confirm your signals.
Which Indicator Is Better for Different Trading Styles?
The choice of using either the Stochastic Oscillator or RSI will depend on your trading style, timeframe, and market conditions. Both indicators provide a different view of the momentum.
Day Trading
Day traders are often looking to gauge short-term momentum while looking for entry points. Using the Stochastic Oscillator can be helpful to see when momentum is changing by looking at the %K and %D crossing over. RSI can also be used to see if there are signs of momentum increasing in either direction. Stochastic RSI can be used to give more frequent signals but can also cause more noise in the market. The signals should be used alongside price action and risk management rules.
Read more about Day Trading
Swing Trading
Swing traders hold a position for several days/weeks, looking to profit from larger moves in the market. RSI can be used to gauge momentum of the pullback. The Stochastic oscillator can also be used to see when price positioning has changed within the recent range. For example, during an uptrend, a pullback towards support accompanied by improving momentum may indicate a potential opportunity.
Read more about Swing Trading
Trend-Following Strategies
Traders using trend-following strategies should not assume overbought/oversold levels are reversal signals. In a strong uptrend, RSI may remain above 70, and the Stochastic Oscillator will enter overbought territory regularly. However, traders can use these indicators to determine momentum as well as overall trend. These momentum indicators can also be used alongside moving averages and price structure for better opportunities. A strong reading can indicate that there is strong momentum present.
Range-Bound Markets
A ranging market is where the price is moving between fairly well-known support and resistance levels. These indicators can be used to look for potential reversal points. If your Stochastic or RSI drops below 20/30, respectively, and this occurs at a support level, it could indicate an upcoming reversal. But it is recommended to use price action for confirmation before you get into a position.
Ultimately, neither indicator is universally better. It depends on your strategy, market conditions, and how well you can read the signals from each indicator in relation to your trading plan.
Can You Use the Stochastic Oscillator and RSI Together?
Yes, traders can use both the Stochastic Oscillator and RSI as they provide momentum data from different angles. However, this does not necessarily make predictions more accurate, as they both derive information from price data.
How the Indicators Can Complement Each Other
The Stochastic Oscillator tells us how far away the closing price is from its range of highest and lowest prices recently, while RSI tells us about average gains and losses. By using both, we can see if we have a similar picture regarding the price.
For example, if the Stochastic Oscillator is showing a bullish crossover and RSI is starting to pick up from a lower level, this could indicate increasing bullish momentum. But still, you would need further confirmation to take entries.
Example of Combined Confirmation
Suppose EUR/USD falls towards a previously established support level during a broader uptrend. The Stochastic Oscillator drops below 20, while RSI approaches 30. Shortly afterwards, the Stochastic lines form a bullish crossover, and RSI begins moving higher.
These developments may indicate that selling pressure is weakening. However, a trader could wait for additional evidence, such as a bullish candlestick pattern or a break above a recent short-term high, before considering an entry.
Pros and Cons of the Stochastic Oscillator and RSI
Both the Stochastic Oscillator and RSI are good indicators for reading market momentum; however, both have flaws. Knowing each one's strengths and weaknesses can help guide a trader towards an indicator which will work best within their strategy and trading conditions.
Pros and Cons of the Stochastic Oscillator
Pros:
- Identifies potential turning points: Overbought and oversold readings can help traders assess possible reversals.
- Provides crossover signals: The %K and %D lines can highlight short-term momentum changes.
- Useful in ranging markets: It can help traders assess price movements near support and resistance.
Cons:
- Frequent false signals: Rapid fluctuations can generate misleading crossovers, particularly in choppy markets.
- Limited reversal certainty: Overbought and oversold readings do not guarantee that price will reverse.
- Trend sensitivity: The indicator can remain in extreme zones during strong directional moves.
Pros and Cons of RSI
Pros:
- Measures momentum strength: RSI helps traders assess the balance between recent gains and losses.
- Identifies potential divergences: Divergences may reveal weakening momentum before a possible price reversal.
- Versatile application: Traders can use RSI across different assets, timeframes, and trading strategies.
Cons:
- Persistent extreme readings: RSI can remain overbought or oversold during strong trends.
- Potentially misleading signals: Divergences and threshold crossings do not guarantee changes in price direction.
- Lagging behavior: Because RSI uses historical price changes, its signals may appear after momentum has already shifted.
Conclusion
The Stochastic Oscillator vs RSI comparison highlights two different ways to assess market momentum. The Stochastic Oscillator and RSI are two completely different indicators. The Stochastic Oscillator can tell you where the closing price sits relative to its recent highs and lows, while the RSI will show you the relationship between average positive and negative movement. Both can give you an idea of overbought and oversold levels, but there could be variation between them.
The Stochastic Oscillator could be useful for traders looking to trade short-term momentum changes using crossovers. While the RSI can be used to determine how strong recent price movements have been. Neither indicator is superior to the other.
You can use both indicators together to provide more insight into your trade. However, there is no guarantee that they will agree. The best approach is to pick settings that will work well with your strategy. Also ensure that you are confirming with price action and market structure, and remember to utilize good risk management.
FAQs
The Stochastic Oscillator compares closing prices with their recent range, while RSI measures average gains against average losses.
Neither is universally better. The choice depends on your trading strategy and market conditions.
Both can be useful. The Stochastic Oscillator offers crossover signals, while RSI helps assess momentum strength.
Stochastic RSI applies the Stochastic calculation to RSI values, while the Stochastic Oscillator uses price data.
Yes. Combining them can provide different momentum insights, but neither guarantees accurate trading signals.

Bereit, diszipliniertes Risiko auf Krypto anzuwenden? Entdecken Sie die neuen Krypto-Instrumente von Audacity Capital und bringen Sie Ihre Trading-Strategie mit.
Mehr erfahrenNewsletter
Treten Sie unserem Newsletter bei, um auf dem Laufenden zu bleiben.
Treten Sie unserer sozialen Gemeinschaft bei

Beginnen Sie Ihre Reise heute Mit unserer kostenlosen Testversion
Präsentieren Sie stolz Ihre Fähigkeiten und Leistungen durch Zertifikate und erhalten Sie Anerkennung für Ihre harte Arbeit und Ihr Engagement von potenziellen Investoren und Kollegen.
Kostenlose TestversionVerwandte Artikel
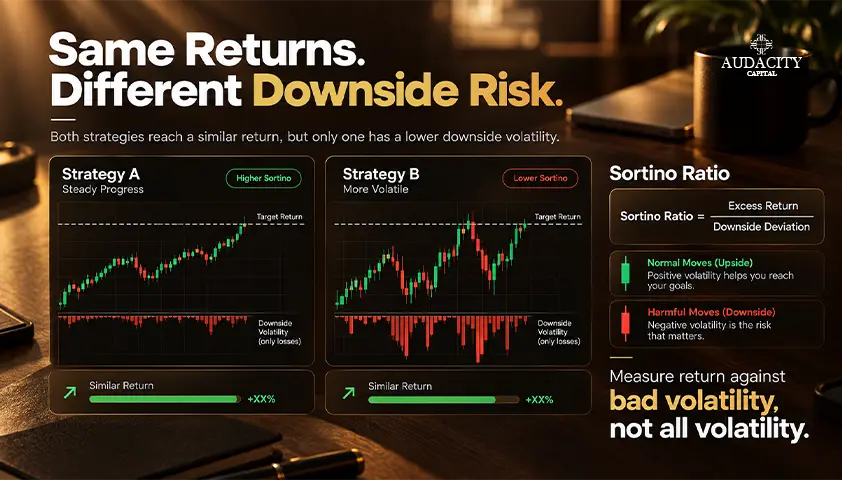
Sortino Ratio in Trading: How It Measures Downside Risk
Learn what the Sortino Ratio means, how to calculate it using downside deviation, and how traders use it to compare risk-adjusted performance.

Maximum Favorable Excursion: How MFE and MAE Read a Trade
Learn how Maximum Favorable Excursion and MAE reveal a trade's best and worst open moves, exit giveback, and possible entry or exit problems.
What Is the Slow Stochastic Oscillator? Formula, Signals and Strategies
Learn how the Slow Stochastic Oscillator works, understand its formula and signals, and explore trading strategies and risk management.

Swap in Trading: What It Is, How It Is Calculated and How It Affects Your Positions
Learn what a swap in trading is, how overnight fees are calculated, when triple swaps apply, and how swap costs affect forex and CFD positions.