


Maximum Adverse Excursion Explained for Traders



Both trades end up earning you $300 in profit. The first is profitable right from the beginning. The second starts off with a big loss but recovers eventually.
Your profit-and-loss history views both as the same. Maximum adverse excursion (MAE) shows the extent to which each trade moves against you before exiting.
This guide includes a definition, long and short formulas, worked examples, related metrics, chart reading and a tracking checklist. Past performance does not guarantee future results and trading is subject to risk of loss.
What Is Maximum Adverse Excursion
Maximum adverse excursion (MAE) is the maximum amount of adverse movement that occurs between entry and exit in a trade.
For a long position, it uses the lowest eligible price while the trade is open. This is known as intratrade low. In a short position, it is the highest price that can be attained, which is the intratrade high.
MAE in trading answers one question: how far did this position move against the entry before it closed?
The traders are often surprised by the answer. A successful trade may have a high MAE. If a trade is closed soon after it has drifted against the entry, it may have a small MAE.
In some cases, a trade that does not drift against the entry has an MAE value of zero under a zero-floor convention.
John Sweeney developed and formalized MAE analysis, and his 1997 Wiley book focuses on price excursion, stop analysis, volatility and trading management.
There's one boundary that is important from the beginning. MAE is not the amount you actually lost. It is the maximum loss from an open position (adverse price movement) based on the convention selected. The actual outcome is the one that the exit has produced.
Maximum Adverse Excursion Formula
Use a sign convention before any numbers. In this article MAE is a nonnegative measure. A higher number indicates a more adverse excursion.
Certain platforms will display the adverse change as a negative value. Compare values according to the convention of the platform you are using.
Long Trade Formula
For a long trade with a fixed size:
Price MAE = Entry price - Lowest eligible price (when open)
MAE = 0 when the lowest price is never less than the entry price.
Short Trade Formula
For a fixed-size short trade:
Price MAE = Highest eligible price while open minus the entry price
MAE is zero when the maximum price does not exceed entry.
Converting MAE Into Useful Units
The following are four common formats for reporting the same adverse excursion:
- Price distance: the raw move, stated in dollars, points, ticks or pips depending on the instrument.
- Account currency: Price MAE multiplied by position quantity and, if necessary, the instrument's point value. This is important in futures and for many CFD products.
- Percentage: price MAE divided by the entry price.
- R-Multiple: the adverse distance or currency loss divided by the initial planned risk, in the same units. For example, if you planned on risking $2.00 per share and price MAE was $1.00, then MAE = 0.50 R
The unit and sign convention should be quoted next to each value reported.
Format | Calculation | Best use | Main caution |
Price distance | Entry to worst eligible price | Review one instrument | Points, ticks and pips are not interchangeable |
Account currency | Price MAE times quantity and point value | Estimate open loss for a fixed position | Exposure may change due to scaling and fees |
Percentage | Price MAE divided by entry price | Compare similar securities | Leverage and volatility remain hidden |
R-multiple | Currency MAE divided by initial planned risk | Compare trades with the same risk model | Any initial risk should be documented prior to entry |
How to Calculate MAE With Long and Short Examples
Let's look at how to work out the maximum adverse excursion for two fixed-sized trades. All prices and outcomes are hypothetical.
Long example: You buy 100 shares at 50.00. While the trade is open, the lowest eligible price is 48.80. You exit at 53.00.
- Price MAE: 50.00 − 48.80 = 1.20
- Percentage MAE: 1.20 ÷ 50.00 = 2.4%
- Currency MAE: 1.20 × 100 shares = $120 before costs
- MAE in R: With an initial risk of $2.00 per share, MAE = 0.60R.
Short example: You sell short 50 shares at 75.00. The highest eligible price while the trade is open is 76.50. You exit at 72.00.
- Price MAE: 76.50 − 75.00 = 1.50
- Percentage MAE: 1.50 ÷ 75.00 = 2.0%
- Currency MAE: 1.50 × 50 shares = $75 before costs
- MAE in R: With an initial risk of $2.50 per share, MAE = 0.60R.
Item | Long trade | Short trade |
Entry | 50.00 | 75.00 |
Worst price while open | 48.80 low | 76.50 high |
Exit | 53.00 | 72.00 |
Price MAE | 1.20 | 1.50 |
Percentage MAE | 2.4% | 2.0% |
Position size | 100 shares | 50 shares |
Currency MAE | $120 | $75 |
MAE in R | 0.60R | 0.60R |
Both trades have been profitable, but each has been trading in a direction opposite to the initial entry, and only MAE shows that section of the trade.
The figures do not include commissions, spread, slippage and financing. The result can vary if your journal is based on running P or L instead of price excursion.
MAE vs MFE, Maximum Drawdown and Realized Loss
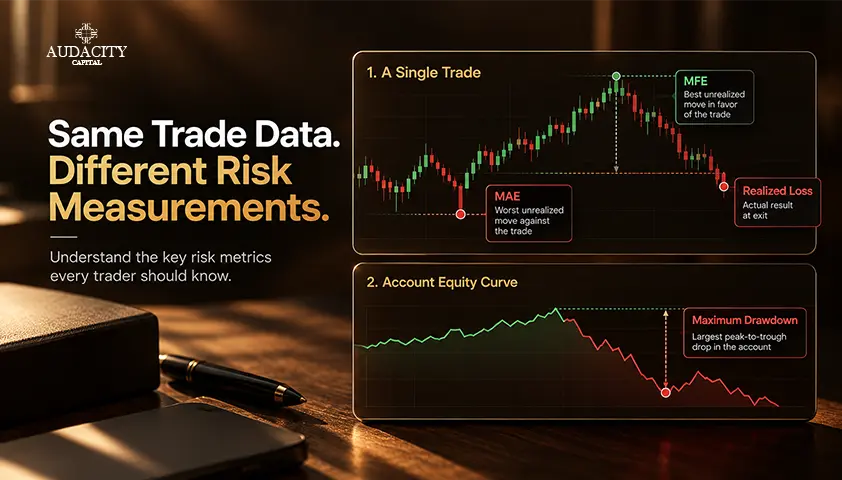
Are MAE and drawdown the same thing? No. These are two different statistics that answer different questions, confusing them will lead to misleading results.
Maximum favorable excursion (MFE) is the best open excursion in your favor. The worst open movement against you is the MAE. Realized profit or loss records the outcome at exit.
Maximum drawdown measures how far an account, portfolio or strategy fell from an equity peak to a later trough.
Metric | Reference points | Scope | Question answered |
MAE | Entry to worst open point | One trade | How far did it move against entry? |
MFE | Entry to best open point | One trade | How far did it move in favor? |
Realized P and L | Entry and executed exit | One trade | What result was booked? |
Maximum drawdown | Equity peak to later trough | Account, portfolio or strategy | Which was the deepest drop in history? |
How Traders Use Maximum Adverse Excursion
One MAE value does not provide much information. The significance of this MAE trading indicator is that it allows you to look at a group of similar trades and to formulate turning patterns into testable questions.
1. Reviewing Entry Quality
Group trades by setup and determine if certain variations go longer against the entry. This is a research question concerning timing, not proof that the entry was incorrect.
2. Investigating Stop Placement
Separate the study of winning and losing trades. Compare their MAE distributions; percentiles give more information than one average. They demonstrate how far winning trades typically move against entry before becoming profitable.
A candidate stop-loss distance should reduce adverse exposure without excluding too many profitable trades. Examine if the change has a positive effect on the strategy's overall outcomes post-cost.
The trades that do not make it through the stop changes will be different, so redo the backtest at the original price path.
3. Checking Position Risk
Change MAE to account currency or R to determine if open risk was greater than planned. Avoid using MAE alone to set position size, as the direction of the next trade is unknown when entering the position.
4. Segmenting the Sample
Separate trades by strategy, side, market, session, holding period and volatility regime. Combined averages can mask the differences in the behavior of one group versus another.
5. Pairing MAE and MFE
Analyze MAE and MFE in conjunction with the actual exit. A very low MAE paired with good MFE could be a strong signal for an entry-level question.
Very weak realized results with high MFE could indicate an exit-management question. Both measures do not show that a rule change will enhance future outcomes.
6. Validating Any Change
Freeze the new rule, add costs and conduct an out-of-sample test using data separate from the data used to design the new rule.
How to Read an MAE Scatter Plot
One of the most popular MAE chart types is a scatter plot. It places MAE on the horizontal axis and realizes profit or loss on the vertical axis. When MAE is shown as a positive magnitude, points farther to the right represent larger adverse excursions.
Write the sign convention on the chart. Each point represents one trade. Use clear labels or easily identifiable colours to separate winners from losers, not just colour.
When most of the winners fall into a relatively small MAE band, there may be a good reason to test a stop just outside that band. Losing trades far beyond it may show exposure a tighter rule could remove.
In some cases winners and losers may overlap throughout the MAE range. The chart may then offer no useful stop threshold. Don't make a hard cut. Compare the distributions and test the results of the full strategy instead of choosing a threshold by eye.
Consider any possible threshold as a hypothesis. Recalculate entries, exits, costs, win percentage, pay-off, expectancy and drawdown with the new stop and then test it with unseen data.
How to Track MAE in a Trading Journal

Some good trade journal ideas for MAE are:
- Trade ID and strategy tag
- Side and instrument
- Entry time, entry price, exit time and exit price
- Position size and initial stop
- Lowest price while long, or highest price while short
- MAE unit and data source
- Fees and MFE where measurable and constant
Completed fills do not indicate what occurred between entry and exit. They only log in and out points and not the price moves in between.
The exact MAE can only be calculated from intratrade market data or account equity data. If these data are not available, indicate MAE as unavailable rather than estimating it based only on the exit price.
Choose one measurement method, such as tick data, candle extremes, mark price or executable bid and ask prices. Write the bar interval and trading session. Repeat this process throughout the entire sample.
The bid-ask spread is also important. The executable exit price is typically the bid for a long position. In a short position, it is normally the ask.
MAE and Prop Firm Drawdown Rules
Trade-level MAE and prop firm drawdown are two distinct measures. MAE starts at a trade's entry and ends at its exit.
Daily, static and trailing drawdown rules work differently. Each imposes an account-level limit and provides a reference point and reset method set by the provider.
Some providers include open profit and loss when checking account equity. This means that the negative excursion of one trade may lead to a rule violation, but the MAE used to calculate the violation will be the provider's rule rather than the general MAE formula.
Read the provider's terms of balance versus equity, realized versus unrealized loss, reset time, high-water mark, and intraday monitoring before any trading with evaluation or funded accounts.
If you are trading with Audacity Capital via the Ability Challenge or the Ability One or FTP, please ensure that you check the rules for that program and not assume that all firms operate as such.
Common MAE Mistakes and Limitations
- Using exit loss as MAE. The worst open point can occur well before the exit and can be larger or smaller than the realized result.
- Mixing conventions and units. Positive and negative sign conventions, or points, percentages, dollars and R, cannot be compared as if they were the same thing.
- Ignoring bar limitations. Candle highs and lows need a stated timeframe. A bar extreme may not reflect an executable price, and the order of the high and low inside one bar may be unknown.
- Combining scaled and fixed-size trades. Scaling in or scaling out changes entry cost, quantity and exposure during the trade. Calculate by leg or use a documented running P and L method.
- Setting a stop at average MAE. The mean hides the distribution, outliers, setup groups and the trades a new stop would remove.
MAE is also backward-looking. It describes observed trade paths under one entry, exit and data method. It does not predict the next trade or establish an edge on its own.
Conclusion
Start small. Add maximum adverse excursion to one clearly defined strategy, record it in a consistent unit and review the full distribution after a meaningful sample. Any change to stops or entries should be replayed and tested on unseen data before live use.
Frequently Asked Questions
No universal value is good. It depends on the strategy, instrument, volatility, holding period and risk unit. Compare like trades and judge the full distribution against realized outcomes and your planned stop rather than chasing a target number.
Yes. In live trading, gaps, slippage, spread, delayed orders or a stop that was not active can push MAE beyond the planned stop. In a bar-based backtest, the result also depends on how the engine models intrabar order sequence and fills.
Price-based MAE normally measures adverse price movement before fees. MAE based on running P and L may include some costs, depending on the platform. State which method you use and keep it consistent across every trade in the sample.
Yes, if price moved against the entry before the winning exit. A profitable final result does not erase the open loss the trade showed earlier. Many strong winners carry meaningful MAE, which is exactly why the metric is worth tracking.
There is no universal number. Use enough comparable trades to see a stable distribution, keep an untouched validation sample and avoid mixing different setups or market regimes just to increase the count. Quality and consistency of data matter more than volume.

¿Listo para aplicar un riesgo disciplinado a las criptomonedas? Explore los nuevos instrumentos de cripto de Audacity Capital y traiga su estrategia de trading.
Aprender másBoletín
Únase a nuestro boletín para mantenerse al día.
Únete a Nuestra Comunidad Social

Comienza Tu Viaje Hoy Con Nuestra Prueba Gratuita
Muestra con orgullo tus habilidades y logros a través de certificados y obtén reconocimiento por tu arduo trabajo y dedicación de posibles inversores y compañeros.
Prueba GratuitaArtículos Relacionados
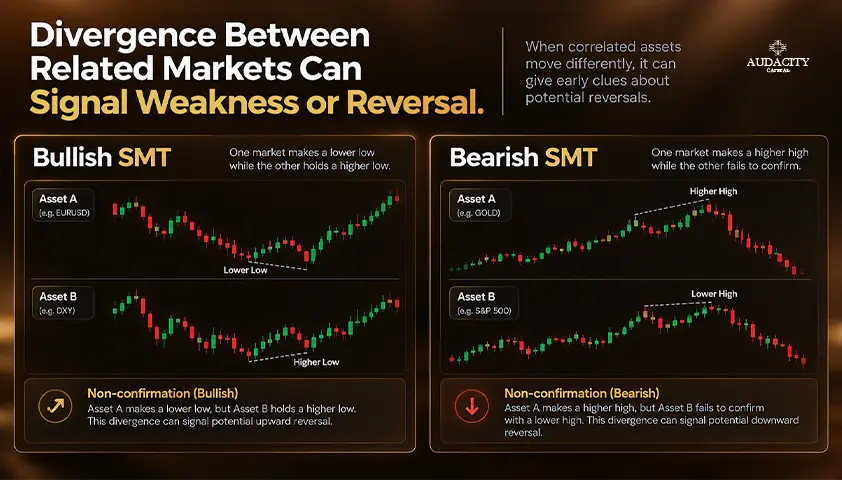
SMT Divergence in Trading: Bullish and Bearish Examples
Learn what SMT divergence means, how bullish and bearish setups form, which markets traders compare, and how to confirm signals and manage risk.


RSI Divergence: A Complete Guide to Spotting and Trading Momentum Shifts
Learn what RSI divergence is, explore bullish, bearish and hidden divergence, and discover how to identify, confirm and trade RSI divergence.
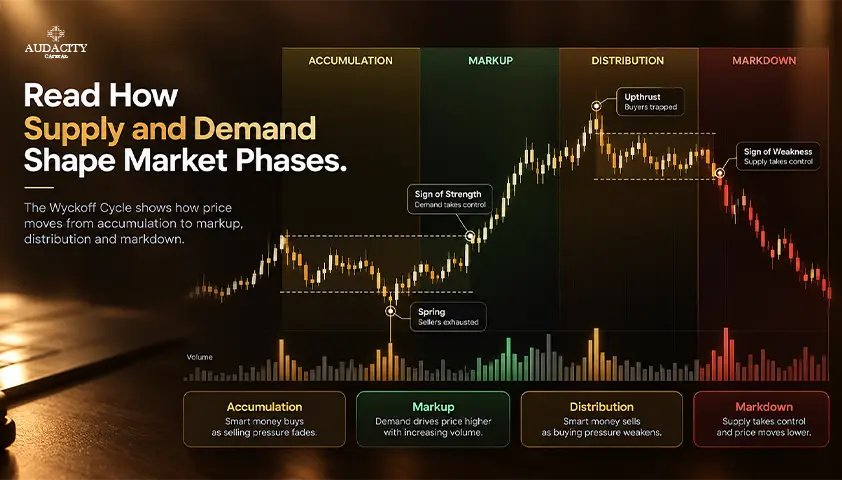
Wyckoff Method Explained: Phases, Rules and Examples
Learn the Wyckoff Method, its three laws, accumulation and distribution phases, trade examples, and the limits of price and volume analysis.
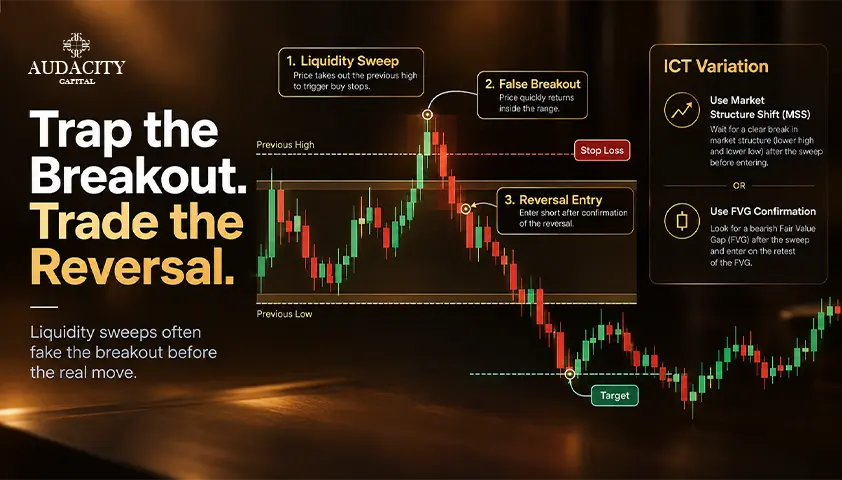
Turtle Soup Trading: Rules, Examples and ICT Variations
Learn turtle soup trading with original rules, ICT variations, bullish and bearish examples, risk controls, and a practical backtesting checklist.