


What Is the Slow Stochastic Oscillator? Formula, Signals and Strategies


Introduction
The slow stochastic oscillator is a momentum indicator used by traders to identify where the closing price of an asset falls within its recent range. Unlike the fast stochastic indicator, the slow one provides further smoothing than the fast oscillator, making it easier to understand when momentum is changing. This can help traders identify potential reversal points.
However, this added smoothing can cause the indicator to be less accurate. It will often lag and can show overbought and oversold conditions during strong trends. It is therefore important to understand how the indicator works.
This guide will explain exactly what is slow stochastic oscillator, how it can be calculated, and how it differs from a fast stochastic oscillator. We will also discuss some practical trading strategies, common pitfalls, and some risk management considerations in order to help you understand how to interpret its signals in the wider market environment.
Read more about Stochastic Oscillator
What Is the Slow Stochastic Oscillator?
The Slow Stochastic Oscillator is a technical analysis indicator used in identifying opportunities in the market. The indicator measures momentum by taking the closing price of an asset and comparing it to the high-low range over a period of time. Traders will use this to determine if buying/selling pressure may be changing and to identify possible trading opportunities.
The indicator shows two lines. The first is the slow %K line. This is the smoothed stochastic value. The second line is the %D line. This is normally a moving average of the %K line. Traders will look at how the lines move and interact to determine any possible changes in momentum.
This runs from 0 to 100. Values above 80 are generally considered to be overbought, and values below 20 are generally considered to be oversold. The slow stochastic is smoothed to reduce short-term volatility. This means that the signals are less sensitive to small price movements. However, this can lead to some lag and false signals. The slow stochastic does not measure the magnitude of recent price movements like the Relative Strength Index. Instead, it focuses on the closing price in relation to its recent range.
Read more Stochastic Oscillator vs RSI
Stochastic Oscillator Fast vs Slow: Key Differences
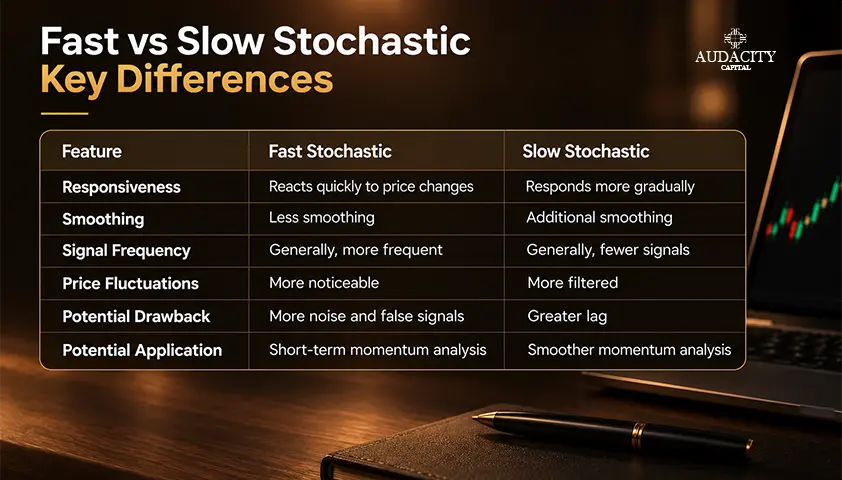
The major difference between the Fast and Slow Stochastic Oscillator is the amount of smoothing that is applied to the indicator. Both indicators are used to determine the position of the closing price of an asset relative to its high-low range; however, they will act differently.
The Fast Stochastic Oscillator uses the original %K formula and includes a signal line, which is usually a 3-period moving average of the %K. As there is less smoothing applied to the indicator, it will respond rapidly to price changes. This can be useful to identify short-term momentum changes; however, it may cause frequent crossovers and false signals in a choppy market.
The Slow Stochastic Oscillator calculates the signal line of the %K value after smoothing. This makes the indicator less volatile to short-term fluctuations in the market. The downside is that it causes the indicator to lag behind the market, therefore causing traders to be late to recognize momentum changes.
Here is a table showing the main differences between the fast and slow stochastic oscillator:
Feature | Fast Stochastic | Slow Stochastic |
Responsiveness | Reacts quickly to price changes | Responds more gradually |
Smoothing | Less smoothing | Additional smoothing |
Signal Frequency | Generally, more frequent | Generally, fewer signals |
Price Fluctuations | More noticeable | More filtered |
Potential Drawback | More noise and false signals | Greater lag |
Potential Application | Short-term momentum analysis | Smoother momentum analysis |
The faster version of the indicator could be preferred by traders who like quick responses and are able to filter out the noise. The slower version could be more useful for traders looking for smoother readings.
Depending on your strategy, timeframes, market conditions, and confirmation ability, both versions have their pros and cons. Both versions can give false readings, especially in strong trends. Price action and risk management are still important before opening any trades.
Slow Stochastic Oscillator Formula: How Is It Calculated?
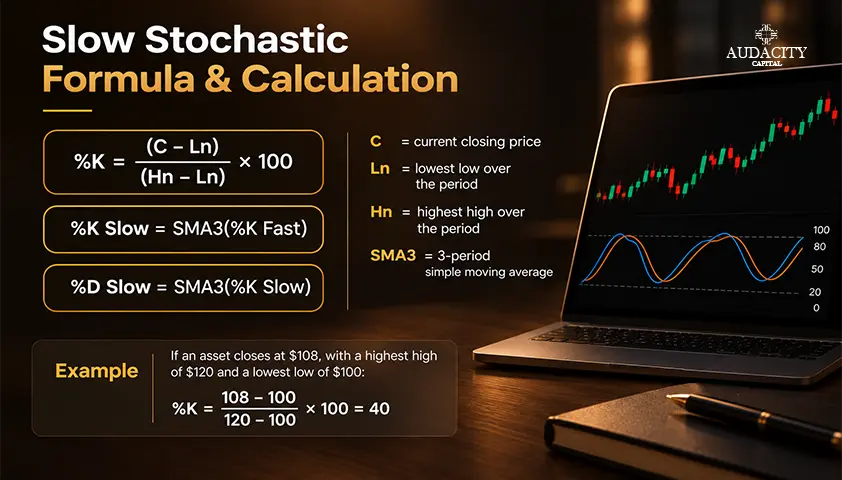
The slow stochastic oscillator formula takes the closing price, high, and low of an asset over a period of time. From this, it uses smoothing in the calculation to reduce short-term volatility.
The calculation begins with the fast %K formula:
%K = C – Ln/Hn – Ln * 100
Where:
- C = current closing price
- Ln = lowest low over the selected period
- Hn = highest high over the selected period
- n = lookback period
Next, the slow %K line is calculated by taking a moving average of the fast %K readings, commonly over three periods:
%K Slow = SMA3(%K Fast)
The slow %D line is then calculated by applying another three-period simple moving average to the slow %K readings:
%D Slow = SMA3(%K Slow)
Example
Suppose an asset closes at $108, with a highest high of $120 and a lowest low of $100 over the selected lookback period.
The fast %K reading is:
108 – 100/120 – 100 *100 =40
Assume the three most recent fast %K readings are 30, 40, and 50. Their average gives a slow %K reading of 40.
If the three most recent slow %K readings are 35, 40, and 45, the slow %D reading is also 40.
The resulting slow stochastic readings are %K = 40 and %D = 40.
The most common configuration is 14, 3, 3. However, trading platforms may vary in their default values and method of calculation. If the highest high and lowest low are the same, the denominator will be zero in the original formula, therefore requiring special treatment by the trading platform.
Understanding %K, %D, and Smoothing
The Slow Stochastic Oscillator uses two lines, %K and %D, to help traders interpret changes in momentum. Although they are related, each serves a different purpose.
What Is the %K Line?
The %K line measures how close the closing price of an asset moves in relation to its most recent high-low range. This figure is what is normally smoothed in the Slow Stochastic Oscillator. As a result, traders can determine how momentum is changing and therefore potential reversals in buying/selling pressure. However, it does not show if prices are increasing or decreasing.
What Is the %D Line?
The %D line is generally a 3-period simple moving average of the slow %K line. Because of this, it moves more slowly to reflect changes in momentum. Traders will often look at both lines together to see if there are any crossovers. If the %K line crosses above the %D line, it can indicate that upward momentum is increasing. Alternatively, if it crosses below, it may indicate that momentum is slowing. However, neither of these is a confirmation of a reversal.
How Does Smoothing Work?
The smoothing process is simply taking an average of the most recent stochastic readings and reducing the volatility. For example, the fast %K line is smoothed over 3 periods to create the slow %K line in the popular 14, 3, 3 setting. %D is then smoothed over 3 periods again. This will make the indicator less responsive to small changes in price.
The lines should always be interpreted within a market context. For example, if there is a bullish crossover in a strong downtrend, this may be a sign of a short-term bounce. Using the oscillator alongside price action, support/resistance, and the overall trend can help traders understand if the signal is meaningful.
How to Read Slow Stochastic Oscillator Signals
The Slow Stochastic Oscillator is used to help identify momentum. The signals you get from the oscillator are based on the values, crossing of the lines, and how they interact with price. Always remember these are indicators and not guarantees. In order to use the slow stochastic oscillator effectively, it is important to know how to read the indicator and what exactly to look at.
Understand Overbought and Oversold Levels
The indicator is usually between 0 and 100, but 80 and 20 are what is commonly used.
- Above 80: This means that the price is closing towards the higher end of its recent range and could indicate strong bullish momentum.
- Below 20: This means the price is closing towards the lower end of its recent range and could indicate strong bearish momentum.
If the reading on a currency pair gets to 15, for example, traders might look to see if there are any signs of a reversal taking place. However, this number alone would not mean you should go long, as it may continue to trend lower.
Identify Bullish and Bearish Crossovers
The %K line crossing over the %D is used to identify potential changes in momentum.
Bullish Crosses: When the %K crosses over the %D, this shows that there could be increasing upward momentum.
Bearish Crosses: When the %K crosses under the %D, this shows there could be decreasing upward momentum or increasing downward pressure.
A bullish cross near support could gain attention if it appears that price is forming a reversal. This can confirm that the signal is genuine and prevent traders from making decisions based on one signal.
Read more about Moving Average Crossover Strategy
Interpret Moves Out of Extreme Zones
If an asset moves out of an overbought/oversold range, it could be seen as a shift in momentum. If it crosses over the 20 level after being in an oversold position, traders may look for signs to indicate that price may regain strength. Conversely, if it moves below the 80 level after being overbought, then it could be seen as losing upward momentum. These will be more useful if there is confirmation from price, or a relevant support/resistance level.
Spot Potential Divergence
Divergence occurs when price movement disagrees with the indicator's movement. For example, if price makes a lower low while the oscillator forms a higher low, selling momentum may be weakening. This is a potential warning, not confirmation that a reversal will occur.
Consider Trend Strength and Stochastic Oscillator Fast vs Slow
During strong trends, the indicator can stay above 80 or below 20 for a long time. This can result in poor decisions being made by entering short positions on overbought readings or going long on oversold readings.
Understanding stochastic oscillators fast vs. slow helps with signal interpretation. Fast will respond quicker to price movements, but slow will smooth out more of the volatility. Whatever type you use, consider the overall trend and seek confirmation of the signals.
How to Apply the Slow Stochastic Oscillator in the Market
The Slow Stochastic Oscillator is a very useful indicator that traders can use in various market conditions. By combining the oscillator with trend analysis, price action, and support and resistance levels, you can determine the momentum of the market and find potential trading opportunities. Here are ways you can use the slow stochastic oscillator:
Trading Pullbacks in an Established Trend
The Slow Stochastic Oscillator helps traders identify if there is weakening momentum in a pullback within a trending market. For example, when an asset is trending upward, the oscillator may move below the 20 level. If %K then crosses above %D and the price starts to recover, then this could indicate buying momentum has returned. Traders should first confirm that the overall market trend is still bullish by looking for higher highs and higher lows or confirming that price is trading above a relevant moving average.
Identifying Potential Reversals in Ranging Markets
Overbought and oversold readings can be useful when we have a ranging market, with clear support and resistance levels. If the price is nearing a resistance level and the indicator rises above 80, we can look for a loss of bullish momentum. If there is a bearish crossover and the price rejects off the resistance, it can give us further confirmation to look for a selling opportunity. This can also work the other way round, where we can look to buy near a support as the indicator drops below 20.
Using Crossovers with Price Confirmation
Using %K and %D crossings can be useful for identifying potential momentum changes, but it depends on what is occurring in the market. Traders should look at these crossings in combination with price action such as breakouts, candlestick rejections, and support/resistance retests.
If a bullish crossing occurs and then a breakout takes place above resistance, we can gain more confirmation that movement is in an upward direction. Waiting for price confirmation will help us avoid early entries.
Recognizing Potential Momentum Divergence
Divergence is when price action goes against the oscillator. If, for example, an asset hits a new low, but the Slow Stochastic hits a higher low, this could be a sign of decreasing bearish momentum. Traders can use this as a leading indicator to keep an eye on the market, but it can occur while price continues in its trend. Therefore, traders shouldn’t consider this as an entry signal.
Choosing Timeframes and Market Conditions
The effectiveness of the Slow Stochastic Oscillator varies depending on the time frame and market conditions. Traders should know how the time frame and market conditions will affect its sensitivity.
Using the Indicator on Different Timeframes
On lower timeframes, such as 5 or 15 minutes, the indicator can be more reactive to short-term price movements, which can be useful for day trading to see intraday momentum. However, you will get signals influenced by market noise.
On higher timeframes, such as daily or weekly, the indicator tends to reflect overall price movements. This can be useful for swing and position traders to see longer-term momentum changes. However, signals can be slower to form.
Most times, the slow stochastic indicator behaves differently depending on the prevailing market environment:
Trending markets: Useful to give an indication of momentum during a retracement. However, it can remain overbought or oversold for long periods of time.
Ranging Markets: Can be useful to identify potential reversals when overbought/oversold conditions are met close to key support and resistance levels.
Volatile Markets: Sudden price movements can cause sudden changes in the oscillator. Price confirmation is always key in such situations.
Adjusting Smoothing Settings
The indicator's settings also influence how quickly it responds to price changes. Shorter smoothing periods make it more sensitive and may produce earlier signals, but they can increase noise. Longer smoothing periods filter more fluctuations but may delay potential trading signals.
Traders should test different configurations on the instruments and timeframes relevant to their strategies. No timeframe, setting, or market condition guarantees reliable signals. The goal is to find a configuration that provides useful information without encouraging unnecessary trades.
Common Mistakes When Using the Slow Stochastic Oscillator
The data provided by the Slow Stochastic Oscillator can be helpful in judging the momentum of the market. However, incorrect interpretation can cause bad trading decisions. The most common errors made are:
Treating overbought readings as automatic sell signals: Some traders assume that any indicator reading above 80 is a sell signal. This is not always true, as strong trending markets can cause the oscillator to stay in overbought territory.
Buying solely because the indicator falls below 20: Just because the market is in oversold territory does not mean it will recover straight away, and prices may continue to fall.
Ignoring the broader trend: Taking trades that go against the dominant trend can cause unnecessary risk to be taken.
Entering every crossover without confirmation: Not all crossovers between %K and %D will result in movements in price. You should look for confirmation of the crossover using price or other indicators.
Constantly changing indicator settings: This can cause overfitting and will produce inconsistent results. You should test your settings using enough historical data before investing your money.
Ignoring trading costs and risk management: Frequent signals can encourage excessive trading, particularly on lower timeframes. Spreads, commissions, slippage, and poor position sizing can affect overall performance.
Managing Risk When Trading with the Indicator
The Slow Stochastic Oscillator can be used to give the trader some insight into possible trading opportunities. However, you must have a clear trading plan in place. It is important to also manage your risk, as trades are not guaranteed to be profitable.
Most times, the stop loss will depend on the market structure, and it indicates when your idea becomes invalid. If you are buying near support, then you might place a stop loss below the recent swing low.
Position sizing should also be considered. Decide on how much you are willing to risk before entering a trade and alter your position size depending on how far away your entry is from your stop loss.
It is also important to analyze how well the indicator works in a series of trades. You can backtest and look at your results to see if there are any flaws. This will allow you to determine whether your setup will work in the long run or it might still need some adjustments.
Conclusion
The Slow Stochastic Oscillator can be a valuable tool for determining momentum, identifying turning points, and understanding market buying and selling pressures. The additional smoothing means it is less responsive to short-term price movements, while crossovers between %K and %D can be used to provide some insight into potential momentum changes.
Unlike the fast stochastic, which reacts more quickly to price changes, the slow version produces smoother readings but may introduce delays. Neither of the stochastics will always give accurate signals, and the effectiveness of using them will depend on your trading strategy and market conditions.
As with all indicators, you shouldn’t just rely on simply overbought or oversold levels or single crossover signals. You should look at the indicator in combination with price action, trend, and support/resistance. Also, ensure that you are using the correct position sizes and stop losses.
Most importantly, you should understand how the Slow Stochastic Oscillator works. Experiment with different settings and strategies to see how they perform on historical data.
FAQs
It is a momentum indicator that measures a closing price's position within its recent trading range using smoothed readings.
By smoothing the fast %K reading to obtain slow %K, then calculating a moving average of slow %K to obtain %D.
Fast stochastic reacts more quickly to price changes, while slow stochastic applies additional smoothing to reduce fluctuations.
The commonly used settings are 14, 3, 3, representing the lookback period and two smoothing periods.
Yes. It can help day traders assess intraday momentum, but signals should be confirmed with price action.

क्या आप क्रिप्टो पर अनुशासित जोखिम लागू करने के लिए तैयार हैं? Audacity Capital के नए क्रिप्टो उपकरणों का पता लगाएं और अपनी ट्रेडिंग रणनीति लाएं।
और जानेंन्यूज़लेटर
हमारे न्यूज़लेटर से जुड़ें।
हमारे सामाजिक समुदाय में शामिल हों

आज ही अपनी यात्रा शुरू करें हमारे नि:शुल्क परीक्षण के साथ
प्रमाणपत्रों के माध्यम से अपने कौशल और उपलब्धियों को गर्व से प्रदर्शित करें और संभावित निवेशकों और साथियों से अपनी कड़ी मेहनत और समर्पण के लिए पहचान प्राप्त करें।
नि:शुल्क परीक्षणसंबंधित लेख
Maximum Favorable Excursion: How MFE and MAE Read a Trade
Learn how Maximum Favorable Excursion and MAE reveal a trade's best and worst open moves, exit giveback, and possible entry or exit problems.

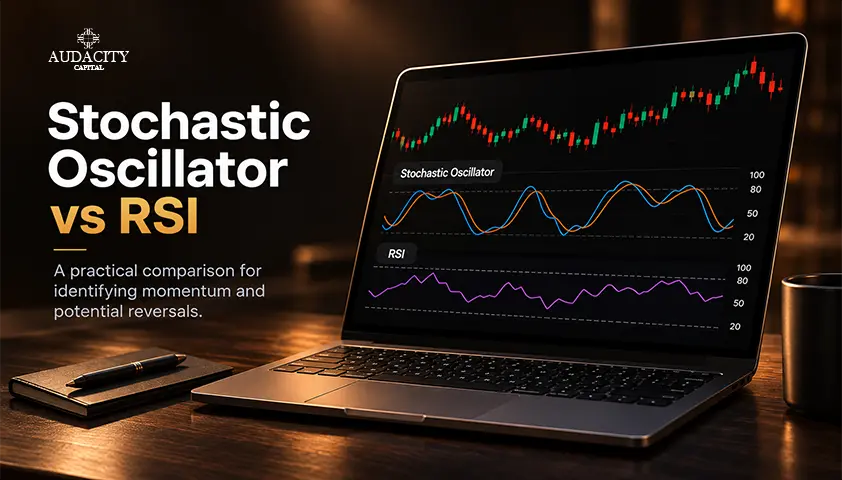
Stochastic Oscillator vs RSI: How They Differ and How to Use Them
Compare RSI and the Stochastic Oscillator, understand their signals, and choose the right indicator for your trading strategy.
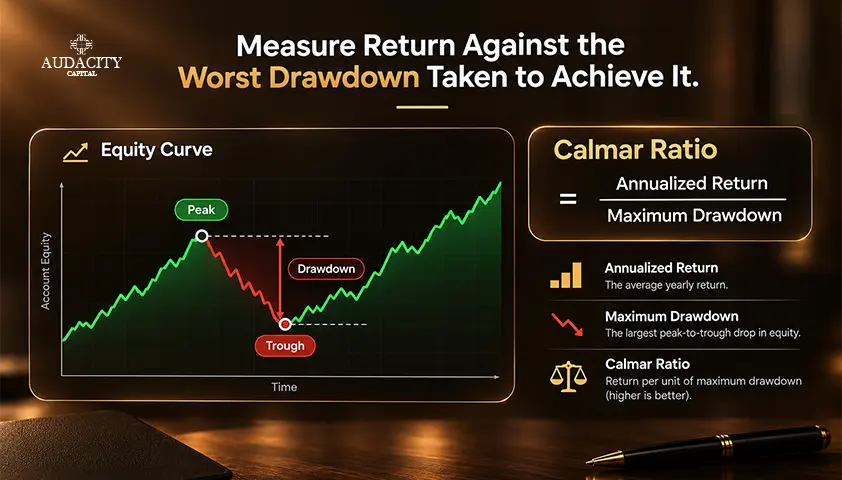
Calmar Ratio: Meaning, Formula and Examples
Learn what the Calmar Ratio means, how to calculate it, interpret results, and compare it with Sharpe and Sortino ratios.

Stochastic Oscillator
Learn how to use the stochastic oscillator in trading, interpret overbought and oversold levels, spot crossovers, and adjust settings.