



Break and Retest Trading Strategy for Beginners



Introduction
Most new traders learn about breakouts early on. Price pushes through resistance, momentum kicks in, and the chart looks like it is about to take off. So they buy the breakout candle, and more often than they would like, price snaps straight back below the level and stops them out.
The break and retest strategy exists because of that exact problem. Instead of chasing the initial move, you wait for price to break a key level, pull back to test it from the other side, and show you that the level has genuinely changed roles. Only then do you look for an entry.
It is one of the simplest price action strategies to understand, which makes it a natural starting point for beginners. It is also one of the most widely used by experienced traders, because the core logic works across forex, indices, commodities and crypto, and on almost any timeframe.
This guide walks through how the break and retest works, how to tell a real break from a fakeout, the different ways to enter, where to put your stop and targets, and a full worked example on GBP/USD.
What Is a Break and Retest?

A break and retest is a price pattern where a market breaks through a significant support or resistance level, then returns to that level before continuing in the direction of the break.
There are two versions:
- Bullish break and retest: price breaks above resistance, pulls back down to that old resistance, finds buyers there, and moves higher. The old resistance has become new support.
- Bearish break and retest: price breaks below support, rallies back up to that old support, meets sellers, and moves lower. The old support has become new resistance.
The idea behind both is the same. A level that used to hold price on one side now holds it on the other. Traders often call this "role reversal" or "polarity", and it is one of the oldest principles in technical analysis.
The retest is what separates this strategy from simple breakout trading. A breakout trader enters as the level breaks. A break and retest trader lets the break happen, then waits for the market to prove it on the pullback.
Why the Break and Retest Works
Charts are a record of orders. When a level holds price several times, it is because there were enough orders sitting there to stop the move. Understanding what happens to those orders explains why the retest so often holds.
Trapped traders. Imagine a resistance level that has rejected price three times. Plenty of traders have sold short from that level. When price finally breaks above it, those short sellers are now in losing positions. Many of them will place their exit orders around their entry, meaning back at the old resistance. When price pulls back there, those traders buy to close their shorts, which adds buying pressure exactly at the level.
Missed traders. Others watched the breakout happen without getting in. They do not want to chase, so they wait for a better price. The pullback to the broken level gives them that chance, and their buy orders add to the support.
Institutional order flow. Larger participants rarely fill their full position in a single candle. A break followed by a pullback lets them add size at a more favourable price without pushing the market against themselves.
None of this guarantees the level will hold. But it explains why broken levels so often act as a magnet for pullbacks and a launchpad for continuation, and why the retest gives you a logical, defined place to manage risk.
The Three Phases of a Break and Retest

Every clean break and retest moves through three phases. Learning to recognise each one helps you stay patient and avoid jumping in too early.
Phase one: the break. Price moves decisively through the level and closes beyond it. This shows that the balance between buyers and sellers at that level has shifted.
Phase two: the pullback. Price stops pushing away from the level and drifts back towards it. This is normal. Markets rarely move in straight lines, and some traders are taking profit from the breakout move.
Phase three: the confirmation. Price reaches the broken level and reacts. In a bullish setup, you want to see buyers step in: rejection wicks, a strong bullish candle, or a shift in lower timeframe structure. This reaction is your signal that the level has flipped.
If phase three never arrives and price simply slices back through the level, the setup has failed. That is not a loss. It is information, and it tells you to stay out.
Identifying Levels Worth Trading
The quality of a break and retest depends heavily on the quality of the level being broken. A random line drawn on a chart will not attract the same order flow as a level the whole market is watching.
Good levels to focus on include:
- Horizontal support and resistance that has been tested multiple times. Two or three clear reactions is a good minimum.
- Range boundaries. When price has been consolidating between a clear high and low, the break of either boundary often leads to a strong move.
- Previous day, week and month highs and lows. These are watched by traders worldwide and often attract liquidity.
- Session highs and lows, such as the Asian session range before the London open.
- Trendlines and channel boundaries, although these are more subjective, so treat them with some caution.
- Psychological round numbers like 1.3000 on GBP/USD or 2,000 on gold, especially when they line up with other structure.
A useful test: if you zoom out to a higher timeframe and the level is still obvious, it is probably worth trading. If you have to squint to see it, other traders probably cannot see it either.
What Makes a Valid Break
Not every move through a level is a genuine break. Many are fakeouts designed, intentionally or not, to trigger stop losses and trap breakout traders. Before you start watching for a retest, the break itself should meet a few conditions.
A candle close beyond the level. A wick poking through resistance is not a break. Wait for a candle to close beyond it on the timeframe you are analysing. Many traders prefer the candle body to close clearly beyond the level rather than just a few pips over it.
Displacement. Strong breaks tend to come with large, momentum-driven candles rather than slow, overlapping ones. A sharp move shows real commitment from one side of the market.
Context. A break in the direction of the higher timeframe trend is far more reliable than one against it. Breaking resistance in a clear uptrend makes sense. Breaking resistance in the middle of a strong downtrend is more likely to fail.
Distance. Ideally price travels a meaningful distance away from the level before pulling back. If it closes one pip above resistance and immediately drifts back, the break has not proven much.
Timing. Breaks during active sessions, particularly the London and New York sessions for most forex pairs, tend to carry more follow-through than breaks during quiet periods when liquidity is thin.
Reading the Retest
Once you have a valid break, the next job is to judge the pullback. Retests come in different shapes, and some are more convincing than others.
The clean touch. Price returns exactly to the level, reacts sharply, and moves away. These are the textbook examples, and they offer tight entries.
The shallow retest. Price pulls back but stops short of the level, often because buying pressure is so strong. These are harder to catch with limit orders, and chasing them usually means a worse risk-to-reward ratio.
The deep retest. Price pushes slightly back through the level before recovering. A brief dip below the line, especially as a wick, is not automatically a failure. Levels are better thought of as zones than exact prices. What matters is where candles close.
The failed retest. Price closes back beyond the level on your analysis timeframe and keeps going. The break was false, and the setup is off.
A few signs of a quality retest:
- The pullback is slower and weaker than the breakout move, with smaller candles and less momentum.
- Rejection wicks appear at the level.
- Lower timeframe structure shifts back in the direction of the break.
- The retest happens reasonably soon after the break. If price spends days chopping around the level, the original momentum has faded.
Three Ways to Enter a Break and Retest
There is no single correct entry. Each method trades off between getting a better price and getting more confirmation.
Method one: the limit order entry. Place a limit order at or just beyond the broken level, with your stop on the other side. This gives you the best price and the tightest stop, but no confirmation. Sometimes price will blow straight through your order and stop you out. This approach suits traders who are confident in the level and comfortable with a lower win rate in exchange for larger winners.
Method two: the confirmation candle entry. Wait for price to reach the level and print a clear reversal candle, such as a bullish engulfing, a pin bar or a strong close away from the level. Enter on the close of that candle or on a break of its high. You give up a little on price, but you filter out many failed retests. This is often the best starting point for beginners.
Method three: the lower timeframe structure entry. Drop to a lower timeframe as price reaches the level and wait for a shift in market structure. In a bullish setup, that might mean price makes a lower low into the level, then breaks above the most recent lower high. Enter on the pullback after that shift. This method can offer both confirmation and a tight stop, but it takes more practice to execute well.
Whichever method you choose, stick with it long enough to learn how it behaves. Switching entry styles every few trades makes it impossible to judge what is working.
Where to Place Your Stop Loss
The broken level gives you a natural place to define risk. If the level has truly flipped, price should not close back beyond it. If it does, your trade idea is wrong.
Common stop placements include:
- Beyond the retest swing. In a bullish trade, place your stop below the lowest point of the retest. This is the most logical option because that low is where the market showed its hand.
- Beyond the level with a buffer. If the retest was a clean touch, place your stop a set distance below the level. A buffer based on the Average True Range, or a fixed number of pips appropriate for the pair, helps account for normal noise and spreads.
- Beyond the confirmation candle. If you entered on a confirmation candle, your stop can sit beyond that candle's low or high.
Avoid placing your stop exactly on the level or at an obvious round number. These spots attract stop hunts, and a brief spike can take you out before price moves in your favour.
Above all, size your position from your stop distance, not the other way round. Decide how much of your account you are willing to risk, often between 0.5% and 1% per trade, then calculate the position size that fits that risk.
How to Backtest the Break and Retest Strategy
Backtesting helps traders evaluate how a break and retest strategy would have performed under historical market conditions. Rather than relying on a few successful trades, you can use historical price data to assess the setup, measure results and understand its limitations.
Follow these steps to backtest the strategy:
- Choose a market and timeframe. Select one market, such as GBP/USD, and a timeframe to test. Avoid mixing different markets and timeframes in your initial test.
- Define the setup rules. Decide what qualifies as a key support or resistance level, how a breakout is confirmed, and what price action counts as a valid retest.
- Set entry and exit rules. Establish your entry trigger, stop-loss placement and profit target before reviewing each historical setup.
- Review historical charts. Move through the chart one candle at a time and record every setup that meets your criteria, including failed breakouts and losing trades.
- Track the results. Record the number of trades, win rate, average winning trade, average losing trade and maximum drawdown. You can also measure each outcome in terms of risk-to-reward (R).
- Repeat the test. Test different market conditions and, where possible, validate your rules against a separate period of historical data that you did not use to develop the strategy.
A useful backtest should include every qualifying setup, not just examples that look convincing in hindsight. This helps reduce selection bias and gives you a more realistic view of how consistently the strategy may perform.
Historical results do not guarantee future performance. Live results may differ because of changing market conditions and execution quality.
Take Profit and Trade Management
A good entry is only half of the trade. Knowing where to take profit keeps you from giving back gains or closing too early.
Next key level. The simplest approach is to target the next significant support or resistance level in the direction of the trade. If you have broken resistance, the next resistance above becomes your target.
Measured move. If the break came from a range, measure the height of the range and project it from the breakout point. A 60-pip range that breaks to the upside gives an initial target 60 pips above the range high.
Fixed risk-to-reward. Some traders simply aim for a set multiple of their risk, such as 2R or 3R. This keeps things consistent, but check that there is no major level sitting in the way.
Partial profits and trailing stops. You can take part of the position off at the first target, move your stop to breakeven, and let the rest run, trailing your stop behind new swing lows or highs as structure develops.
Before entering any trade, check that your target offers at least 1.5 to 2 times your risk. If the next opposing level is too close, the setup may be valid but not worth taking.
Using Multiple Timeframes
Multi-timeframe analysis makes the break and retest far more reliable. A typical approach uses three timeframes:
- Higher timeframe (daily or H4): identifies the overall trend and the key levels worth watching.
- Middle timeframe (H1): shows the break and the pullback developing.
- Lower timeframe (M15 or M5): used to time the entry at the retest.
The higher timeframe acts as a filter. If the daily chart is in a clear uptrend, you focus only on bullish breaks of resistance and ignore bearish breaks of support. This one rule alone can remove a large share of losing setups.
A practical ratio is to keep roughly four to six times between each timeframe, for example daily, H4 and H1, or H4, H1 and M15. Too large a gap and the timeframes stop relating to each other. Too small and they show you the same information.
Best Market Conditions and Trading Sessions
The break and retest works best in trending markets and during transitions out of consolidation. It struggles in choppy, directionless conditions where price breaks levels in both directions without follow-through.
Trading sessions matter. For forex traders, the London open often produces breaks of the range formed during the Asian session. The New York session, especially the overlap with London, brings another wave of volume that can drive strong breaks and clean retests. The Tokyo session tends to be quieter for most major pairs, though JPY crosses and AUD and NZD pairs can be more active.
Be careful around high-impact news. Central bank decisions from the Federal Reserve, the European Central Bank, the Bank of England or the Bank of Japan, along with major data releases like inflation figures and employment reports, can produce violent spikes through levels that reverse just as quickly. Many traders avoid taking new break and retest entries in the minutes around major releases, or wait for the dust to settle before judging whether a break is genuine.
Avoid thin markets. Holiday periods, Friday afternoons and the hours between the New York close and the Asian open often lack the liquidity needed for clean follow-through.
Common Mistakes and How to Avoid Fakeouts
Entering on the break instead of the retest. This is the most common beginner mistake. If you buy the breakout candle, you are not trading a break and retest. Be patient and let the pullback come to you.
Trading weak levels. A level that has only been touched once, or one you had to force onto the chart, rarely produces a reliable reaction.
Ignoring the higher timeframe. A bullish break on the M15 means little if price is sitting directly under major daily resistance.
Treating levels as exact lines. Price often overshoots a level by a few pips. Think in zones and judge the retest by candle closes, not wicks.
Chasing missed retests. If price retests and leaves without you, let it go. Entering far from the level wrecks your risk-to-reward and leaves your stop in an awkward place.
Taking every setup. Not every break and retest is worth trading. Apply your checklist and skip anything that does not meet it. Fewer, higher-quality trades almost always beat frequent, average ones.
Poor risk management. Even the best setups fail regularly. Without consistent position sizing, a short losing streak can do serious damage to your account.
Worked Example: GBP/USD Break and Retest
The figures below are illustrative and designed to show the process, not to reflect any specific historical trade.
Step one: higher timeframe context. On the daily chart, GBP/USD has been making higher highs and higher lows for several weeks. The bias is bullish, so you are only looking for bullish break and retest setups.
Step two: identify the level. On the H4 chart, price has been capped by resistance at 1.2650 for over a week, with three clear rejections from that area. Below it, price has been ranging down to about 1.2580.
Step three: the break. During the London session, a strong bullish H4 candle breaks through 1.2650 and closes at 1.2685. The candle body is large, and the break is in line with the daily uptrend. This meets the criteria for a valid break.
Step four: the pullback. Over the next few H4 candles, price drifts back down with smaller, overlapping candles. During the New York session, it reaches 1.2655, just above the old resistance, and briefly wicks to 1.2640.
Step five: confirmation. On the M15 chart, price prints a bullish engulfing candle off the 1.2640 to 1.2655 zone and breaks above the most recent lower high. Buyers have stepped back in at the old resistance.
Step six: the trade plan.
- Entry: 1.2662, after the M15 confirmation
- Stop loss: 1.2628, below the retest low of 1.2640 with a small buffer
- Risk: 34 pips
- Target: 1.2760, the next H4 resistance
- Potential reward: 98 pips, roughly 2.9R
Step seven: position sizing. With a $10,000 account and a 1% risk rule, the maximum risk is $100. On GBP/USD, one standard lot is worth about $10 per pip. Dividing $100 by 34 pips gives roughly $2.94 per pip, or around 0.29 lots.
Step eight: management. When price reaches 1.2710, about halfway to target and well clear of the entry, you could move the stop to breakeven or take partial profit. If price reaches 1.2760, the trade closes for around 2.9 times the amount risked. If price instead closes back below 1.2640 on the H1, the setup has failed and the stop limits the loss to the planned $100.
The key point is that every decision, from the entry to the stop to the size, was defined before the trade was placed.
Key Takeaways
- A break and retest occurs when price breaks a key level, pulls back to test it from the other side, and continues in the direction of the break.
- The strategy works because broken levels attract trapped traders, missed traders and institutional orders, often flipping support into resistance and vice versa.
- Focus on clear, multi-tested levels that are visible on higher timeframes.
- Wait for a candle close beyond the level, ideally with strong momentum and in line with the higher timeframe trend.
- Treat levels as zones and judge retests by candle closes rather than wicks.
- Choose an entry method, whether limit order, confirmation candle or lower timeframe structure, and use it consistently.
- Place stops beyond the retest swing, size positions from the stop distance, and target the next key level with at least 1.5 to 2 times your risk.
- Trade during active sessions, take care around high-impact news, and skip setups that do not meet your criteria.
Traders looking to put their skills into practice can explore Audacity Capital's funded trading programs and review the applicable trading rules
Frequently Asked Questions
Yes. The logic is easy to understand, the levels are visual, and the setup gives a clear place to put your stop. It is a solid foundation for learning price action and risk management.
It works on any timeframe, but beginners often find the H1 and H4 charts easier to read because there is less noise. Using a higher timeframe for direction and a lower one for entries is a common approach.
There is no fixed rule, but the best retests usually happen within a reasonable number of candles after the break. If price wanders away for a long time and then returns, the original momentum may have faded and the level may behave differently.
Then there is no trade. Strong moves sometimes run without pulling back. Missing a trade is far better than chasing a poor entry, and another setup will come along.
Yes. The principle of role reversal applies to any liquid market. Just adjust your stop buffers to the volatility of the instrument, as gold and indices typically move further in pips or points than major forex pairs.
In a break and retest, price closes beyond the level and then holds it on the pullback. In a fakeout, price briefly moves beyond the level but closes back inside it, trapping breakout traders. Waiting for the close and the retest is the main way to filter out fakeouts.

暗号資産に規律あるリスクを適用する準備はできていますか?Audacity Capitalの新しい暗号資産商品を探索し、あなたの取引戦略を持ち込んでください。
詳細を見るニュースレター
ニュースレターに登録して最新情報を入手。
ソーシャルコミュニティに参加

関連記事
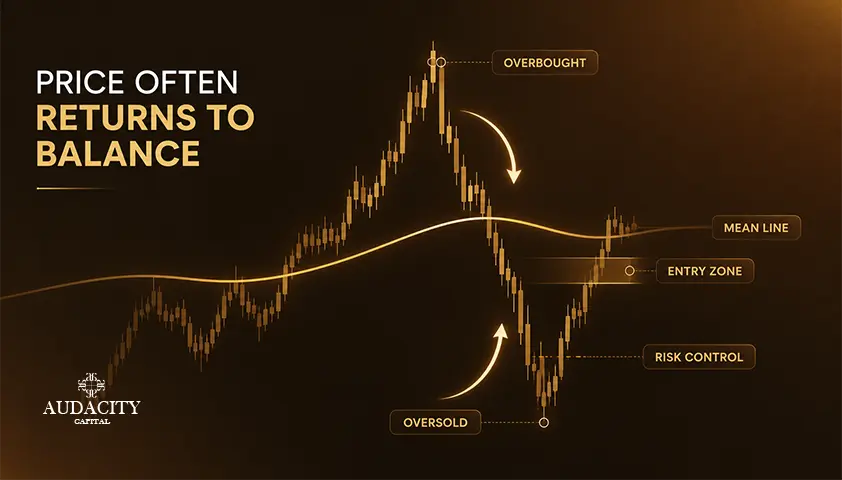
Mean Reversion Trading Strategy Explained (2026)
Prices that stretch too far tend to snap back to an average, but only in the right market. Learn the tools, the setup, and the trend risk.


Momentum Trading Strategy: A Comprehensive Guide
Master the core principles of a momentum trading strategy. Learn how to use key indicators, manage sharp-reversal risks, and master exit timing.
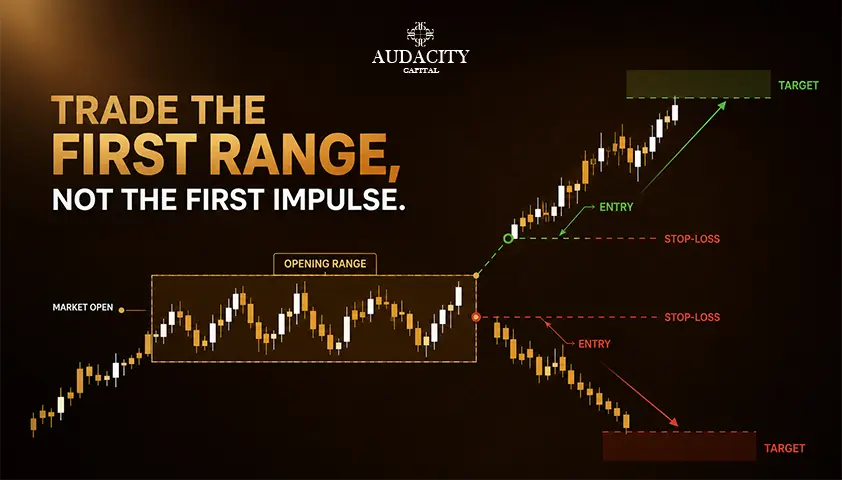
Opening Range Breakout Strategy: Rules, Setups and Examples
Learn how the opening range breakout strategy works, including ORB rules, 5, 15 and 30-minute setups, entry signals, stop losses and risk management.

Martingale Strategy in Trading
How the martingale trading strategy works, what the doubling arithmetic actually costs, why position sizing cannot create an edge, and where it is banned.