


Grid Trading: How It Works and Where It Breaks


Grid trading involves placing a sequence of buy and sell orders at fixed intervals around a selected base price. The strategy is designed to profit from price moving back and forth rather than predicting direction.
In most cases, it is automated using an expert advisor (EA) or a bot. This is one reason why the strategy appeals to intermediate traders looking for a mechanical, non-directional system.
The appeal is genuine, as the strategy creates a constant stream of closed gains in a choppy market and an incredibly stable equity line. The risk is equally compelling as the grid can have substantial open losses.
If a sustained trend occurs or a surprise move pushes price beyond the grid, small gains can turn into a huge loss.
The article explains how grid trading works and analyzes its failures that most guides omit. This is an educational piece and not financial advice. Grid trading doesn’t work well during strong trends or volatility, nothing is ever guaranteed, and most retail traders lose money.
What Grid Trading Is
Grid trading is when you set multiple buy orders below the market and sell orders above at certain intervals. Orders are executed and closed gradually when the market moves across the ladder.
New orders can be placed again to keep the grid going. The objective of grid trading is to profit from movement instead of direction.
So what is grid trading ? It is a system that buys on downtrends and sells on uptrends in a predetermined zone.
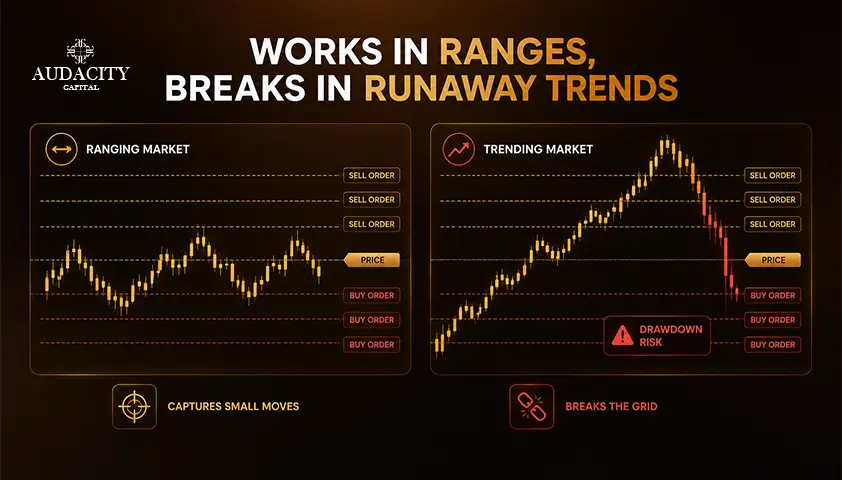
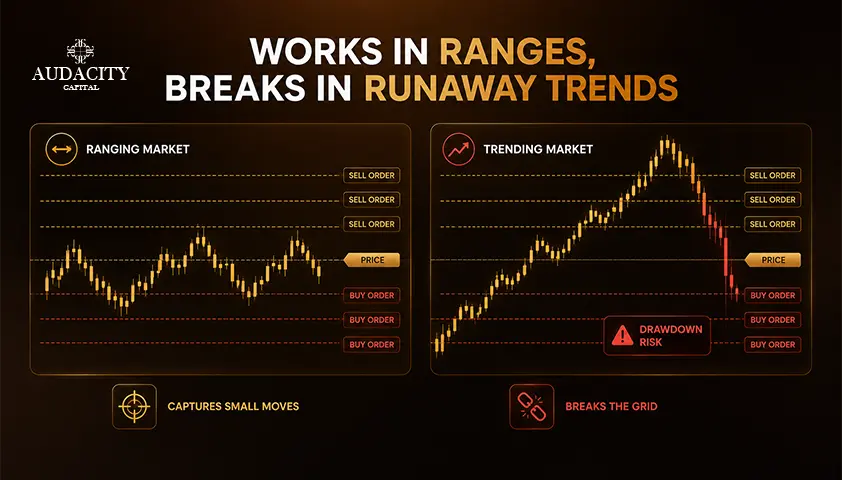
A regular range grid trading can be considered a mean-reversion strategy with short-volatility characteristics, which benefits from continuous oscillations. Losses accumulate as price trends away from the grid.
The grid trader does not try to predict whether the price will go up or down. The assumption here is that the price will keep oscillating within a certain range.
How to Set Up a Grid?
There are four parameters for the grid trading system.
- Range: the upper and lower price levels in which the price is supposed to oscillate.
- Grid spacing or distance: the distance between orders, expressed in pips.
- Number of levels: the number of buy and sell orders that are above and below the price levels.
- Lot size per level: the position size at each order.
Collectively, all four parameters define the trade frequency, the amount earned from each trade closure and the risk in case of an adverse price movement against the grid.
Spacing is the parameter that requires serious consideration. Fixed spacing does not take into account the fluctuations in market conditions; the grid optimized for a relatively quiet week might become too narrow when the volatility increases.
A good idea would be to make the spacing dependent on the volatility. For example, traders can use a multiple of the Average True Range (ATR) on their chosen timeframe.
In this way, the grid will be adjustable to volatility rather than using the same distance in any market environment.
All numbers presented in the grids' tutorials, including the ones in this guide, are illustrative only. It is strongly recommended to backtest any spacing, level amount or lot size on both quiet and trending markets.
The Types of Grid
There are several types of grids that differ in how they work.
1. Neutral or range grid
The traditional version. Buy orders below the base price, sell orders above it, and assume the price will fluctuate within a certain range. Profit from each round trip equals the amount defined by the grid parameters.
The orders that went against the price can be kept open till a reversal occurs. This is the grid best known in connection with forex grid trading on trending currency pairs during quieter sessions.
2. Trend-following grid
This type of grid is basically opposite to the neutral one. Orders are aligned in accordance with the trend so that the grid increases the size of a profitable position on pullbacks. It solves the main problem of the neutral grid, however, it still needs the right identification of the trend, which always comes to its end.
3. Dynamic grid
Spacing and level count depends on the detected market volatility that usually is driven by ATR. The logic behind this approach is that the grid will become wider as the market speeds up and narrower as it slows down.
4. Martingale or geometric grid
This is the modification to watch out for. In the martingale or geometric grids, the lot size grows as the price moves against the opening trade. Every level of the grid is bigger than the previous one.
Exposure can therefore grow exponentially, leaving the account dependent on a reversal before margin runs out.
A standard grid may still have martingale sizing. The way to detect that is by comparing sizes of new positions to those that were opened earlier. Do not consider just the label given by the EA.
A martingale grid does not recover losses safely. It defers them, and it enlarges them, until either the reversal arrives or the account does not survive.
Where It Breaks
The failure of the approach is inherent in the strategy. A grid strategy works well when price is oscillating. Problems arise when a powerful trend emerges. The price can then move up or down through several grid levels without turning around.
Every new level results in one more losing trade. The drawdown becomes deeper, the further price goes. It may continue indefinitely unless the strategy has a hard stop-loss or maximum-drawdown rule.
Why the equity curve can deceive
Then there is the equity curve, which can silently deceive most of the traders who use grid bots. In oscillating market conditions, the strategy may generate a continuous series of small closed winners. The equity curve would appear almost perfect.
Historical data can lead to the same conclusion when backtesting in calm periods. However, the graph only tells half the story because it doesn't provide any information on the floating loss that the grid has. In addition, the usual backtest may not reflect the real extremes.
In case the grid experiences shock move
This particular example of the shock move is worth taking into account. On 15 January 2015, the Swiss National Bank abandoned the EUR/CHF floor without warning. The pair fell thousands of pips in minutes on illiquid quotes. That is the kind of move that can ruin a grid. Price moved sharply in one direction while opposing positions were already open across the ladder.
In such conditions, a hard stop may not fill anywhere near its intended level. Any account running a grid without strict risk limits during that event was exposed to a move the strategy could not easily absorb.
Two factors can make the situation much worse.
1. Martingale-style sizing:
It increases exposure as the market moves against the grid and makes the account increasingly dependent on a reversal.
2. No hard stop:
Without one, a sustained trend can push the account toward a margin call. Undercapitalization, trending markets, and high-impact news can make the problem worse.
The main problem is structural. Grid trading collects small profits while carrying the risk of much larger losses. A strong trend can expose that weakness quickly. No grid configuration can remove this risk completely.
What (Barely) Makes It Survivable?
%20Makes%20It%20Survivable__webp__orig.webp)
None of the following turns a grid into a safe system. They reduce risk. They do not remove it.
1. A hard maximum-drawdown stop.
A rule that closes the entire grid at a defined loss, in currency or percentage, so no single trend can run the account to zero. This is the single most important control.
2. A range or trend filter.
Do not run a range grid into a trend. A simple regime filter, for example an ADX threshold or a moving-average slope check, is a starting point.
3. Volatility-based spacing.
ATR-driven intervals rather than fixed pips, so the grid adapts to the current market.
4. No martingale sizing.
Fixed lots per level keep drawdown linear and calculable.
5. Adequate capitalization.
Sized to survive at least the worst historical drawdown for the pair and settings you are using, with room to spare.
6. A news filter.
Pause the system around high-impact releases and known event risk.
7. No hedging tricks that mask exposure.
A hedging grid that carries offsetting positions can look flat on paper while leaving swap costs and slippage risk fully in place.
The prop-firm point is worth highlighting. Many funded-trader programs restrict or ban grid and martingale strategies outright under their prohibited-practices rules, so a system that runs fine on a personal account can breach the terms of a funded account and cost the trader the capital allocation.
Confirm each firm's rules at the source before running anything grid-adjacent on funded capital.
Once you cap a grid with a hard stop, tight filters, conservative sizing, and adequate capital, you give up much of what made it attractive in the first place.
What remains should be judged like any other risk-managed system. It still depends on genuinely range-bound conditions and strict limits.
Backtest across trending and extreme periods, not just calm ones. Treat the worst historical drawdown as a reference point, not a maximum expected loss.
Conclusion
Grid trading places orders at set intervals and aims to profit from price oscillation without predicting direction. It can produce steady small wins when the market stays within a range.
The problem is the open drawdown. A sustained trend or shock move can push the grid into heavy losses. That risk is a defining feature of the strategy, not a rare exception. The smooth equity curve does not tell you otherwise. It just delays the story.
If the strategy is used, keep it to confirmed range conditions and use strict risk limits. A hard maximum-drawdown stop, volatility-based spacing, fixed position sizes, and adequate capital are essential.
Traders using funded accounts should also check the firm's prohibited-practices rules.
Backtest across trending and extreme periods before anything goes live. Treat grids as a specialized tool with real risk, not a system that profits in any market.
Frequently Asked Questions
It can produce steady small profits in genuinely ranging markets, but it carries open, potentially unbounded drawdown and fails in sustained trends. Profitability depends on how the system is designed and how much risk it takes. A hard maximum-drawdown stop can limit losses, but results are never guaranteed. Most retail traders lose money regardless of strategy.
No trading strategy is safe, and grids are specifically risky because a strong trend accumulates losing positions with no take-profit on that side of the ladder. Without a hard maximum-drawdown stop, a single sustained move can run the account to a margin call. Even with strict limits, the approach is only viable in range-bound conditions.
Accumulating small wins during oscillating periods produces impressive equity curves on calm historical data, which is exactly the environment the strategy is built for. Standard backtests often underweight or entirely miss the extreme trending sequences and black-swan events that create the real worst-case drawdown. A backtest that has not been stressed against those conditions is not evidence the system is robust.
Range-bound conditions suit it, and traders often run grids on ranging currency pairs during quieter sessions such as the Asian window. Trending markets, high-impact news windows, and thin-liquidity periods are exactly where the strategy breaks. A regime filter that keeps the grid off during those conditions is essential rather than optional.
Many traders base grid spacing on volatility, such as a multiple of the Average True Range (ATR). This allows the grid to adapt to changing conditions instead of relying on a fixed pip distance. Level count, lot size, and take profit per level should all be tuned together, not in isolation. Any setting should be backtested across calm, trending, and extreme periods before use.
Many restrict or ban grid and martingale strategies under their prohibited-practices rules, so a grid that runs fine on a personal account can breach the terms of a funded account. Rules differ between firms and can change, so check each firm's prohibited-practices page at the source before deploying anything grid-adjacent on funded capital.
Yes. A sustained one-way move with opposing grid positions already open and no hard stop can run an account to a margin call, and gap-driven shocks can do it faster than any manual intervention. The 2015 Swiss National Bank unpegging of EUR/CHF is the textbook example, and it is not the only one on record.

Pronto para aplicar risco disciplinado em cripto? Explore os novos instrumentos de cripto da Audacity Capital e traga sua estratégia de trading.
Saiba MaisNewsletter
Junte-se ao nosso boletim para ficar atualizado.
Junte-se à Nossa Comunidade Social

Comece Sua Jornada Hoje Com Nosso Teste Gratuito
Mostre com orgulho suas habilidades e conquistas através de certificados e obtenha reconhecimento pelo seu trabalho árduo e dedicação de potenciais investidores e colegas.
Teste GratuitoArtigos Relacionados
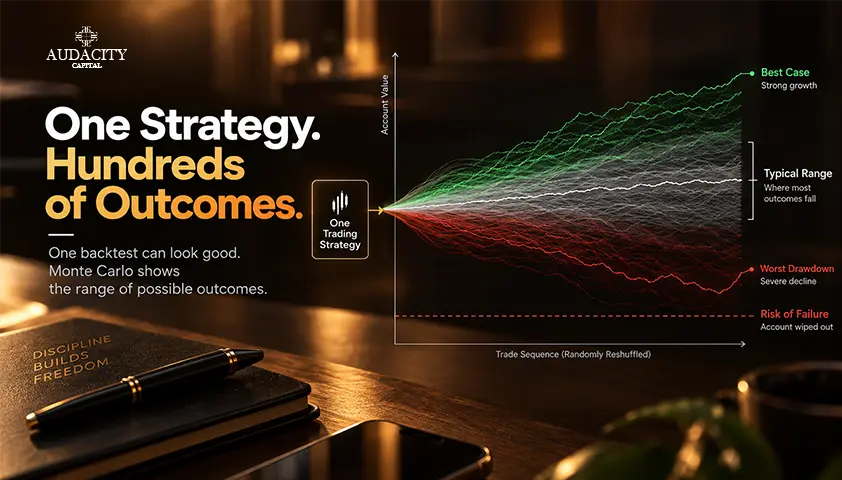
How to Stress-Test a Trading Strategy With Monte Carlo
Learn how Monte Carlo simulation reshuffles trades, estimates drawdown and losing-streak ranges, and tests a strategy beyond one backtest.


All About the Shooting Star Candlestick Pattern – Learn to Decode It
Learn what the shooting star candlestick pattern means, how to identify it, confirm bearish reversal signals, and manage trading risk.
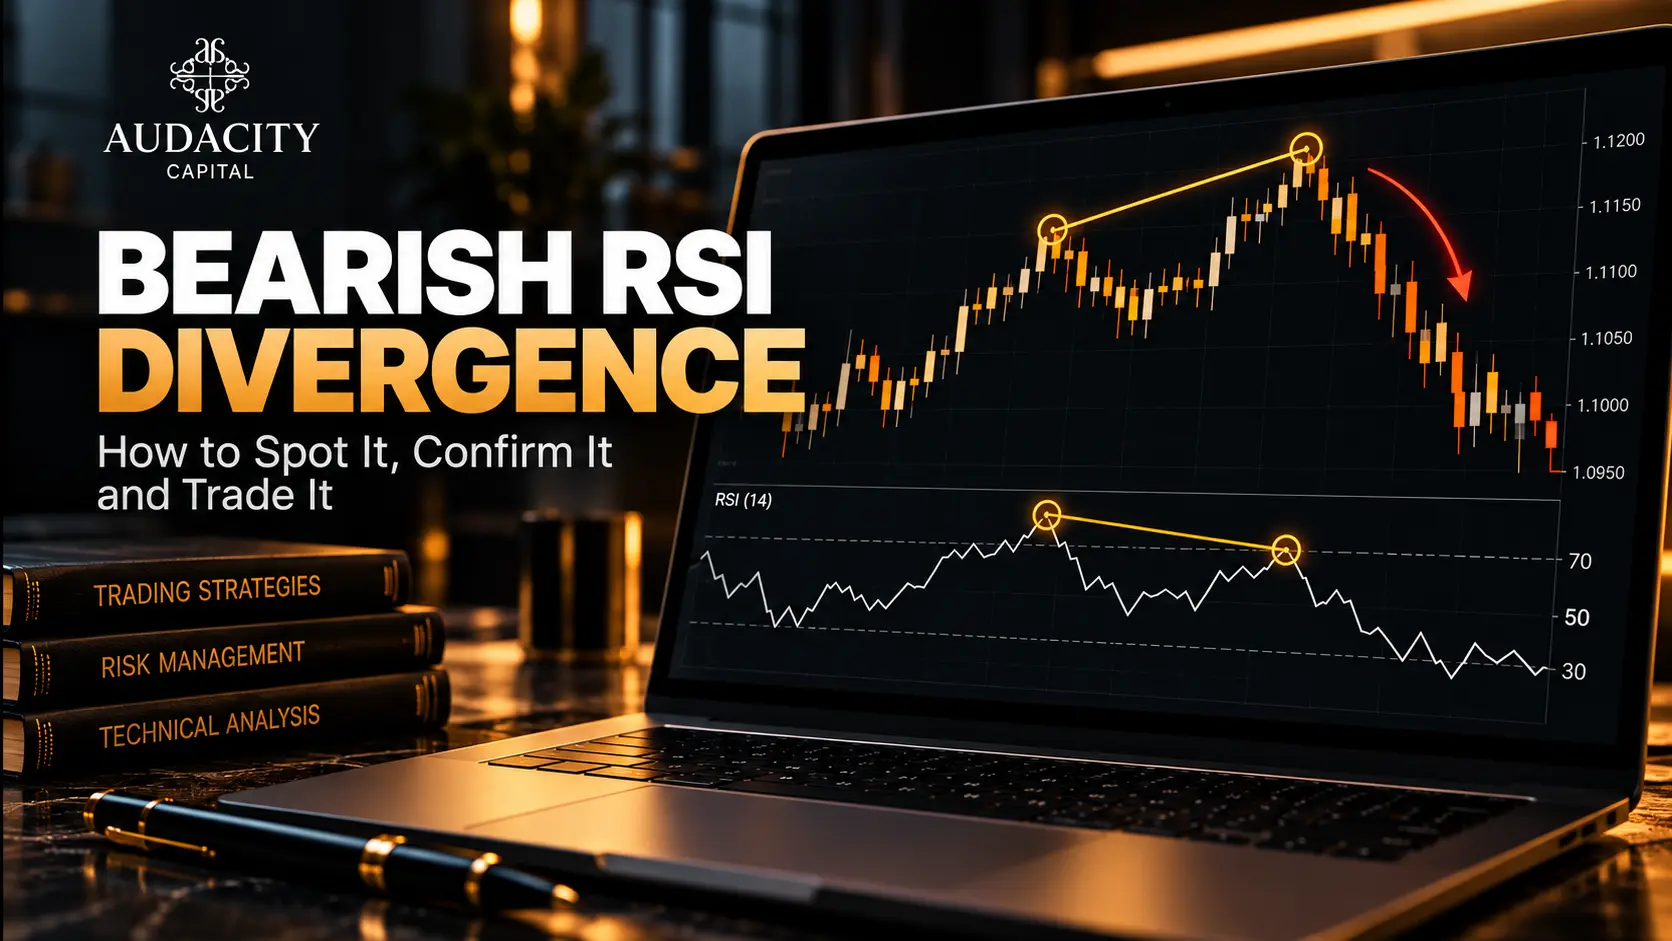
Bearish RSI Divergence: How to Spot It, Confirm It and Trade It
Learn how to identify bearish RSI divergence, confirm reversal signals, plan entries and exits, and manage risk with practical forex trading examples.
Risk of Ruin in Trading: Formula, Examples and How to Reduce It
Learn what risk of ruin in trading means, how the formula works, what affects it, and how position sizing can reduce the chance of account failure.