


How to Stress-Test a Trading Strategy With Monte Carlo



Picture two traders with the same 200 trades and the same final profit. The only difference is the order. One account climbs steadily and finishes strong.
The other opens with a cluster of losses, sinks into a deep drawdown, and breaches its risk limit before the winners arrive.
A backtest shows you one realized path. Monte Carlo simulation asks how that path, or the sample behind it, might differ under assumptions you declare in advance.
This guide covers what to randomize, how to run the test, how to read drawdown and losing-streak percentiles, and how to use the output without treating it as a forecast.
What Monte Carlo Simulation Adds to a Backtest
In trading, a Monte Carlo test repeatedly randomizes defined parts of a strategy test to produce a distribution of possible equity paths and risk outcomes.
It shows how sensitive a result is to trade order, sample composition, execution assumptions, or another uncertainty you choose to examine.
It does not create new market evidence. Everything it reports comes from its inputs and its model.
This article focuses on one input: a completed, net-of-cost historical trade log from a fixed strategy. Most Monte Carlo simulation trading tools work at this level. Other models simulate returns, prices, volatility, or strategy parameters.
Those answer different questions and rely on different assumptions, so treat them as separate exercises.
The value lies in what one equity curve hides. A single backtest reports one maximum drawdown, one longest losing streak, one terminal return, one stretch of time under water, and one yes-or-no answer on whether a loss threshold was breached.
Simulation turns each of those single values into a distribution.
That distribution measures outcomes under the specified sample and randomization rule. It does not reveal the true risk of a strategy, validate an edge, or predict the next equity curve.
Choose What to Randomize Before You Run It
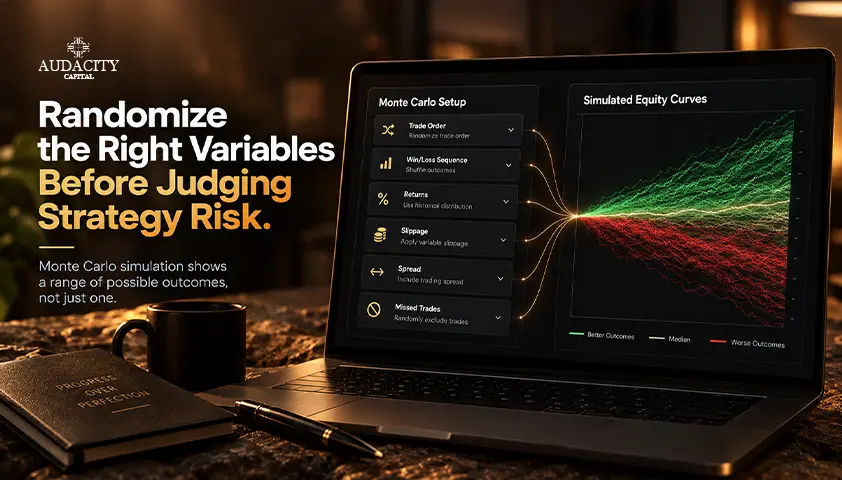
Pick the randomization method before you look at any results. Each method preserves some features of your data and breaks others, so the method determines which question the output can answer.
If a platform offers a single Monte Carlo button without explaining its sampling rule, treat the output as incomplete information until you know exactly what it did.
A Monte Carlo trading simulation is only as informative as its declared rule.
Table 1: Randomization methods and the questions they answer
Method | What changes | What stays fixed | Question it can answer |
Permutation without replacement | Order of the recorded trades | Every trade appears once | How much did the observed sequence affect path metrics such as drawdown and streaks? |
Bootstrap with replacement | Order and frequency of recorded trades | Trade count and empirical outcome pool | How variable could metrics be if the sample were drawn again under an IID assumption? |
Block or regime-aware bootstrap | Order of groups, or order within declared regimes | Some local dependence or regime structure | How do results change when clustering is partly preserved? |
Execution perturbation | Costs, slippage, delays, fills, or missed trades | Strategy signals and the declared shock model | Does the edge survive plausible execution degradation? |
Parameter or price-path simulation | Rules or a synthetic market path | The chosen model and parameter ranges | How sensitive is the strategy to assumptions outside the recorded trade list? |
Shuffling Is Not Bootstrapping
A permutation uses every observed trade exactly once and changes only the order. With fixed additive sizing, such as a constant dollar or R amount per trade, terminal P&L and profit factor stay identical on every path.
Path-dependent metrics like drawdown and losing streaks are what move.
A bootstrap uses sampling with replacement. Some trades appear two or three times in a path while others vanish, so terminal outcomes and sample statistics such as win rate and profit factor can change too.
Bootstrap resampling trading records this way approximates drawing a fresh sample from the same process, assuming trades are independent and identically distributed (IID).
Sizing adds a wrinkle. Pure fixed-fractional compounding on R-multiples happens to be order-independent at the finish line, because multiplication does not care about sequence.
Once sizing reacts to the path through drawdown-based cuts, daily stops, or stop-on-breach rules, even a pure permutation can change the ending value.
Preserve Dependence When It Matters
Trades are rarely fully independent. They cluster by volatility, trend, session, instrument, or overlapping exposure, and losses often arrive in groups when a regime turns against the strategy.
Independent resampling scatters those clusters across the path, which can understate streak length and portfolio-level risk when serial dependence is present.
A block bootstrap samples consecutive runs of trades rather than single trades, keeping some local structure intact. Regime-aware sampling draws within labeled market conditions. Both are partial remedies.
They retain the dependence you chose to preserve, but neither produces a faithful copy of future markets.
Use Separate Tests for Separate Uncertainties
Report sequence, sampling, execution, and parameter stress as separate panels. Parameter perturbation, for example, tells you nothing about trade order, and a reshuffle tells you nothing about wider spreads. Mixing them hides which uncertainty drives the result.
Avoid blending everything into one opaque robustness score unless every assumption and weighting is documented.
Prepare a Trade Log the Simulation Can Trust
Use one row per completed trade. Useful fields include timestamp, instrument, direction, net P&L, R-multiple where available, initial risk, position size, holding period, costs, strategy version, and tags for setup or regime.
If positions overlap, keep a portfolio timestamp so concurrent exposure stays visible. Leave open trades out of a closed-trade simulation unless your method models them explicitly.
Then clean it. Remove duplicates, resolve missing exits, standardize currencies and units, and confirm that spread, commission, slippage, and financing are included. Reconcile wins and losses back to the source backtest.
Do not merge different rules, sizing schemes, instruments, or in-sample and out-of-sample data without an explicit reason.
For a deployment decision, prefer untouched out-of-sample data or a stitched walk-forward trade series. If only in-sample trades exist, label the results exploratory. Protect a final holdout from repeated redesign.
This is why sound Monte Carlo backtesting starts with the log, not the simulator.
Finally, plot outcomes through time and by regime. Check for overlapping trades, autocorrelation, clustered losses, and profits concentrated in a handful of trades.
The goal is to choose an honest sampling unit, not to pass a significance ritual.
Run the Simulation and Check That It Has Stabilized
A disciplined trading strategy stress test follows the same sequence every time:
- Freeze the strategy and the decision rule you will apply to the results.
- Select the source sample, ideally out of sample.
- Declare the randomization method, plus any block length or regime labels.
- Preserve the actual sizing and cost rules.
- Generate paths of a stated length.
- Calculate the same metrics on every path and store the random seed or full configuration.
Do Not Worship a Fixed Iteration Count
Many guides recommend 1,000 or 10,000 runs as if those figures were rules. More paths reduce Monte Carlo sampling noise, but they do nothing to improve the source data.
Start with a practical count, rerun with several different seeds, then keep increasing the count until the percentiles and breach estimates you will actually use change by an acceptably small amount.
Tail percentiles usually need more paths to settle than medians. Report that convergence check alongside the results.
Match the Path Length to the Decision
A 50-trade path and a 500-trade path answer different questions. Set the length to the horizon you care about: your next review period, an evaluation window, or the number of trades you expect before reassessing. State it beside every result.
If trade frequency changes over time, a trade-count horizon may not map cleanly to calendar days.
Reapply Path-Dependent Rules
If you risk a percentage of equity, scale with equity, use daily stops or kill switches, or cut size after drawdowns, recalculate position size trade by trade along every simulated path.
Reshuffling fixed dollar P&L and then claiming the result represents compounding or a funded-account rule mixes two different models.
For reproducibility, record the software version, input file checksum, seed or seed policy, number of paths, path length, costs, block length, shock distributions, and every threshold.
Keep the base backtest beside the simulation output so readers can compare the realized path with the simulated range.
Read the Distribution, Not the Most Dramatic Curve
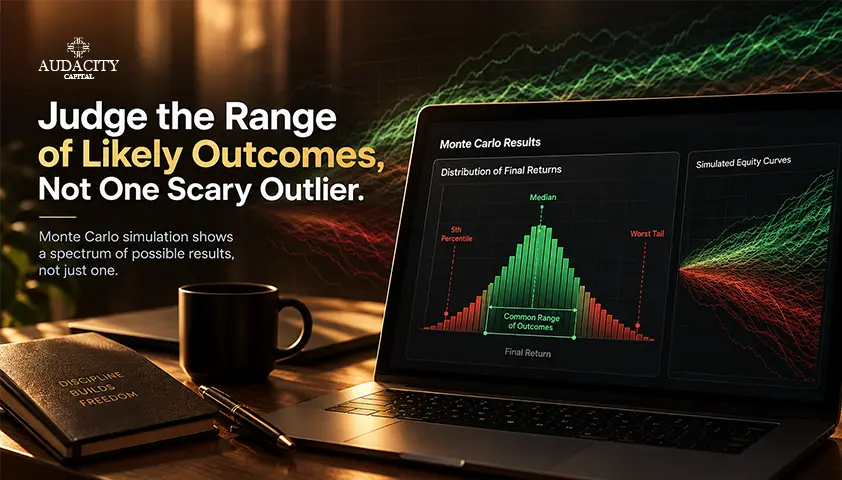
A useful report summarizes all simulated paths. Do not showcase one attractive curve, and do not label the single worst generated path as the worst case.
The simulation covers a finite number of paths and remains conditional on its model, so a more adverse path is always possible.
Table 2: Reading a Monte Carlo drawdown and outcome report
Output | How to read it | Decision use |
Terminal return or P&L | Median plus lower-tail percentiles and the share of paths finishing below a chosen level | Expectation range and capital allocation |
Maximum drawdown | Median plus upper-tail adverse percentiles and the share of paths exceeding a limit | Risk buffer and position size |
Longest losing streak | Distribution of the maximum consecutive losses in each path | Operational and psychological tolerance |
Time under water | Time or trades from an equity peak until recovery | Review horizon and shutdown policy |
Threshold breach | Share of paths touching the exact defined balance or equity rule | Funded-account or capital-preservation planning |
Profit factor or expectancy | Unchanged under simple permutation; variable under bootstrap or execution shocks | Separating sequence risk from sample or cost uncertainty |
Translate Percentiles Into Exceedance Statements
Percentiles only make sense with a direction. For an adverse metric such as maximum drawdown, higher values are worse. If the 95th-percentile maximum drawdown is 14%, about 5% of simulated paths exceeded 14% under the stated model.
That share is the simulated exceedance probability for that level. For terminal return, the lower tail is the adverse side, so the 5th percentile marks the level that about 5% of paths finished below.
Write the metric, percentile direction, horizon, and method together, for example: "95th-percentile maximum drawdown, 200-trade horizon, IID bootstrap, 1% fixed-fractional risk."
Separate Percentile From Confidence
Not every band on a chart is a confidence interval. A path-outcome percentile describes the spread of generated outcomes. A bootstrap confidence interval estimates uncertainty around a statistic, such as expectancy, under a specific sampling procedure.
The bootstrap distribution of a statistic and the distribution of path outcomes are different objects. Use the term your method and software actually produce, then define it in the report.
Treat Breach Probability as Model Output
The fraction of paths that touched a threshold is a model output, not a timeless probability. A Monte Carlo risk of ruin figure shifts with starting capital, sizing, path length, sampling rule, costs, threshold mechanics, and the input sample.
Report the count of breached paths and the total number of paths, add confidence limits where appropriate, and avoid spurious decimals. "About 3%" communicates more accurately than a figure carried to three decimal places.
Use the Tail to Set Risk and Breach Buffers
Start from the maximum loss you are willing or allowed to absorb. Then leave an operational buffer for slippage, gaps, correlated positions, delayed exits, and model error.
Scale position risk down and rerun the simulation, because compounding and rule mechanics can make the relationship between risk per trade and drawdown nonlinear.
Model the Actual Breach Rule
For a personal account, define ruin as a chosen capital floor, not automatically zero. For a funded account, model the current breach threshold precisely: balance or equity basis, daily or overall limit, static or trailing logic, reset time zone, treatment of floating P&L, fees, and whether trading stops after a breach.
If you trade an Audacity Capital funded trader program such as the Ability Challenge (2 step), Ability One (1 Step), or the FTP (Instant Funding), take these details from the current program rules rather than from memory.
If the exact rule is unavailable, use a clearly labeled hypothetical threshold instead of guessing.
Predeclare an Action Ladder
Use the results to set green, review, reduce-risk, and stop states before live trading begins. Then compare actual drawdown, streak length, costs, and trade-distribution drift with the simulated reference range.
A live result outside the band triggers investigation. It does not prove the next trade will reverse, and it does not prove the strategy is permanently broken.
Avoid sizing right up to the simulated limit. A low simulated breach frequency does not mean an account cannot fail. Correlated positions, regime shifts, data errors, and events absent from the sample can dominate the tail.
When Monte Carlo Gives False Comfort
Most Monte Carlo analysis trading guides skip this part. A simulation can look rigorous while quietly repeating a flaw in its design. These failure modes are specific to how the test is built.
Failure mode | Why it misleads and what to do |
Overfit input | Resampling a strategy selected from many failed variants repeats selection bias. Use protected out-of-sample evidence and record the research search. |
IID assumption | Independent draws break clustered losses, overlap, and regime persistence. Inspect dependence and test blocks, regimes, or portfolio-level sampling. |
Missing tail events | An empirical bootstrap cannot draw an outcome never observed. Add transparent scenario shocks and execution stress instead of calling the bootstrap exhaustive. |
Too few or concentrated trades | A few outliers can dominate the empirical distribution. Show their influence, segment results, and collect more independent evidence. |
Gross or idealized fills | Omitted spread, commission, financing, latency, gaps, and missed trades make every path too favorable. Stress net execution separately. |
Mixed strategy versions | Combining trades from changing rules creates a distribution no single live process produced. Freeze and label versions. |
One seed or unstable tail | Rare percentiles and breach rates can move between runs. Repeat seeds, increase paths, and report stability. |
Opaque software score | A grade without sampling, sizing, horizon, and threshold definitions cannot be audited. Export inputs and report assumptions. |
Overfitting deserves its own warning. Monte Carlo does not, by itself, detect whether a rule was mined from noise.
Research by Bailey and colleagues on the probability of backtest overfitting treats selection bias as a separate problem with separate tools. Keep a holdout, count your trials, and use walk-forward or other out-of-sample procedures.
A stress test can reject a fragile strategy, but passing one is not proof of an edge.
Regimes set a second boundary.
A future market may not resemble any resampled block. Market-generator approaches try to preserve return distributions, autocorrelation, and cross-asset dependence, but they introduce another model with its own estimation risk.
Treat them as an advanced extension, not the default recipe.
Put Monte Carlo in the Validation Stack

Monte Carlo answers a conditional variation question. It belongs after a clean backtest and alongside time-ordered and live validation, not in place of them.
Method | Primary question | What it does not establish |
Backtest | How did fixed rules behave on historical data? | How sensitive the path is, or whether results generalize |
Sensitivity test | Do nearby parameters or assumptions behave similarly? | Performance on unseen time periods |
Walk-forward analysis | Did a frozen or recalibrated process persist across later historical windows? | The full sequence and sampling distribution |
Monte Carlo strategy testing | How do outcomes vary under a declared randomization or shock model? | A new, independent market observation |
Paper or small live test | How does the frozen process behave on new data and real execution? | Long-horizon certainty or immunity to regime change |
A sensible order looks like this: define and backtest the strategy, protect out-of-sample data, run sensitivity and walk-forward checks where relevant, apply Monte Carlo to the final trade process, then observe paper or small live execution under unchanged rules.
If any layer prompts a redesign, retest without reusing the final holdout as if it were still unseen.
Conclusion
Monte Carlo simulation earns its place when you follow three rules: state exactly what was randomized, read the full distribution rather than one curve, and make the risk decision with an explicit buffer.
It stress-tests your assumptions and historical evidence. It is not a forecast or a guarantee. If you run EAs or copy-trading workflows, both allowed at Audacity Capital, build this discipline in before you apply for a funded account, and check current program rules first.
Frequently Asked Questions
It is repeated randomization of a strategy test under stated rules, producing a distribution of outcomes rather than one result. Common trade-level outputs include drawdown, losing streaks, terminal return, and breach rates. Every result depends on the input sample and model.
Let the question decide. Shuffle trade order to study sequence risk, bootstrap trades for sample variation, use blocks when trades cluster, and perturb execution to test costs or skipped fills. Report each panel separately and keep their conclusions distinct.
No universal count exists. Increase paths and repeat seeds until the percentiles and breach estimates you rely on stabilize within a tolerance you set in advance. More runs reduce simulation noise, but they cannot fix biased or incomplete input data.
No. It estimates a drawdown distribution under a given sample, sizing rule, horizon, and sampling model. A high percentile is not a ceiling. Live markets can produce larger losses, new dependencies, or events that never appeared in the historical data.
Not on its own. It can expose sensitivity to sequence, sampling, or execution shocks, but it may simply resample an already overfit trade list. Protected out-of-sample testing and a transparent record of every strategy variant tried remain essential.
Neither replaces the other. Walk-forward analysis tests time-ordered parameter selection and whether performance persists. Monte Carlo tests variation under a randomization model. Use each where its assumptions match your strategy and the question you need answered.

Handa nang maglapat ng disiplinadong panganib sa crypto? Galugarin ang mga bagong instrumento ng crypto ng Audacity Capital at dalhin ang iyong diskarte sa pangangalakal.
Matuto PaNewsletter
Sumali sa aming newsletter.
Sumali sa Aming Social Community

Simulan ang Iyong Paglalakbay Ngayon Gamit ang Aming Libreng Pagsubok
Ipagmalaki ang iyong mga kasanayan at tagumpay sa pamamagitan ng mga sertipiko at makakuha ng pagkilala para sa iyong pagsusumikap at dedikasyon mula sa mga potensyal na mamumuhunan at kasamahan.
Libreng PagsubokMga Kaugnay na Artikulo

RSI Divergence: A Complete Guide to Spotting and Trading Momentum Shifts
Learn what RSI divergence is, explore bullish, bearish and hidden divergence, and discover how to identify, confirm and trade RSI divergence.

Walk-Forward Analysis in Trading: A Practical Guide
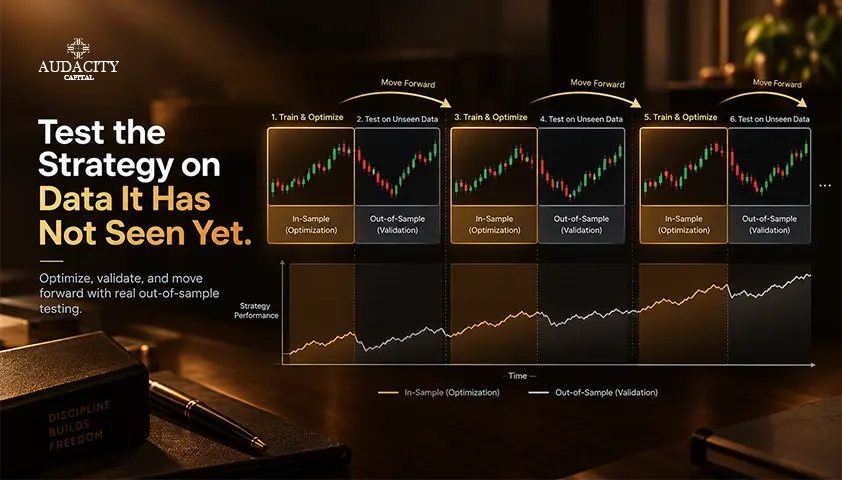
Learn how walk-forward analysis works in trading: in-sample and out-of-sample windows, rolling vs anchored designs, a worked example, and how to read results.
Risk of Ruin in Trading: Formula, Examples and How to Reduce It
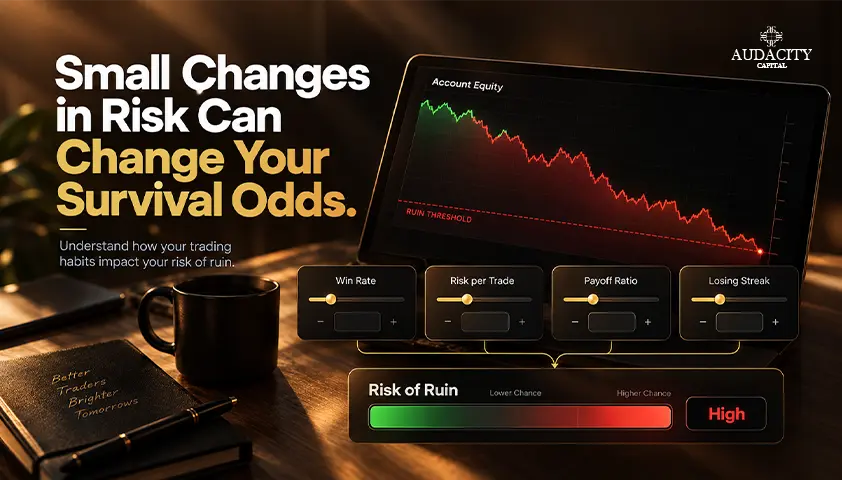
Learn what risk of ruin in trading means, how the formula works, what affects it, and how position sizing can reduce the chance of account failure.
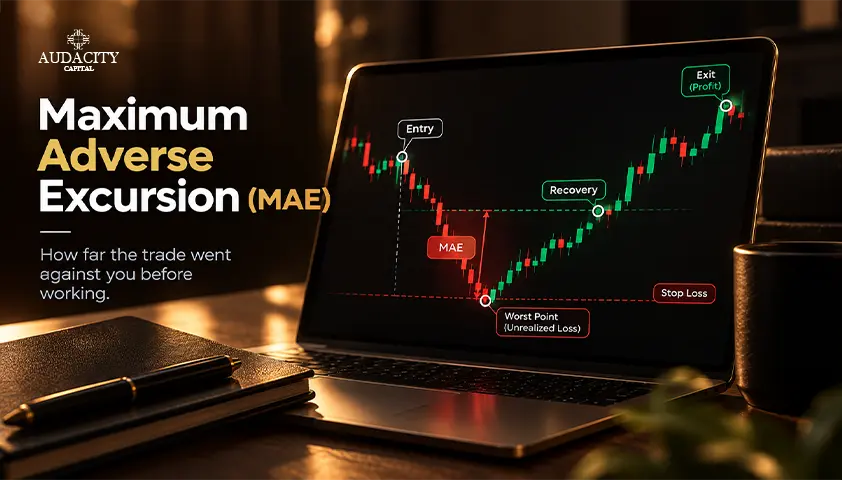
Maximum Adverse Excursion Explained for Traders
Learn how maximum adverse excursion measures a trade's worst open loss, how to calculate MAE, read charts, test stops, and avoid common errors.