


Elliott Wave Theory: How to Identify and Trade Wave Patterns


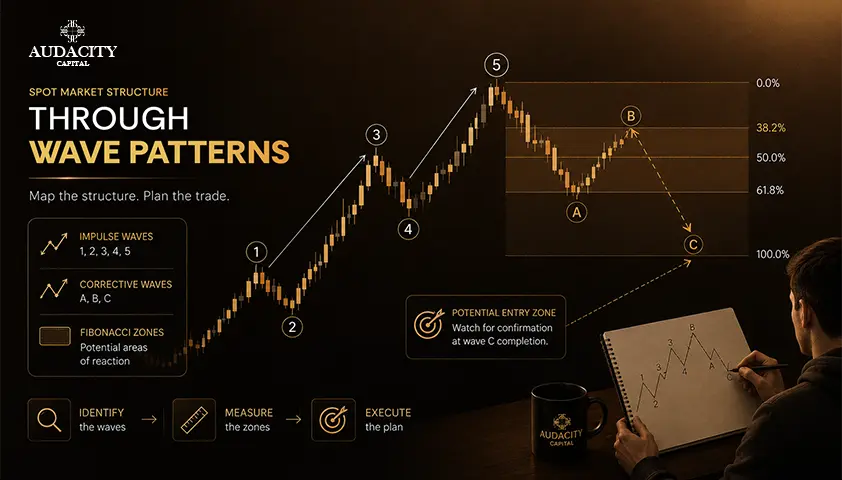
Elliott Wave Theory is a technical analysis framework that categorizes price movements into motive and corrective waves. The most famous model describes five waves that move with the larger trend, followed by a three-wave correction against it.
Traders utilize this framework to understand where a market could be within a larger trend, but not to predict specific turning points.
In this guide, we will explain the basics of the 5-3 cycle and the main corrective patterns. We will also review the strict criteria that invalidate an impulse count. Finally, we will explain how traders use Fibonacci ratios and turn wave analysis into a risk-defined trade scenario.
The objective is to provide a practical process for identifying valid counts, rejecting broken ones and separating analysis from execution.
What Is Elliott Wave Theory?
Elliott Wave Theory is the work of Ralph Nelson Elliott, who formulated his theory in the 1930s. Elliott Wave Theory proposes that collective trader behavior causes repetitive price movements.
This repetitive behavior occurs on all levels of price charts, from intra-day to multi-year charts.
The main principle of the theory separates the movement along the higher degree trend from the movement against it. The motive wave moves along the trend, while the corrective wave moves against it.
In total, these two wave types create the famous 5-3 structure: five waves along the trend, three against it.
The structure is fractal because each wave can have its wave structure. Several small waves may constitute one big wave.
It allows the framework to describe price at any timeframe. However, the same chart can receive different labels depending on the wave degree being analyzed.
How the 5-Wave Impulse and 3-Wave Correction Work
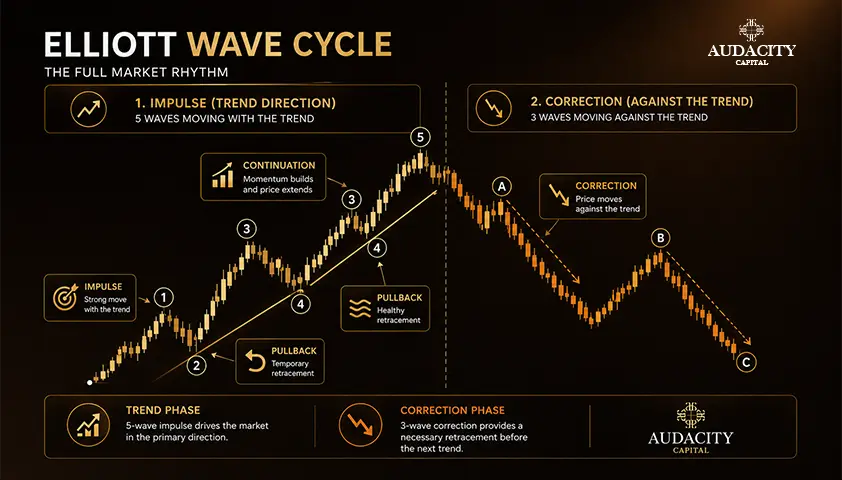
The basic structure starts with a five-wave motive sequence followed by a three-wave correction. During a bullish trend, waves 1, 3, and 5 follow the overall trend upward, with waves 2 and 4 correcting some of the previous wave movement. The end result is a 5-wave pattern moving the price considerably higher during its entire course.
Following the motive sequence is usually a correction with an ABC structure. Waves A and C follow the overall direction of the correction, while wave B opposes it. This correction can take a simple or complex form. Not all corrections will form a standard A-B-C pattern.
During a bearish larger trend, the same overall structure is inverted. Waves 1, 3, and 5 follow the overall trend downward, with waves 2 and 4 being countertrend bounces. The following A-B-C correction moves against the downtrend before the larger sequence potentially resumes.
The 3 Elliott Wave Rules That Invalidate an Impulse Count
There are three definite rules of elliott waves that define a regular impulse. In case any of these rules does not apply, then the wave count can be considered invalid. The wave count should not be manipulated to comply with the rules.
Rule 1: Wave 2 must not exceed the start of Wave 1.
If the price goes beyond the starting point of Wave 1, it means that the wave pattern is not a valid impulse and something different is taking place.
Rule 2: Wave 3 must not be the shortest of Waves 1, 3, and 5.
Usually, Wave 3 is the longest wave of all. However, it must not be the shortest out of the three motive waves.
Rule 3: Wave 4 cannot overlap Wave 1 price territory in a standard impulse.
If Wave 4 enters Wave 1 territory, the impulse count is invalid.
The rules are more important than similarity to the diagram. Diagrams may look like an impulse pattern but actually be something else entirely. A violation of any rule is a reason to reconsider the count. It is not something to explain away.
Diagonals caveat: Leading diagonals and ending diagonals are both motive patterns. They exhibit different overlapping properties.
Wave 4 is allowed to overlap Wave 1 territory in the context of a diagonal pattern. Consider diagonals as a separate variant rather than a loophole to the standard impulse rules above.
Elliott Wave Degrees and the Fractal Problem
Since the pattern itself is fractal, one can construct a count at many levels of resolution from the same chart. The level being analyzed is called the wave degree. A five-wave move can be contained within a larger corrective wave on a daily chart.
This is one reason why two competent Elliott Wave analysts will often mark up the same price moves in different ways and yet stay aligned with themselves.
The simple solution here is to clarify the time frame and degree of analysis before making any marks. The counting must start from well-defined swing points on a chart of the next higher time frame.
If it is difficult to identify the higher timeframe pattern, then the lower timeframe analysis is built on weak grounds.
The price does not necessarily have to confirm one interpretation quickly. A serious Elliott Wave trader can work with a primary and an alternative count till the structure clarifies.
Keeping the alternates in mind helps avoid justifying a count that is being invalidated by subsequent price action.
Motive and Corrective Elliott Wave Patterns
The elliott wave theory categorizes patterns into two groups namely the motive patterns which move in line with the overall trend and the corrective patterns which move contrary to the trend.
The motive patterns comprise the standard impulse pattern and the diagonal pattern. These two patterns move in line with the overall trend.
The standard impulse pattern satisfies the three hard rules mentioned above while the diagonal pattern is wedge-like having overlapping waves and convergence or divergence structure.
It typically appears at the start of a trend as a leading diagonal or at the end as an ending diagonal.
There are several different forms of corrective patterns. The important elliott wave patterns under the corrective category are the zigzag, the flat and the triangle.
Pattern | Broad structure | Typical role | Key identification caution |
Impulse wave | Five-wave motive sequence | Advances the larger trend | Must satisfy all three hard rules |
Diagonal | Overlapping five-wave wedge | Motive, often at trend start or end | Do not confuse with a failed impulse |
Zigzag correction | Sharp A-B-C, 5-3-5 internal | Sharp counter-trend move | Wave B does not retrace all of A |
Flat correction | Sideways A-B-C, 3-3-5 internal | Consolidation against the trend | Wave B can approach the start of A |
Triangle correction | Five-wave contracting or expanding | Typically Wave 4 or Wave B | Not a motive structure |
Combinations pair simpler corrective patterns into a more complicated setup. The implication of this in terms of trading is simple: Corrections tend to be much more varied than impulses. This is when Elliott Waves become most subjective.
How to Identify an Elliott Wave Count Step by Step
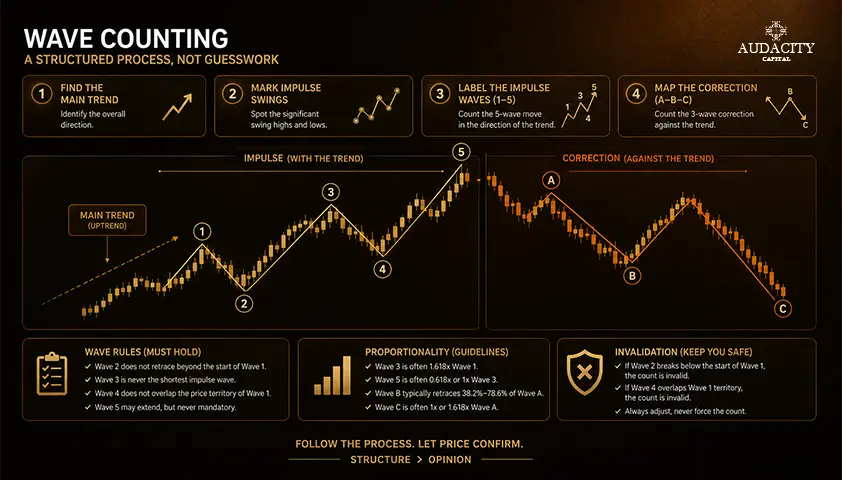
The procedure of counting waves is a process, not an instantaneous picture.
Step 1: Determine the trend on a higher timeframe.
Identify clear swing highs and lows on a timeframe above your trading timeframe. The direction of this trend is the direction that the motive wave should take.
Step 2: Recognize a five-wave sequence.
Try to find the definite pattern of five waves with obvious pivots, not every little movement. If you are squinting your eyes to recognize the pattern, the count is probably not real.
Step 3: Apply the three strict rules for impulsive moves.
Test the candidate against each rule. If any rule breaks, drop the impulse interpretation.
Step 4: Observe the internal swings.
Usually, a motive wave has its own smaller five-wave structures within Waves 1, 3 and 5. Corrective waves have three-wave internals. The internal pattern that contradicts the label makes the count weaker.
Step 5: Identify the invalidation point.
Every count has an individual invalidation price. Note it down in your chart before considering a trade.
Step 6: Develop at least one alternative count.
In case there is uncertainty about the pattern, describe the alternative count and its own invalidation level.
Let’s consider a hypothetical EURUSD example. The price increases from 1.0800 to 1.0950 in the clear five-wave structure. Then it retreats to 1.0880 and again increases to 1.0920. Your primary count might label the move to 1.0950 as Wave 1.
The pullback will be Wave 2, and the ongoing rally is an early Wave 3. The invalidation level is 1.0800, the beginning of Wave 1.
Should the price exceed 1.0880 before establishing a new high, then the alternative scenario will become more probable. It suggests that the advance may have been corrective rather than the start of a new impulse.
Automatic labeling algorithms can provide wave labels. However, it will still depend on your criteria, pivots, and time frame used. The software suggestion is just a hint and not a verdict.
How Fibonacci Ratios Are Used With Elliott Waves?
Fibonacci ratios are guidelines used once there is a proper interpretation of waves. They are not part of the hard rules, and a Fibonacci level will not save you if the wave count breaks down.
Fibonacci retracement is commonly used to gauge where a corrective wave might end relative to the prior motive wave.
Wave 2 often retraces a substantial portion of Wave 1, with 50% and 61.8% appearing frequently as reference levels. Wave 4 tends to be shallower or structurally different from Wave 2, often near 38.2% of Wave 3.
Fibonacci extension is used to project where a motive wave might travel. Wave 3 is frequently measured as 161.8% of Wave 1 or more. Wave 5 is sometimes projected from the length of Wave 1 or from the combined Wave 1 through Wave 3 distance.
Treat these numbers as examples of common tendencies, not guaranteed targets. The workflow is structure first, Fibonacci second. If the wave count is invalid, no ratio will fix it.
3 Practical Ways Traders Use Elliott Wave Patterns
The framework informs scenario planning. These are not "best trades," they are situations where elliott wave analysis may help define a thesis.
1. Wave 3: continuation after correction
After a candidate Wave 1 and a corrective Wave 2, traders may wait for renewed trend confirmation before treating the next leg as Wave 3. Wave 1's origin is the major invalidation reference. Wave 3 is only a working label until the structure begins confirming.
2. Wave 5: late-trend continuation/exhaustion
After Waves 1 through 4 appear valid, traders may look for one final motive leg. Late-trend risk is different from early-trend risk. Momentum divergence and exhaustion signals often appear near the end of Wave 5, and the reward-to-risk on a final leg is usually less generous than on Wave 3.
3. A-B-C: reversal/resumption after correction
After a corrective structure appears to complete, traders may watch for the larger trend to resume. The discipline is to wait for price confirmation rather than acting solely because a "C" label has been drawn.
How to Set Entries, Stops and Targets With Elliott Wave Analysis?
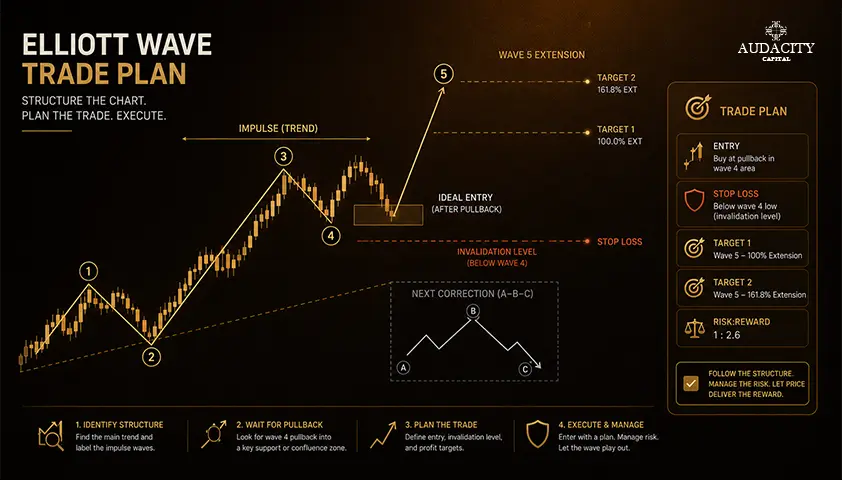
Elliott Wave Theory is an analytical framework, not a complete elliott wave trading strategy on its own. A live trade still requires a specific trigger, stop, position size and exit rule that sit on top of the wave interpretation.
Entry: Use a defined trigger such as a structure break, a reclaim of a broken level, a rejection at a prior swing, or another price-action signal after the wave scenario is established. The wave count identifies the scenario. The trigger identifies the moment.
Stop: Place it beyond the price level that invalidates the specific count or trade thesis, with room for normal volatility. A stop tucked inside the invalidation zone will often get hit on noise before the thesis is truly wrong.
Target: Use prior structure and Fibonacci projections as scenario levels, not promises. Multiple partial targets can help manage a trade if the wave count evolves.
Position sizing: Calculate size from the stop distance so a wider invalidation level does not silently increase account risk. If your risk per trade is 1R and the invalidation sits 40 pips away, your size is defined by that distance, not by an emotional sense of conviction.
A hypothetical example in R terms: entry at 1.0905 with a stop at 1.0875 gives 30 pips of risk. A first target at 1.0965 offers 2R. A second target at 1.1025 offers 4R.
If the count invalidates at 1.0800 rather than 1.0875, the appropriate response is a smaller position, not a wider risk tolerance.
Why Elliott Wave Counts Are Subjective?
Two competent analysts can assign different degrees or corrective structures to the same chart, especially before the pattern is complete. That is the strongest fair criticism of the framework, and it deserves a direct answer.
Three factors drive the subjectivity:
First, fractal nesting means a small pattern can be either a complete structure or a sub-wave of something larger.
Second, complex corrections have multiple valid variants that only resolve in hindsight.
Third, hindsight bias makes it easier to explain completed price action than to identify one unique real-time path.
A discipline framework helps. Maintain a primary and an alternate count. Attach an invalidation level to each. Avoid relabeling after every candle. Write down what would make you abandon the scenario before you enter, so you are not renegotiating the plan under pressure.
This is why serious educational sources note that Elliott Wave itself is not a trading technique with one fixed set of entries and exits. It is a way to organize context. The trade rules sit on top.
Common Elliott Wave Trading Mistakes
- Forcing every chart into a 1-2-3-4-5. Not every market is trending in a clean impulse. Sometimes the honest answer is that the structure is unclear.
- Ignoring a hard rule because the pattern "looks right." Visual bias is powerful. The rules exist to override it.
- Treating Fibonacci levels as guaranteed turning points. They are references, not floors and ceilings.
- Counting on only one timeframe. A count without a higher-timeframe anchor is fragile.
- Relabeling constantly after price moves against the thesis. If the count changes every session, it was never a count.
- Entering without a separate trigger and risk plan. A wave label is not an entry signal.
A valid wave count can still lead to a losing trade. Pattern validity and trade outcome are separate questions, and treating them as the same is one of the fastest ways to misjudge the framework.
Conclusion
The useful version of the elliott wave principle is not the pursuit of a perfect count. It is a structured way to organize trends and corrections, define where you are wrong, and plan alternative scenarios before price forces the decision.
A repeatable process looks like this: identify the larger trend, label only clear swings, apply the three hard impulse rules, keep at least one alternate count, define invalidation for each, and then apply a separate entry, stop and position-sizing plan on top of the analysis.
Elliott Wave does not remove uncertainty, and it does not predict markets. Used with discipline, it can sharpen how you read structure and how you manage risk when the market moves against you.
Trading involves substantial risk. This article is educational and does not constitute financial advice.
Frequently Asked Questions
The impulse count is invalid. Wave 2 retracing beyond the origin of Wave 1 breaks a hard rule, so the structure must be relabeled or rejected rather than defended.
Not in a standard impulse. Overlap is only permitted inside diagonal patterns, which are a separate motive variant with their own identification criteria.
Wave 3 often carries the strongest directional move and cannot be the shortest of Waves 1, 3 and 5. Many traders build scenarios around potential Wave 3 continuation because the structure between Wave 2 and Wave 3 provides a clear invalidation reference.
The framework applies to any timeframe because the pattern is fractal. That said, intraday counts are more prone to noise and wave invalidation, so anchoring to a higher-timeframe structure is important.
A count is wrong when it breaks a hard rule or when price trades through the invalidation level you defined. Relabeling instead of accepting invalidation is one of the most common mistakes in wave-based analysis.
No. Fibonacci retracements and extensions are guidelines used to describe possible relationships between waves. The three hard impulse rules stand on their own without any Fibonacci input.
Yes. Before a pattern completes, primary and alternate counts can both remain internally consistent. Disciplined analysts track both and let price action decide which one holds.
No. It is an analytical framework for organizing structure. A complete strategy still requires a separate entry trigger, stop placement, position sizing and exit rule layered on top of the wave interpretation.

Ready to apply disciplined risk to crypto? Explore Audacity Capital's new crypto instruments and bring your trading strategy.
Learn MoreNewsletter
Join our newsletter to stay up to date on features and releases.
Join Our Social & Community

Start Your Journey Today With Our Free Trial
Proudly showcase your skills and accomplishments through certificates and get recognition for your hard work and dedication from potential investors and peers.
Free TrialRelated Articles

Swap in Trading: What It Is, How It Is Calculated and How It Affects Your Positions
Learn what a swap in trading is, how overnight fees are calculated, when triple swaps apply, and how swap costs affect forex and CFD positions.


Bearish RSI Divergence: How to Spot It, Confirm It and Trade It
Learn how to identify bearish RSI divergence, confirm reversal signals, plan entries and exits, and manage risk with practical forex trading examples.
Sortino Ratio in Trading: How It Measures Downside Risk
Learn what the Sortino Ratio means, how to calculate it using downside deviation, and how traders use it to compare risk-adjusted performance.

How to Stress-Test a Trading Strategy With Monte Carlo
Learn how Monte Carlo simulation reshuffles trades, estimates drawdown and losing-streak ranges, and tests a strategy beyond one backtest.