
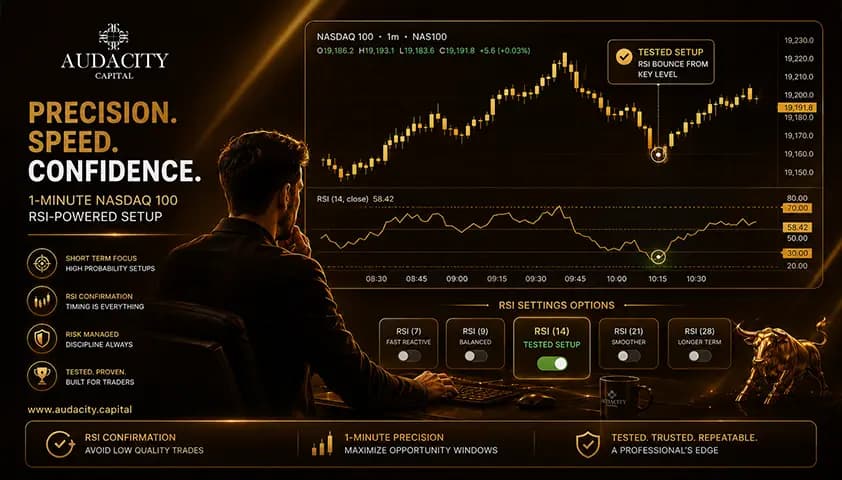
Best RSI Settings for the 1-Minute Nasdaq 100 Chart
Let's get this straight up front: there is no one perfect RSI trading for the 1 minute chart on the Nasdaq 100 that makes money.
The 1 minute time frame is noisy and fast, the Nasdaq trends very hard, and RSI generates many false signals on it. The true value lies in how you apply it, a tested setting with a filter, key levels, and risk management, rather than one magic number.
You've surely gone through that classic fail. RSI goes overbought, you go short, and the price just keeps moving up.
This guide will provide you with the settings traders use as starting points to test, tell you why the 1-minute Nasdaq is difficult for RSI, and demonstrate how to use RSI correctly within the rules of a funded account.
This is high-risk trading, and most scalpers lose.
RSI in 30 Seconds
The Relative Strength Index (RSI) is a momentum oscillator ranging from 0 to 100 that represents the speed and change of price movement.
It was created by J. Welles Wilder in 1978. A reading that rises above 70 is considered “overbought,” one that drops below 30 is “oversold” and anything near 50 indicates the point in between bullish and bearish momentum.
The two things you adjust are the RSI period (how many candles it looks back, default 14) and the thresholds (the overbought and oversold levels, default 70/30).
A point to note: a crossback (RSI that falls below a level then comes back up) is a more useful trigger than the actual level in itself.
Two dials to tune: the RSI period (speed) and the thresholds (sensitivity).
Why the 1-Minute Nasdaq 100 Is a Hard Place for RSI
First, you need a truth before any trading setting. This is how a good article on RSI differs from a settings-listicle.
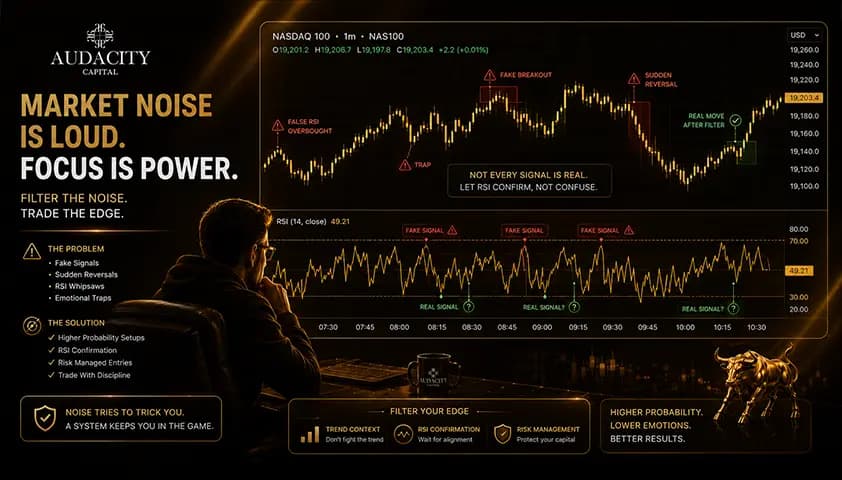
The 1-minute chart is extremely noisy. It produces a flood of small moves, so RSI hits overbought and oversold constantly. Many of those entries are just false signals, which are of no value. The shorter the time frame, the more noise, and the 1-minute is probably the noisiest.
The Nasdaq 100 is highly volatile and trends hard. This is the first thing you have to grasp about the market. When trending, RSI may stay overbought or oversold for a long time while price continues to move.
The easy trade on the overbought RSI level gets crushed again and again. Overbought does not mean sell by default. In a trending index, context will trump any level.
RSI is a lagging momentum oscillator. The default 14-period RSI is often too slow on the 1-minute. By the time the signal appears, the fast move that you want to catch could already be over.
In addition, on a fast-moving index such as the US100, the spread and slippage will be an additional cost on your small target in the 1-minute scalp.
This is why both correct settings and approach are key in this case, and why RSI alone cannot do the job.
The Best RSI Settings for the 1-Minute Chart
The objective of the 1-minute time frame is a setting that is responsive enough to be timely, but not excessively sensitive that it gives too many false signals.
The only way to determine what works for you and your market is to backtest. All below is a starting point and not a money-printing recommendation.
Period: Shorter Than the Default 14
The default 14 is usually too slow for the 1-minute, so scalpers shorten it.
- 5 to 7: the commonly used range. This setting works much faster and reduces some false signals. This is a good starting point for testing the best RSI settings for 1-minute charts.
- 7 to 9: Smoother and fewer false signals.
- 4 or 5, or even an ultra-fast RSI 2 to 3: reacts almost instantly but is very noisy, and only workable when heavily filtered by another tool.
The trade-off is simple. A shorter RSI period means more signals but more false ones. Consider each of them only as a starting point to backtest and not as one "best number.
Thresholds: Tighter or Trend-Based, Not Just 70/30
Many traders change the overbought and oversold levels on a noisy 1-minute chart to 80/20 or even 90/10 in order to trigger a signal only when more extreme readings are there. This reduces false-positives at the cost of fewer trades.
On the other hand, some traders may simply abandon the reversal concept and trade momentum around the mid-point. Using the 50 line with a 60/40 band, they trade in the direction of the trend.
Readings above 60 indicate strong bullish momentum and pullbacks toward 50 to 60 become continuation entries. Below 40 signals is bearish momentum. This works much better with a trending index than fading extremes. Try out both for your style.
For the Nasdaq 100 Specifically
As the Nasdaq is quite volatile and difficult to trend trade, the extreme-threshold type of 80/20 with a trend filter is likely to have greater importance here than on a slower market.
The overbought-stays-overbought warning is particularly strong on this time frame, so using the RSI to time trends, trading with the move and using pullbacks is likely a safer approach than fading every overbought print.
Keep in mind that the same RSI may react differently on a different pair and the same setting should be tested first on the index CFD before you put your trust in it on the Nasdaq.
Setting | Starting point | What it does | Trade-off |
RSI period | 5 to 7 | Faster, timely signals | More signals, more noise |
RSI period | 7 to 9 | Smoother momentum read | Slower, may miss quick moves |
Thresholds | 80/20 or 90/10 | Only extreme readings trigger | Fewer trades |
Thresholds | 50 line, 60/40 band | Trades with the trend | Needs clear trend to work |
How to Actually Use RSI on the 1-Minute Chart
Now here is rule number one: never trade the RSI on its own in the 1-minute Nasdaq time frame.
On its own, it will get you chopped up. There should always be some form of confirmation with your scalping RSI system.
Create a confirmation stack:
1. A trend filter.
Add a moving average, for example an EMA trend filter, and only take RSI long signals when price is above it and short signals when price is below it. This will keep you in sync with the trend.
2. Key levels.
Align RSI trade signals with support and resistance. Look for RSI oversold bounce from the support level and not just in the middle of nowhere.
3. Higher-timeframe bias.
Look at the 5-minute or 15-minute trend or RSI then trade the 1-minute in that direction. A clear higher timeframe bias filters out a lot of bad trades.
4. Divergence.
When the RSI does not confirm a price high or price low it is a divergence, and a RSI divergence is a stronger signal than a simple overbought or oversold print.
Use the crossback as your signal, whenever RSI crosses back above 20 or below 80, instead of just using the level alone.
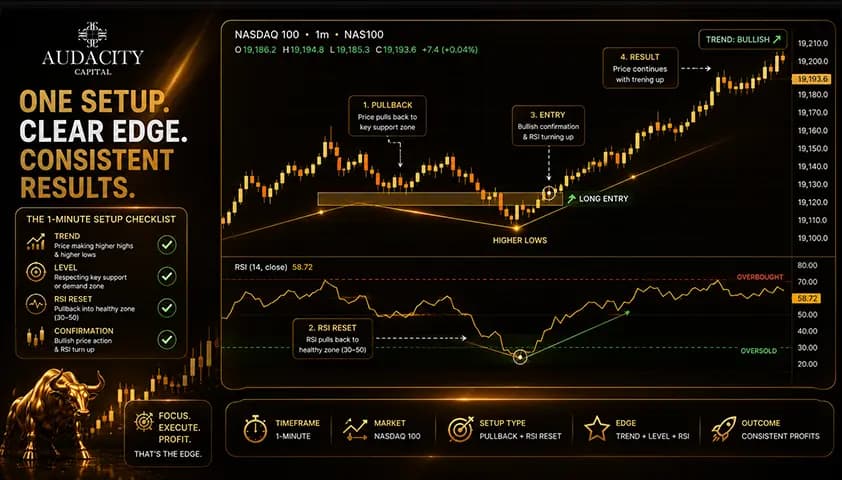
Example of a good setup. Price is in an uptrend, trading above the EMA, with the higher timeframe pointing up. You see a short-term RSI that has fallen into the oversold zone, and then bucks the trend and begins to move back up near the support zone. You go long, while divergence is an additional confirmation if it happens.
That is the RSI at work: adding confirmation to a setup that is already in line with the trend and and level.
The honest truth: RSI confirms the setup, it doesn’t forecast the future.
Common Mistakes Scalping the 1-Minute With RSI
The bulk of the damage occurs due to a few common mistakes. Let's take a look at each of them with the patch.
Mistake #1: Treating overbought as an automatic sell, and oversold as an automatic buy. This mistake makes the biggest harm in a trending market. Solution: Trade with the trend and wait for a confirmation.
Mistake #2: Using RSI alone with no trend filter or levels. Solution: Add the confirmation stack above.
Mistake #3: Using too short a period and drowning in false signals. Solution: Find the right balance between speed and false alerts by backtesting RSI periods that suits you.
Mistake #4: Fighting a strong trend by repeatedly fading extremes. Solution: Remember that overbought stays overbought and trade pullbacks instead.
Mistake #4: Neglecting spread and slippage. Solution: Make sure that your scalp profit exceeds the transaction cost of your trade
Mistake #5: Overtrading. The 1-minute chart shows a setup every few minutes and tempts dozens of trades. Solution: Take your A+ setups only. Overtrading is the way accounts lose money through commissions and poor decisions.
Mistake #6: No hard stop or position sizing. This is non-negotiable on a fast index. Every trade should have a stop and a sized position.
All of them have an honest theme: The setting is not the most important part. Discipline and method are what matter.
Risk Management and the Funded-Trader Reality
No setting will save you from bad risk management, therefore let us begin with the universal truths.
- Risk a small percentage of your account, typically 1% to 2% per trade.
- Set a hard stop limit for each and every trade.
- Size the position for the Nasdaq's volatility. It is highly volatile, thus scale down.
- Decide your target prior to entry.
This is market reality.
The Nasdaq 100, the US100, is a leveraged index CFD. Leverage increases the magnitude of loss as much as gain and the majority of retail scalpers incur losses. No settings will change it.
For funded traders, there are additional realities to consider:
- Slippage and spread spikes on a fast index can push a normal-sized scalp into a loss that breaches your daily loss limit. Trading the liquid hours and keeping risk tight matters even more inside a funded account.
- The 1-minute chart's constant signals make overtrading the biggest threat to a funded account. That happens through accumulated costs and through the revenge-trading spiral after a loss. The mental side of this deserves real attention, which is why trading psychology for funded traders is a topic worth studying on its own.
- Thin scalp targets are eaten by the spread. A strategy that looks good when you ignore costs can be a net loser once spread is included.
- Know your firm's daily loss limit and maximum drawdown, and never trade near them.
Keep this honest. No setting or method removes this risk. Good risk management only manages it, and that is exactly the discipline that keeps a funded account alive.
FAQ
There is no single best number. Scalpers commonly start around 5 to 7 for faster signals, with 7 to 9 slightly smoother. Shorter periods react quicker but produce more false signals, so treat any value as a starting point to backtest rather than a fixed answer.
It can be useful, but the Nasdaq is volatile and trends hard, so RSI can stay overbought or oversold for a long time. That means it works far better as a trend-following confirmation than as a signal to fade every extreme reading.
Many scalpers widen the levels to 80/20, or even 90/10, on the noisy 1-minute so that only more extreme readings trigger. This cuts false signals at the cost of fewer trades, and the right choice depends on your strategy and your testing.
It is not advisable. On its own, RSI gives too many false signals on the 1-minute, so you should confirm with a trend filter, key levels, and higher-timeframe context before acting on any reading.
Because the 1-minute chart is full of small, noisy moves, RSI swings into overbought and oversold constantly. On a strong trend, those extremes can persist without a reversal, so many readings simply lead nowhere.
A trend filter such as a moving average, support and resistance levels, higher-timeframe bias, and ideally RSI divergence. The goal is to take only RSI signals that line up with the trend and a meaningful level on the chart.
It can be done, but it is high-risk. Slippage and spread on a fast index can breach the daily loss limit, and the constant signals tempt overtrading. It demands tight risk, a tested plan, and strict discipline within the firm's rules.
The most liquid window is the US session and the London to New York overlap, with big moves around the US open and on US data. Trading outside those hours usually means wider spreads and worse fills, which hurt scalping.
هل أنت مستعد لتطبيق مخاطر منضبطة على العملات المشفرة؟ استكشف أدوات التشفير الجديدة من Audacity Capital واجلب استراتيجية التداول الخاصة بك.
اعرف المزيدالنشرة الإخبارية
انضم إلى نشرتنا الإخبارية.
انضم إلى مجتمعنا الاجتماعي
ابدأ رحلتك اليوم مع تجربتنا المجانية
اعرض مهاراتك وإنجازاتك بفخر من خلال الشهادات واحصل على تقدير لعملك الجاد وتفانيك من المستثمرين المحتملين والأقران.
تجربة مجانيةمقالات ذات صلة

Best Futures Prop Firms for Scalping (2026 Guide)
Compare the best futures prop firms for scalping in 2026. Review drawdown rules, payout policies, execution speed, fees, and scalper-friendly trading conditions.
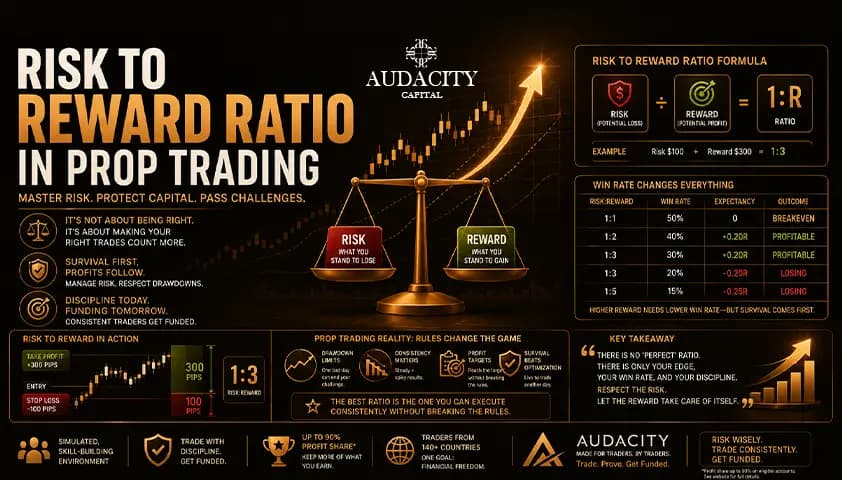
What Is Risk to Reward Ratio in Prop Trading?
Risk to reward ratio in prop trading explained: the formula, why win rate decides everything, and how drawdown limits change the math.

Best Time to Trade Forex in 2026: The Complete Session-by-Session Guide
Discover the best time to trade forex in 2026. This expert guide covers all four sessions, London-New York overlap, best days, worst days, currency pair timing, and a strategy-based schedule to maximize your trading edge.

Hanging Man Candlestick Pattern: How to Trade It?
The hanging man is a bearish reversal candlestick. Learn how to spot it, how it differs from the hammer, and how to trade it with confirmation and stops.