


What Is Maximum Drawdown? A Trader's Guide to MDD



KEY TAKEAWAYS
|
Traders love to talk about returns. But returns only tell you where a strategy ended up, not what it put you through to get there. Two accounts can finish the year up the same amount, yet one climbed there smoothly while the other plunged 40% along the way and clawed its way back. That gap between the headline result and the pain in the middle is what maximum drawdown captures.
Understanding max drawdown helps you judge whether a strategy is one you can actually stick with when it turns against you, and it sits at the center of how prop firms decide who keeps a funded account. This guide covers what it is, how to calculate it, and how to read it without fooling yourself.
What Is Maximum Drawdown in Trading?
The largest peak-to-trough fall an account or strategy takes before setting a new high is its maximum drawdown (MDD). Put simply, it answers one question: from its best point to its worst point over a given period, how far did the account drop?
It is a downside-only, path-dependent number. Volatility and standard deviation treat an up move and a down move as the same kind of risk. Drawdown ignores the upside entirely and measures only the damage, the way a trader actually experiences a losing stretch. A drawdown begins when value starts falling from a peak and ends only when it climbs back above that peak. The deepest such fall across the whole period is the maximum.
Funds, prop firms, and individual traders track it because it captures the worst case: the loss you would have taken if you had bought at the very top and sold at the very bottom of the roughest stretch on record.
The Maximum Drawdown Formula
The calculation itself is simple:
Maximum Drawdown = (Trough Value − Peak Value) ÷ Peak Value
The peak is the highest value reached before a decline, and the trough is the lowest value reached after that peak but before a new high forms. The result is usually shown as a percentage, and often as a negative number to keep the direction of the loss explicit. Many traders quote it as a positive figure for readability, which is fine as long as everyone understands it refers to a loss.
How to Calculate Maximum Drawdown (Step by Step)
Across a real equity curve, working out the maximum drawdown takes four steps:
- Build the equity curve. Track the account or portfolio value over time, not just the periodic returns.
- Track the running maximum. At each point, record the highest value reached so far.
- Measure the drawdown at each point. Subtract the running maximum from the current value, then divide by that running maximum.
- Take the deepest one. The largest (most negative) figure is the max drawdown. Note the peak date and the trough date too, because when a loss happened matters as much as how big it was.
Here is a worked example. Say an account moves through the following values:
Account value | Running high | Drawdown |
|---|---|---|
$10,000 (start) | $10,000 | 0% |
$15,000 | $15,000 | 0% |
$9,000 | $15,000 | -40% |
$13,000 | $15,000 | -13.3% |
$11,000 | $15,000 | -26.7% |
$18,000 | $18,000 | 0% |
The deepest fall is 40%, from the $15,000 peak down to the $9,000 trough. Notice that you measure from the high that came before the biggest drop, not from the highest value the account ever reached. The later dip from $13,000 to $11,000 was only about 15%, so it does not count as the maximum.
Why the Recovery Math Makes Drawdowns So Dangerous
Losses and gains are not symmetrical, and this is the single most important thing to grasp about max drawdown. A 10% loss does not need a 10% gain to recover; it needs about 11.1%, because you are now growing a smaller balance. The deeper the hole, the more lopsided it gets.
Drawdown (loss from peak) | Gain needed to break even |
|---|---|
5% | 5.3% |
10% | 11.1% |
20% | 25% |
30% | 42.9% |
40% | 66.7% |
50% | 100% |
75% | 300% |
90% | 900% |
A 50% drawdown needs a 100% gain just to get back to even. That is why experienced traders work harder at controlling drawdowns than at chasing bigger returns, and it is why a strategy that looks profitable on paper can be ruinous in practice once the drawdowns run past what you can stomach.
Recovery is not only about size, it is about time. Even a moderate drawdown can take months or years to claw back at a realistic growth rate. A 50% loss recovered at roughly 10% a year takes about seven years just to break even, and time spent recovering is time not spent compounding.
Maximum Drawdown vs Volatility and Other Risk Metrics
Both maximum drawdown and volatility describe risk, but from different angles. Volatility, measured by standard deviation, tells you how much prices bounce around day to day, treating upswings and downswings alike. Traders rarely feel standard deviation. What they feel is watching an account slide from its peak, which is exactly what drawdown captures.
That is why MDD is often paired with return to judge a strategy. The Calmar ratio divides annualized return by the maximum drawdown: a strategy returning 12% a year with a 30% max drawdown has a Calmar ratio of 0.40 (12 ÷ 30). It is the drawdown-based cousin of the Sharpe ratio, which uses volatility instead, and a higher Calmar means more return earned for each unit of worst-case loss. Value at Risk (VaR) is another common measure, estimating a likely loss over a set horizon at a given confidence level. None of these replaces the others; serious risk analysis reads them together.
What Counts as a Good Maximum Drawdown?
There is no universal good number for maximum drawdown, because the right level depends on the strategy, the asset, and your own tolerance. A useful benchmark is relative: a portfolio that falls less than the broader market in a downturn is generally showing better capital preservation, and it needs less upside to recover.
Context matters more than any single figure. A drawdown measured over a few calm months tells you very little. The most honest reading comes from a long history that has been through a full market cycle, a bull run and a bear run, so the number reflects how the strategy behaves when conditions turn hostile. Whatever the figure, the practical test is simple: is this a loss you could sit through without abandoning the plan at the worst possible moment?


Get Started with the Free Funded Account Challenge
Get Free Funded AccountThe Limits of Maximum Drawdown
For all its usefulness, max drawdown has real blind spots. It is worth knowing them before you lean on it:
- It is backward-looking. It describes the worst decline that has already happened. It does not predict the next one, and the future can be worse than anything in the record.
- It ignores frequency and duration. A single 30% fall and a strategy that repeatedly drops 30% can show the same MDD, even though they are very different to live through. It also says nothing about how long recovery took.
- It is sensitive to the data. The figure shifts depending on whether you use daily or monthly values, price returns or total returns with dividends reinvested, and the length of the window. Always note those choices when comparing two numbers.
None of this makes maximum drawdown less valuable. It just means it belongs alongside other measures, not on its own.
Common Causes of Large Drawdowns
Severe drawdowns rarely come from one bad trade. They build up from repeated exposure to unmanaged risk. The usual culprits:
- Emotional rule-breaking, especially revenge trading after a loss
- Oversized positions relative to the account
- Holding several highly correlated trades, so one market move hits all of them at once
- Sudden regime shifts, such as a news shock or a jump in volatility
Traders track maximum drawdown for exactly these reasons: to size positions realistically, to understand their worst-case exposure, to compare strategies beyond their headline returns, and to test whether they can handle a losing run psychologically before real money is on the line.
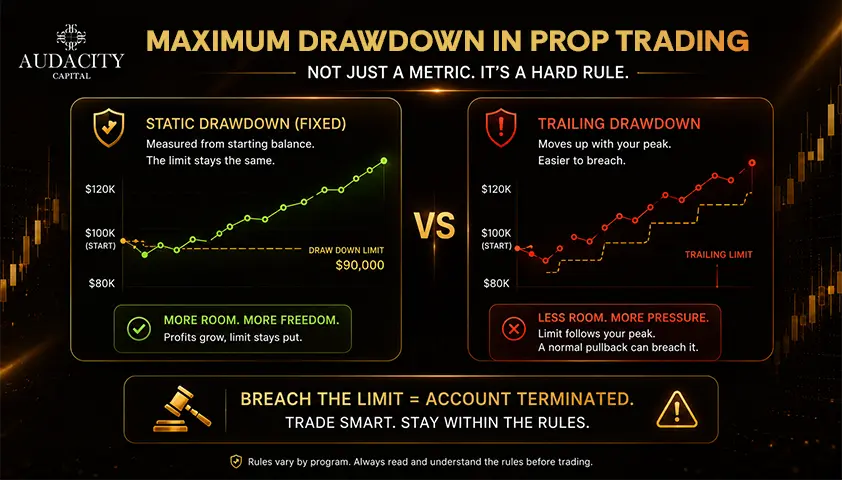
Static vs Trailing Maximum Drawdown in Prop Trading
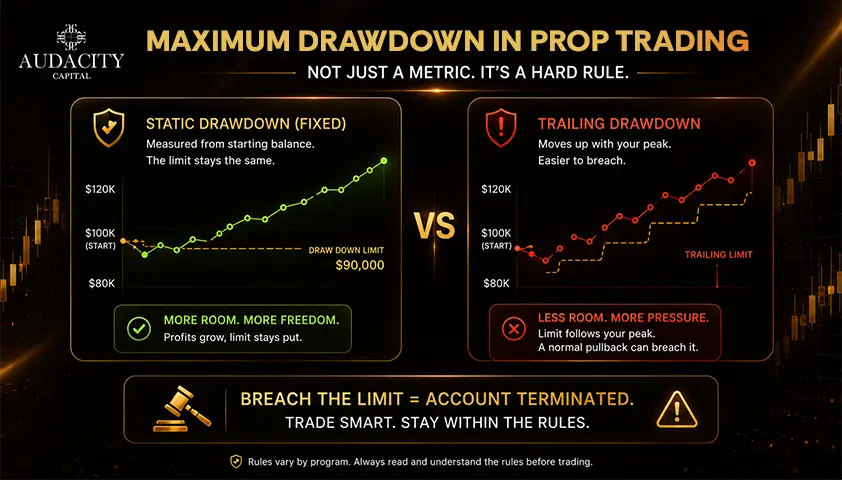
For funded traders, maximum drawdown is not just a metric, it is a hard rule. Prop firms set a maximum loss from your account's starting balance or peak, and breaching it ends the account. Two structures are common:
- Static (or fixed) drawdown is measured from your starting balance and does not move. If your limit is 10% on a $100,000 account, your floor stays at $90,000 no matter how much profit you bank, so once you are in profit that cushion effectively grows.
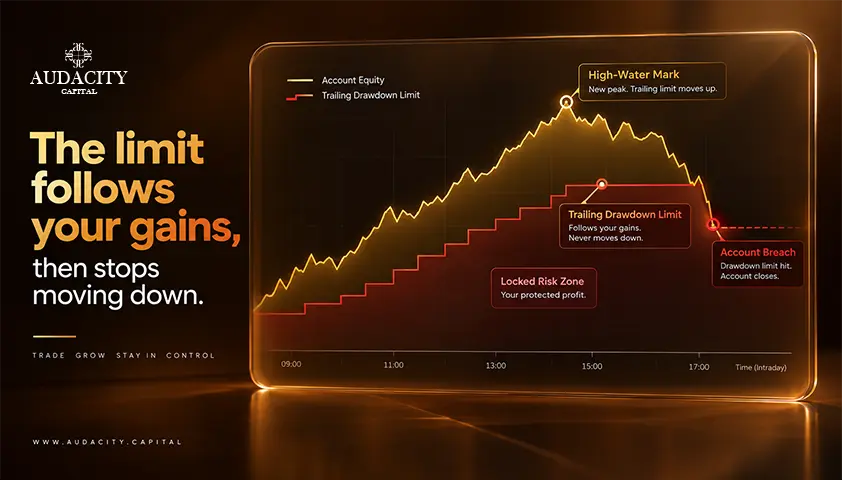
- Trailing drawdown moves up with your account's peak. As your balance hits new highs, the limit trails behind it and usually locks once you reach a set profit target. It protects the firm, but it makes the limit easier to breach, because a normal pullback on an open winner can trip it.
This is only a summary. For the full breakdown of daily loss limits, trailing versus static drawdown, and worked breach examples, see our guide to drawdown in prop trading.
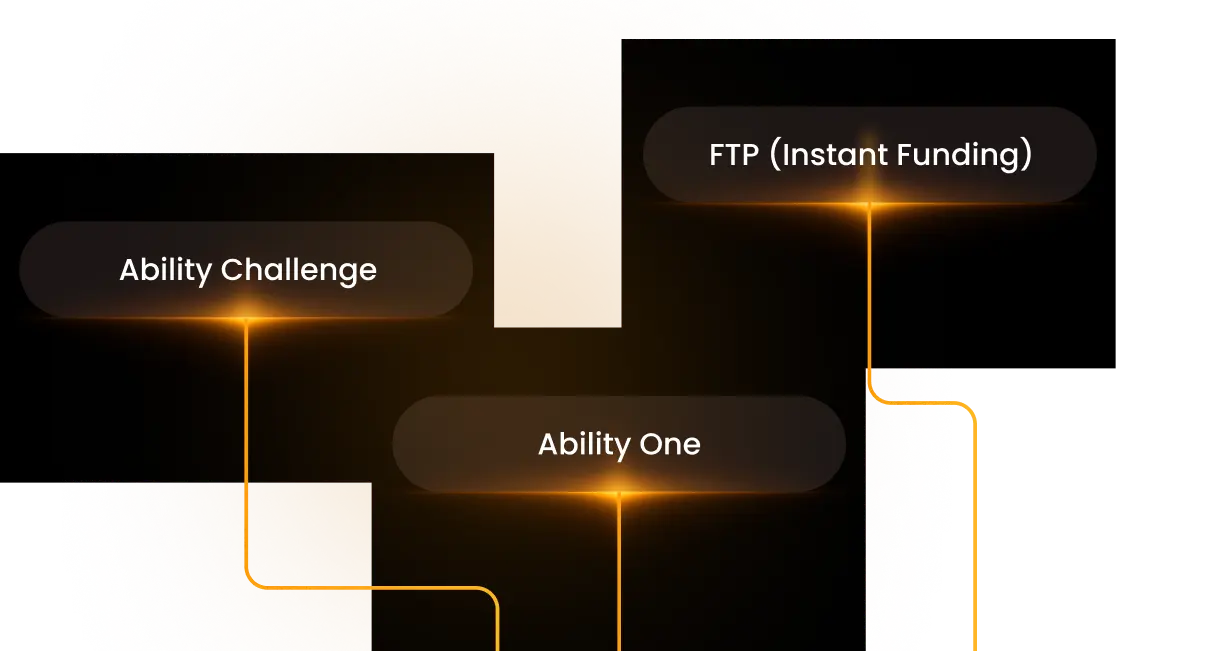
Audacity's Trading Program
Funded Trader ProgramWhere Audacity Capital Fits
At Audacity Capital, the maximum drawdown rule is deliberately built to be trader-friendly. Our funded accounts use a static drawdown, measured from your starting balance rather than trailing your equity peak, so a good run of profit is not punished by a tightening limit. Alongside a daily loss limit, that gives you a clear, fixed line to trade within.
Audacity Capital is a proprietary trading firm, not a broker. We provide simulated funded accounts on MT5 and DXTrade with a profit share of up to 90%, so skilled traders can trade meaningful size without risking their own capital on every position. A funded account gives you capital and structure; it does not, on its own, make anyone profitable. Most people who attempt a funded challenge do not pass, and most retail traders lose money, so managing your drawdown is still the job. If you want to build that discipline, explore the Audacity Capital Funded Trader Program or test your skills in our free trading competition.
Conclusion
Maximum drawdown measures the deepest loss a strategy or account takes before it recovers, and the recovery math is what makes it matter: the bigger the fall, the harder the climb back. Read it alongside returns and other risk measures, size your positions so your worst case stays survivable, and you turn a backward-looking number into a forward-looking discipline.
Frequently Asked Questions
A lower maximum drawdown is generally better, because it means smaller peak-to-trough losses and an easier recovery. A higher figure signals greater downside risk. The one caveat is context: a low drawdown measured over a short, calm period may simply mean the strategy has not been tested yet.
On an unleveraged account, no. The most you can lose is everything, which is a 100% drawdown, and there is no coming back from it. Leverage can push actual losses beyond your deposit in extreme cases, but drawdown is normally expressed against peak equity, so it tops out at 100% when the account hits zero.
A drawdown is any decline from a peak to a trough before a new high. The maximum drawdown is simply the single largest of those declines over the period you are measuring. An account can have many drawdowns but only one maximum in a given window.
They work in opposite directions in time. Maximum drawdown is a backward-looking measurement of the worst loss that has already happened. A stop-loss is a forward-looking order you place to cap the loss on a single trade before it happens. One reports history; the other manages the next position.
It is the largest peak-to-trough loss measured within a moving window, most often the past 12 or 36 months, rather than over the entire history. Rolling it forward shows whether a strategy's worst-case behavior is improving or getting worse over time. Note that this is a measurement window, not the same thing as a prop firm's trailing drawdown rule.
Effectively yes. Any strategy whose value can fall will have a worst peak-to-trough decline on record. A strategy showing zero drawdown has either never lost value, which almost never lasts, or has not been running long enough to reveal it.
For an active account, checking your distance from your worst historical drawdown regularly, and against any firm limit daily, keeps risk front of mind. For evaluating a strategy, review it across multiple market conditions rather than a single stretch, since one quiet period can hide the real downside.

Bereit, diszipliniertes Risiko auf Krypto anzuwenden? Entdecken Sie die neuen Krypto-Instrumente von Audacity Capital und bringen Sie Ihre Trading-Strategie mit.
Mehr erfahrenNewsletter
Treten Sie unserem Newsletter bei, um auf dem Laufenden zu bleiben.
Treten Sie unserer sozialen Gemeinschaft bei

Beginnen Sie Ihre Reise heute Mit unserer kostenlosen Testversion
Präsentieren Sie stolz Ihre Fähigkeiten und Leistungen durch Zertifikate und erhalten Sie Anerkennung für Ihre harte Arbeit und Ihr Engagement von potenziellen Investoren und Kollegen.
Kostenlose TestversionVerwandte Artikel

Prop Firm With the Highest Drawdown: Why It Matters More Than You Think
Looking for a prop firm with the highest drawdown? Discover flexible risk limits and trading conditions with Audacity Capital and compare top prop firms.


What Is Static Drawdown? How It Works + Examples
Learn what static drawdown means in trading and funded accounts. Audacity Capital explains how static drawdown works and how traders manage risk.

What Is a Daily Drawdown in a Prop Trading Firm?
Understand daily drawdown in trading, how it is calculated, and why managing daily losses is crucial for funded traders.
Intraday Trailing Drawdown: How It Works and How to Trade It
Intraday trailing drawdown lifts your loss limit with every equity high, open profit included. See the formula, lock rules and how to trade it.