


What Is Maximum Drawdown (MDD)? Definition, Formula and Examples



Imagine two portfolios that begin the year at $1,000,000 and finish at $1,150,000. They appear identical. One takes a steady step up each month. The other goes down to $700,000 in the spring. It remains below its previous peak for months and then rises back up and finishes higher.
The return is the same but the experience is not.
Return tells us where the investment ends up. Maximum drawdown tells us the largest decline it went through on the way there.
This guide explains the definition and formula, shows how to calculate it in Excel, and examines real market examples. It also explains how to interpret the number and where the metric can mislead you.
What Is Maximum Drawdown?
Maximum drawdown (MDD) is defined as the highest percentage drop from the peak of the portfolio to the subsequent trough. It calculates the greatest drop over a specified time, regardless of whether the portfolio has recovered by the end.
Two points are required to calculate MDD:
- Peak: the highest point achieved before the drawdown.
- Trough: the lowest point achieved after that peak and before the next peak.
A third point, the recovery point, is when the value is restored to or is greater than the previous high point. Recovery is useful for measuring drawdown duration, but is not needed to calculate maximum drawdown.
If the measuring period is completed before the lowest value is achieved, the MDD can still be determined with the lowest value so far.
MDD focuses on negative performance. By stripping down the effects of fluctuations from smaller price changes, MDD captures the most severe decline in history.
Max drawdown is a standard measure for mutual funds, hedge funds, trading accounts, and quantitative models.
Drawdown vs Maximum Drawdown
A drawdown is any fall from a peak, lasting until the value of the portfolio falls to a new peak or until the end of the period. There may be many drawdown periods in the life of a portfolio.
Maximum drawdown is the greatest fall during the specified period. Always make the time frame clear. An MDD of five years and an MDD of twenty years refer to different histories. They cannot be compared directly.
The Maximum Drawdown Formula
The formula is:
Maximum Drawdown = ((Trough Value - Peak Value) / Peak Value) x 100
The result of the formula will be a negative percentage. The absolute value is used when expressing drawdown as a positive number.
Let us take an example where a portfolio reaches $1,000,000 and later falls to $650,000.
(($650,000 - $1,000,000) / $1,000,000) x 100 = -35%
In the above equation, the signed result is -35% because it indicates a decrease. When MDD is expressed as the magnitude of drawdown, it is usually expressed as 35% maximum drawdown.
Both conventions refer to the same event, as long as the sign convention is known.
Trough should come after the peak. The low that happened before the peak is not included in that peak's drawdown.
Maximum Drawdown Calculator Example
Input | Value |
Peak value | $120,000 |
Trough value | $84,000 |
Max drawdown | 30% |
Calculation: (($84,000 - $120,000) / $120,000) x 100 = -30%, or a 30% drawdown when stated as a positive magnitude.
How to Calculate Maximum Drawdown Step by Step
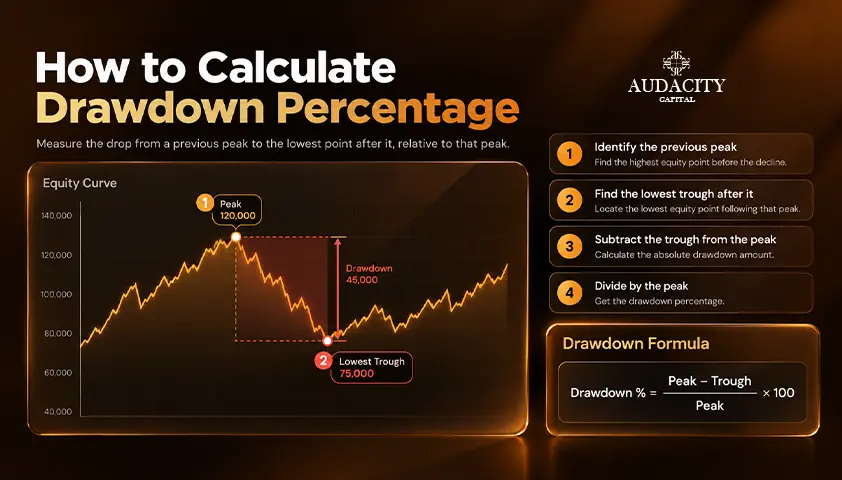
The calculation involves the following four steps:
- Document the portfolio value at a regular time interval, e.g., daily or month-end.
- At every interval, record the highest value (called a running peak) that had occurred up to that point.
- Find the value of the drawdown for each point; it is equal to the current value divided by the running peak, minus one.
- Choose the most negative result and record the running peak value and its trough.
The following table is an example based on month-end values for a portfolio that starts at $100,000.
Month | Portfolio value | Running peak | Drawdown |
January | $100,000 | $100,000 | 0% |
February | $112,000 | $112,000 | 0% |
March | $120,000 | $120,000 | 0% |
April | $102,000 | $120,000 | -15% |
May | $84,000 | $120,000 | -30% |
June | $96,000 | $120,000 | -20% |
July | $90,000 | $120,000 | -25% |
August | $126,000 | $126,000 | 0% |
The max drawdown in this case is 30% and occurs between March's peak of $120,000 and May's trough of $84,000.
The drop from $96,000 in June to $90,000 in July does not count as a separate drawdown because the portfolio value has not recovered the previous peak of $120,000; therefore, the drawdown from $120,000 continues even in July.
The drawdown ends in August, when the portfolio reaches a new high of $126,000.
How to Calculate Maximum Drawdown in Excel
You can reproduce the example in a spreadsheet in a few minutes. Enter the portfolio values in column B, starting in row 2.
Column | What it holds | Formula/entry |
B | Portfolio value | Enter the value |
C | Running peak | =MAX($B$2:B2) |
D | Drawdown | =B2/C2-1 |
Result cell | Maximum drawdown | =MIN(D2:D9) |
Copy the formulas from columns C and D to the bottom of the table. The formula fixes cell $B$2 as the start point. The ending cell moves down with each row. This will allow Excel to record the Maximum Portfolio Value that was achieved up to the date.
The most negative value in the drawdown column is returned in the result cell. Format it as a percentage. Use the =ABS(MIN(D2:D9)) formula to calculate MDD as a positive figure.
The same approach applies for daily data over several years. You will just need to change the range.
Drawdown Duration and Recovery Time
Drawdown depth is just one aspect. Drawdown duration indicates the amount of time that the capital has spent below its previous peak. It can be divided into three periods:
- Decline period: from the peak to the trough.
- Recovery period: from the trough back to the previous peak.
- Underwater period: from the original peak until full recovery.
The example shown here takes two months for the portfolio to drop from its March high to its May low. It then takes three months to recover, reaching a new high in August. The total underwater time is five months.
Two portfolios can have the same MDD but remain underwater for very different lengths of time. During recovery, capital remains below its previous high, delaying any growth beyond that earlier peak.
It is possible to have two portfolios experience the same MDD but stay underwater for very different lengths of time. In the recovery phase, capital stays under its earlier highs, delaying further gains above this earlier high point.
A very short, severe drawdown can have a very different meaning than a small, lengthy drawdown, depending on the investor's objectives and need for liquidity.
Why Deeper Drawdowns Need Bigger Recoveries
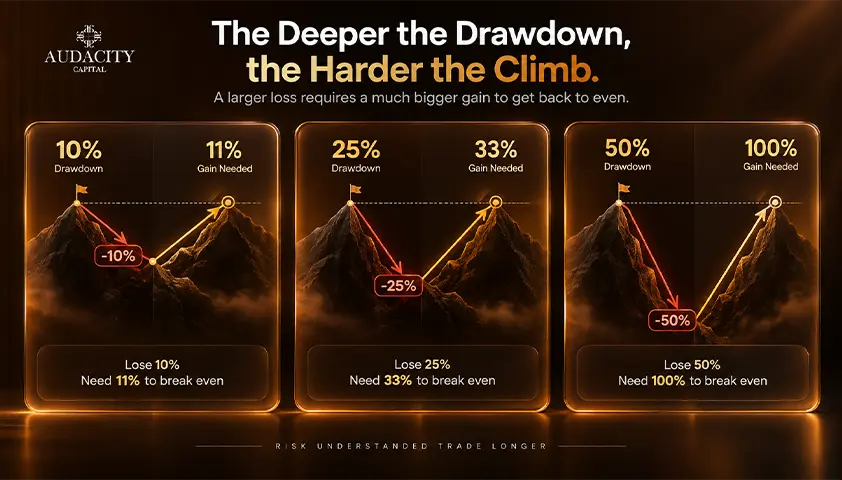
In order to recover from a drawdown, one needs a greater proportional gain compared to the drawdown itself. The gap increases rapidly with increasing drawdown.
Required gain = (1 / (1 - drawdown)) - 1
In the above formula, substitute the drawdown as a decimal number. For instance, use 0.30 for 30% drawdown.
Drawdown | Gain needed to recover |
10% | 11.1% |
20% | 25% |
30% | 42.9% |
40% | 66.7% |
50% | 100% |
75% | 300% |
In case of a 50% loss, the capital reduces by half, and the remaining capital needs to double in order to revert to the initial level. At an 8% annual return, doubling would take about nine years.
The portfolio would compound from a smaller capital base during this period. It would not exceed its previous high until the recovery was complete.
This is why controlling deep drawdowns can be as important as pursuing higher returns.
Maximum Drawdown Examples From Real Markets
Real market declines show why drawdown depth and recovery time should be considered separately. Recovery can take far longer than the initial fall.
Market decline | Approximate max drawdown | Return to the previous closing high |
Nasdaq Composite, dot-com crash | 78% | April 2015, about 15 years after its March 2000 peak |
S&P 500, global financial crisis | 57% | March 2013, about 5.5 years after its October 2007 peak |
S&P 500, COVID-19 crash | 34% | August 2020, about 6 months after its February 2020 peak |
The comparison is obvious. The drop caused by COVID-19 has been significant but temporary, with the S&P 500 closing above its previous peak within six months.
The Nasdaq Composite has required fifteen years to close above its peak during the dot-com era.
The numbers reflect the daily closing prices for indexes and are rounded. Reinvested dividends are not included. A total return index might show a different drawdown and an earlier recovery because it includes dividends.
Observation frequency is also important since the intraday values could give different peaks and troughs.
Maximum Drawdown vs Absolute Drawdown
Maximum drawdown and absolute drawdown do not use the same reference point.
Measure | Reference point | What it shows |
Maximum drawdown | The highest value reached before a decline | The largest peak-to-trough decline during the period |
Absolute drawdown | Usually the initial account balance or starting capital | How far the account fell below its starting level |
Assume that an account that started with $100,000, reached $130,000, and went down to $105,000. It has not fallen below its initial balance; therefore, the absolute drawdown would be 0%.
However, its max drawdown is about 19.2%, calculated based on the decrease from $130,000 to $105,000. It should be noted that the notion of absolute drawdown is not applied consistently by all brokers, platforms, and funded trading providers.
Sometimes it is presented in dollars and other times as a percentage. Be sure to clarify the definition from the provider first before comparing rules or results.
Static and trailing drawdown are also distinct from MDD as a measure of the past performance of the strategy. A static loss limit stays at a fixed level, whereas the trailing one may go up if the account makes a new high.
These are account rules, while MDD measures the worst decline that actually occurred.


Get Started with the Free Funded Account Challenge
Get Free Funded AccountMaximum Drawdown vs Other Risk Measures
There is no magic number to describe risk. Every indicator answers a particular question, and for that reason, analysts often use more than one indicator.
Measure | What it tells you | Main blind spot |
Maximum drawdown | The worst peak-to-trough loss in the period | Ignores how often large losses occur |
Standard deviation | How widely returns vary in either direction | Treats gains and losses as equal volatility |
Value at risk (VaR) | A potential loss over a set period at a stated confidence level | Says little about losses beyond that threshold |
Sharpe ratio | Return earned per unit of volatility | Uses standard deviation as its risk measure |
Calmar and Sterling Ratios
The Calmar and Sterling ratios combine return and drawdown to show how much return a strategy earned relative to its downside.
The Calmar ratio divides annualized return by maximum drawdown. It is commonly calculated using a 36-month period. A strategy with a 12% annualized return and a 30% MDD has a Calmar ratio of 0.40.
The Sterling ratio also compares return with drawdown, but its formula varies. Some versions use average drawdown, while others add a fixed adjustment to drawdown.
Always check the provider's methodology before comparing ratios. Under the same method, a higher ratio means more return for the drawdown risk taken.
What Is a Good Maximum Drawdown?
There is no universal MDD that is good for every investment or trader. The number only makes sense in context.
First, compare it with a relevant benchmark over the same period. A fund with a smaller drawdown than its benchmark experienced less severe downside during that window.
Second, compare similar strategies. Equity funds, bond funds, leveraged strategies, and short-term trading systems can have very different drawdown profiles. Compare like with like.
Third, examine the measurement period. An MDD is more informative when the record includes both strong and weak markets. A strategy may look stable if its history covers only a calm period.
Finally, consider whether you could realistically tolerate the decline without abandoning the strategy near its lowest point. A number that looks acceptable on a fact sheet can feel very different when real money is involved.
Audacity's Trading Program
Funded Trader ProgramLimitations
Maximum drawdown is useful, but it has clear limits:
- It is backward-looking. It records the worst decline observed so far. A future decline can be deeper.
- It ignores frequency. One 25% decline and several separate 25% declines can produce the same MDD, although the experiences are very different.
- It depends on data frequency. Monthly values can hide intra-month lows. Daily or intraday data may show a deeper drawdown.
- It depends on the measurement window. Extending the history can only leave MDD unchanged or make it larger. Comparisons are most useful when they cover the same period.
- It does not show the full loss distribution. MDD captures the single worst decline. It says little about smaller recurring losses or tail risk beyond the observed history.
- It can differ by data type. Price returns, total returns, account balance, and account equity can produce different results.
How Active Traders Use Maximum Drawdown
Active traders use MDD to assess live accounts and strategy backtests. It helps them review position sizing and compare systems. They can also check whether a strategy's worst historical decline would have been manageable in real time.
A backtest can show a strong total return and still have an MDD that is too large for the trader's risk tolerance or account rules.
Traders should also consider how the strategy behaved across different market conditions and whether trading costs, slippage, and open losses were included.
Many funded trading programs turn drawdown into a hard account rule. If equity falls below the stated limit, the account may be paused or breached. However, these program rules should not be confused with MDD as a performance statistic.
Balance vs Equity Drawdown
Balance-based drawdown uses the account balance, which normally changes when trades are closed. It may not capture losses on positions that remain open.
Equity-based drawdown uses the account's current equity, which includes unrealized profit or loss on open positions. It can therefore reveal a loss before the trade is closed.
For example, an account may still show a $100,000 balance while open positions reduce equity to $92,000. A balance-only calculation shows no drawdown, while an equity-based calculation shows an 8% decline from $100,000.
This distinction matters in funded trading because a provider may monitor equity in real time even when the account balance has not changed.
Conclusion
Take a fund, portfolio, or strategy you follow and collect its values over a meaningful period. Apply the Excel method in this guide, then examine three things: the maximum drawdown, the full underwater period, and the recovery gain required.
Together, these measures provide a clearer picture of downside risk than headline return alone.
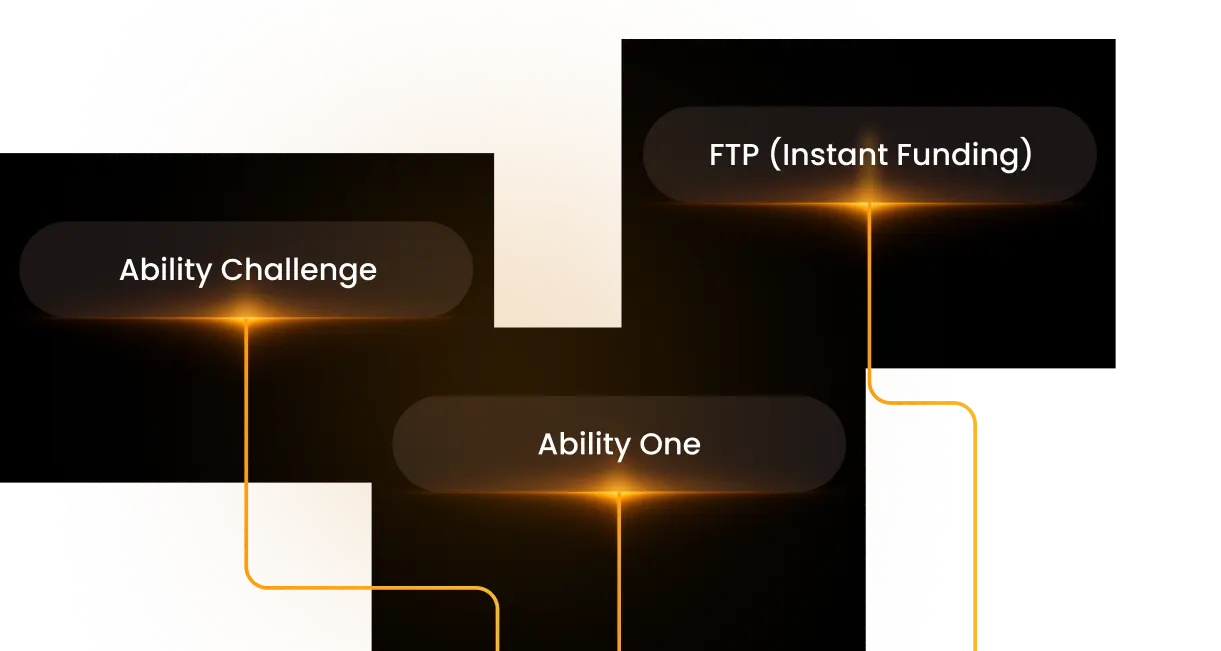
Audacity Capital offers different funded trading programs, each with its own profit targets and drawdown limits. With the Ability Challenge (2 Step), traders target 10% in the Challenge Phase and 5% in the Verification Phase, with maximum drawdown limits of 15% and 10%, respectively. Ability One (1 Step) has a 10% profit target and 3% daily and 6% maximum drawdown limits across both the Challenge and Funded Phases. FTP (Instant Funding) has a 10% profit target, with a 5% daily drawdown and 10% maximum drawdown. These programme-specific parameters give traders clear risk limits while allowing them to choose a route that suits their trading approach.
Frequently Asked Questions
For an unleveraged investment with limited liability, drawdown cannot exceed 100% because the value cannot fall below zero. A complete loss is a 100% drawdown.
Leverage, margin debt, derivatives, and certain account structures can create losses that exceed the capital originally invested, so the practical risk can be greater.
Most publishd figures use closing values at a fixed frequency, such as daily or month-end. Intraday data can produce a deeper figure because it captures movements that closing prices miss. Use the same frequency and method when comparing investments or strategies.
It depends on the dataset. A price index excludes dividends. A total return index assumes dividends are reinvested. Total return data can therefore show a smaller drawdown or faster recovery for income-paying assets. State the data type whenever you report MDD.
Rolling max drawdown is the worst decline within a moving window, such as the previous 12 or 36 months. Analysts use it to see how downside behavior changes as newer periods enter the window and older periods leave it.
Not always. It is measured from the highest value reached before a decline. Maximum loss may refer to the largest losing trade, the biggest one-day loss, or the fall from starting capital. The exact meaning depends on the context, so the calculation method should be stated.

Pronto para aplicar risco disciplinado em cripto? Explore os novos instrumentos de cripto da Audacity Capital e traga sua estratégia de trading.
Saiba MaisNewsletter
Junte-se ao nosso boletim para ficar atualizado.
Junte-se à Nossa Comunidade Social

Comece Sua Jornada Hoje Com Nosso Teste Gratuito
Mostre com orgulho suas habilidades e conquistas através de certificados e obtenha reconhecimento pelo seu trabalho árduo e dedicação de potenciais investidores e colegas.
Teste GratuitoArtigos Relacionados

What Is a Daily Drawdown in a Prop Trading Firm?
Understand daily drawdown in trading, how it is calculated, and why managing daily losses is crucial for funded traders.


Relative Drawdown Explained: Meaning, Formula & Example
Learn what relative drawdown is in trading, how to calculate it, and why it matters for risk management. Simple formula and examples by Audacity Capital.

What Is Static Drawdown? How It Works + Examples
Learn what static drawdown means in trading and funded accounts. Audacity Capital explains how static drawdown works and how traders manage risk.

Prop Firm With the Highest Drawdown: Why It Matters More Than You Think
Looking for a prop firm with the highest drawdown? Discover flexible risk limits and trading conditions with Audacity Capital and compare top prop firms.