
Day Trading Patterns: 12 Chart Patterns Every Trader Should Know

Open up any 15-minute chart and you'll soon spot them: those few recurring patterns repeating themselves in stocks, forex and crypto alike. That is not a coincidence.
Financial markets run on fear and greed, and because human nature repeats, so does the price action.
And that's how day trading patterns help you use repetition to make informed decisions about the trend's future direction, identify your entries and set up your stop and targets.
Patterns come in three families: reversal patterns which mean the trend is going to change, continuation patterns which indicate the trend will go on, and bilateral patterns where it's unclear which way it will go.
Here, we explain 12 key patterns split between those three categories using the exact same trading approach for all of them.
Before we begin, let me clarify that patterns are probabilities, not promises. They don't work, false breakouts occur, and they only make sense when combined with risk management and confirmation. What follows is a simple, practical, and honest guide.
What Are Chart Patterns (and the 3 Types)?
Chart patterns refer to repeatable configurations made up of price action across several candles, signaling a likely future move. Patterns are the bedrock of all technical analysis, as they represent an illustration of the battle between buyers and sellers.
There are two points to keep in mind.
First of all, “chart patterns” are multi-candle structures, namely triangles, flags and double tops. These should not be confused with single candlestick patterns, such as hammer or doji, which we cover in separate guides. This article is about chart patterns only.
Secondly, all patterns consist of the same basic building blocks: support/resistance levels (areas at which buying/selling pressure frequently occurs), trend lines (drawn by connecting swing highs or swing lows), and consolidation (when prices oscillate within tighter ranges, while the market decides its next move).
These are the three types of patterns:
- Reversal patterns occur at the end of a trend and signal a change in its direction. Example: the Head and Shoulders.
- Continuation patterns mark temporary pauses before the prevailing trend resumes. Example: the Flag.
- Bilateral patterns indicate indecision and can reverse to either side. Example: the Symmetrical Triangle.
Now that you understand reversal and continuation patterns, plus the one major bilateral pattern, you have the whole picture. Next up: trading these patterns.

How to Trade Any Chart Pattern (the Universal Method)
Each pattern discussed here can be traded using the exact same four steps. If you learn the approach just once, then all other patterns will only represent different variations of that one universal strategy.
Step 1: Recognize the pattern and wait for it to complete.
Avoid anticipating. An unfinished double top pattern is nothing but a pullback. Consider the conditions first: is there any clearly visible prior trend? Is this pattern developing at a meaningful level?
Step 2: Wait for the breakout and confirm it.
A breakout is a move that breaks through the pattern's boundary, preferably a candle close beyond the line, not just a wick poking through.
The inverse action is called a fake breakout, when price enters the boundaries, then reverses back inside, trapping early entries.
The simplest filter is to be patient, and wait for a confirmed close, or perhaps a couple of candles further down. Confirmation of a break by volume is an added bonus. A breakout on expanding volume carries far more weight than one on thin participation.
Step 3: Enter and place your stop-loss beyond the invalidation point.
Each pattern has a level where, once achieved, the pattern is invalidated. Your stop-loss goes there, no other place.
Step 4: Set a target.
The traditional way is through the measured move: where you measure the pattern's height at its widest point and project that distance from the breakout to get a price target. Or set a fixed risk-reward ratio, like going for double the risk (2:1), ensuring more wins than losses.
Just to make it clear, this information is presented for educational purposes only. Remember that all patterns have the potential to fail, and thus the reason for the stop-loss step.
Part 1: Reversal Patterns (Signal a Trend May Change Direction)
Reversal patterns emerge as trends come to an end, signaling that there is likely to be a reversal. They require prior trends which they will reverse and usually take longer to form than continuation patterns.

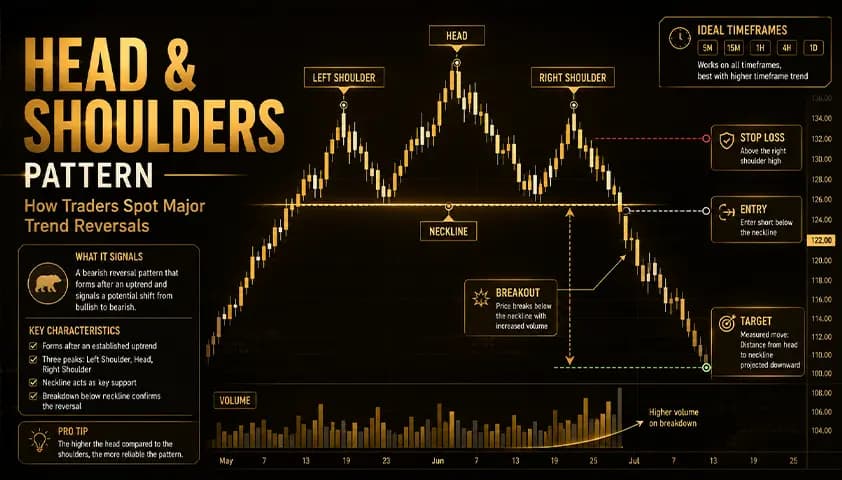
1. Head and Shoulders (and Inverse Head and Shoulders)
Signal: Bearish reversal following an uptrend. The Inverse pattern represents a bullish reversal after a downtrend. It is the most closely studied reversal pattern used in technical analysis.
Pattern description: Three peaks: high peak (head) sandwiched between low peaks (shoulders) which all fall back to the same level of support called neckline (line connecting the lows between the peaks). The Inverse Head and Shoulders is the mirror image, three troughs below a resistance neckline.
How to trade it: Enter on a candle close below the neckline (above it for the inverse). Stop above the right shoulder (below it for the inverse). Target equals the distance from the head to the neckline, projected from the breakout point.
2. Double Top
Signal: Bearish reversal pattern that takes an “M” shape after an uptrend.
What it looks like: Price hits a high, pulls back, then rallies and fails to break that high a second time. The pullback low between the two peaks acts as the neckline. The second peak often forms on lower volume, a sign buying pressure is fading.
How to trade it: Enter on a close below the neckline. Stop above the second peak. Target equals the pattern's height, peak to neckline, projected down from the break.

3. Double Bottom
Signal: Bullish reversal. The mirror of the double top, a "W" shape after a downtrend.
What it looks like: Price hits a low, bounces, then returns and holds that low on a second test, failing to break lower. The high of the bounce between the two lows defines the resistance line.
How to trade it: Enter on a close above that resistance. Stop below the second bottom. Target equals the pattern's height projected up from the breakout.

4. Rising Wedge
Signal: Bearish reversal when it forms in an uptrend. Price keeps climbing, but momentum is visibly weakening.
What it looks like: Two upward-sloping, converging trendlines. Price makes higher highs and higher lows, but each push gains less ground and the range tightens toward an apex. Volume often declines as the wedge matures.
How to trade it: Enter on a close below the lower trendline. Stop above the most recent swing high inside the wedge. Target equals the wedge's height at its widest point, projected down from the break.

5. Falling Wedge
Signal: Bullish reversal after a downtrend. The mirror of the rising wedge.
What it looks like: Two downward-sloping, converging trendlines. Price makes lower highs and lower lows, but selling pressure shrinks with each leg and the range compresses. It frequently precedes an upside break.
How to trade it: Enter on a close above the upper trendline. Stop below the last swing low inside the wedge. Target equals the wedge's height projected up from the breakout.

Part 2: Continuation Patterns (Signal the Trend Will Likely Resume)
Continuation patterns are pauses, periods of consolidation within a trend before it resumes. They usually form faster than reversals and tend to show volume drying up during the pause, then expanding on the break.
6. Bull Flag
Signal: Bullish continuation. One of the most popular chart patterns for day trading because it appears constantly on intraday charts.
What it looks like: A sharp upward move, called the flagpole, followed by a small downward or sideways drift, the flag, on noticeably lighter volume. The flag forms a tight parallel channel sloping against the trend.
How to trade it: Enter on a breakout above the flag's upper boundary, ideally on a volume surge. Stop below the base of the flag. Target equals the flagpole's height projected from the breakout. Many traders look for 2:1 or better on this setup.

7. Bear Flag
Signal: Bearish continuation. The mirror of the bull flag.
What it looks like: A sharp downward move forms the flagpole, followed by a small upward or sideways consolidation that drifts against the trend on lighter volume.
How to trade it: Enter on a breakdown below the flag's lower boundary. Stop above the top of the flag. Target equals the flagpole's height projected down from the break.

8. Pennant
Signal: Continuation in the direction of the prior move, bullish or bearish. A close cousin of the flag.
What it looks like: A strong impulsive move followed by a brief, small symmetrical triangle of consolidation, converging trendlines rather than the parallel channel of a flag. Pennants are usually short-lived.
How to trade it: Enter on a breakout in the direction of the prior trend. Stop on the opposite side of the pennant. Target equals the prior impulse, the flagpole, projected from the breakout.

9. Ascending Triangle
Signal: Bullish continuation, usually. It shows buyers stepping in at progressively higher prices against a fixed ceiling.
What it looks like: A flat horizontal resistance line on top, with a rising support line of higher lows pressing up beneath it. Each rejection at resistance is shallower than the last.
How to trade it: Enter on a close above the horizontal resistance. Stop below the most recent higher low. Target equals the triangle's height at its widest point, projected up from the breakout.

10. Descending Triangle
Signal: Bearish continuation, usually. The mirror of the ascending triangle.
What it looks like: A flat horizontal support line on the bottom, with a falling resistance line of lower highs pressing down on it. Sellers grow more aggressive while support absorbs less each time.
How to trade it: Enter on a close below the horizontal support. Stop above the most recent lower high. Target equals the triangle's height projected down from the break.

11. Cup and Handle
Signal: Bullish continuation. A longer, rounded base followed by a small pullback before the move resumes.
What it looks like: A rounded "U"-shaped bottom, the cup, followed by a small downward drift or tight consolidation, the handle. Together they resemble a tea cup viewed from the side.
How to trade it: Enter on a breakout above the handle's resistance. Stop below the handle's low. Target equals the cup's depth projected up from the breakout. This pattern takes longer to form than flags or triangles, so day traders often watch for it on higher intraday timeframes.

Part 3: Bilateral Pattern (Could Break Either Way)
Bilateral patterns signal indecision and can resolve in either direction. You trade the confirmed breakout, never a guess.
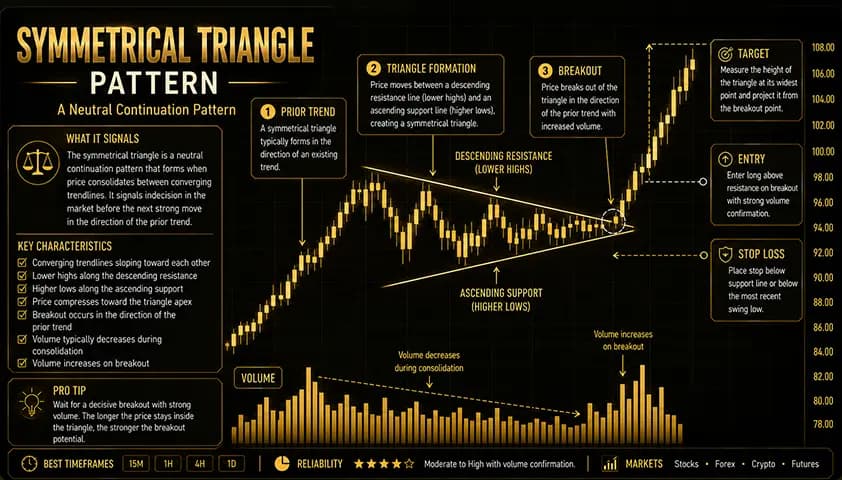
12. Symmetrical Triangle
Signal: Bilateral. It often continues the prior trend, but not reliably enough to pre-commit.
What it looks like: Two converging trendlines, lower highs and higher lows squeezing toward an apex as buyers and sellers reach a temporary balance. Because the market is genuinely undecided, false breakouts are common here.
How to trade it: Do not pick a direction in advance. Wait for a confirmed close beyond either boundary, ideally with a volume expansion, then trade in that direction. Stop on the opposite side of the triangle. Target equals the triangle's height projected from the breakout.
Quick-Reference Summary Table (All 12 Patterns)
Pattern | Group | Signals | Forms After |
Head and Shoulders | Reversal | Bearish | Uptrend |
Inverse Head and Shoulders | Reversal | Bullish | Downtrend |
Double Top | Reversal | Bearish | Uptrend |
Double Bottom | Reversal | Bullish | Downtrend |
Rising Wedge | Reversal | Bearish | Uptrend |
Falling Wedge | Reversal | Bullish | Downtrend |
Bull Flag | Continuation | Bullish | Uptrend |
Bear Flag | Continuation | Bearish | Downtrend |
Pennant | Continuation | Follows trend | Strong move |
Ascending Triangle | Continuation | Bullish | Uptrend |
Descending Triangle | Continuation | Bearish | Downtrend |
Cup and Handle | Continuation | Bullish | Uptrend or base |
Symmetrical Triangle | Bilateral | Either way | Any trend |
How to Use These Patterns as a Day Trader
Knowing the shapes is half the job. Applying them on intraday charts is where most of these chart patterns every trader should know either pay off or fall apart.
Four specifics matter:
1. Timeframes.
Day traders commonly scan intraday timeframes, the 5-min and 15-min charts especially, plus the 30-minute, to spot patterns, then drop to the 1-minute for entry timing. An hourly chart provides trend context so you are not trading a bull flag inside a larger downtrend. A pattern that appears on multiple timeframes at once carries more conviction than one visible on a single chart.
2. Volume is your primary confirmation.
Healthy patterns show volume contracting during the formation and expanding on the breakout. A breakout on weak volume is suspect, no matter how clean the shape looks.
3. Respect false breakouts.
Automated order flow has compressed pattern durations and made intraday false breakouts more frequent. Algorithms hunt the obvious stops sitting just beyond well-known levels.
Your defense is the same every time: pair every pattern with a volume check and a defined invalidation level, and let the close confirm before you commit.
4. Master 2 to 4, not 12.
This is the most consistent advice from experienced traders, and the one most listicles skip. Trying to trade all twelve dilutes your recognition speed and your consistency.
Pick two to four day trading patterns that suit your market and timeframe, study hundreds of examples of each, and learn them deeply. Depth beats breadth in pattern trading, every time.
How Reliable Are Chart Patterns? (An Honest Word)
The honest answer: patterns adjust the probability, they don’t predict the future. When a head and shoulders or bull flag form perfectly on your chart, it means a certain result is more likely, but never guaranteed.
The reliability can vary depending on pattern type, market, timeframe, and especially on the presence of confirmation. Research conducted by Thomas Bulkowski suggests that in combination with volume and additional indicators, a good number of classic formations prove effective about 60% to 70%, yet such numbers are arguable and depend on success criteria, as well as mostly refer to the analysis on daily charts. Use pattern statistics as context, never as a promise.
False breakouts happen regularly; it doesn’t mean you misread the chart. It’s why the universal approach to trading involves placing the stop-loss past the invalidation level. If the pattern fails, your losses are defined and limited. Risk management, not reading chart patterns, is the way to protect the account over hundreds of trades.
This guide is purely educational and can’t be considered investment or trading advice. Trading is risky and past performance is not necessarily indicative of future results.
Where Chart Patterns Fit a Disciplined Process
A pattern is merely a set of tools, not a strategy. In isolation, the twelve types of formations described above are just vocabulary. They only come alive within an approach such as determining trends, confirmations prior to entering trades, using volume as a filter, managing risk on all trades, specializing in particular formations, and analyzing the results.
The latter is the tough part.
Identifying the bull flag formation will take a couple of afternoons, but being able to execute trades based on these formations with proper risk management will take much longer, and is precisely what disciplined trading requires.
For those who seek guidance in building that discipline, one such avenue is offered by Audacity Capital, a prop firm established in 2012, which provides trader evaluation-based and instant-funding for traders with simulated capital from the firm, profit-sharing up to 90%, and free educational services via Trader University.
Patterns provide the setup. Discipline in your process makes you a trader. No pattern and no funding program guarantees profits; the work is yours.
Related Articles
Day Trading Guide For Beginners
Analysis For Day Trading: A Complete Guide
Understanding Day Trading Regulations: What You Need To Know
Is Day Trading Profitable? The Honest Truth, Backed by Data
Financial Instruments In Day Trading
Best Prop Trading Firms for Day Traders in 2026
Day Trading Platforms: What You Need To Know
Introduction To Day Trading Strategies: A Complete Overview
Frequently Asked Questions
There is no single most reliable pattern. The head and shoulders, double top, double bottom, and bull flag are among the most widely trusted, especially with volume confirmation on the breakout. Reliability always depends on trend context, timeframe, and confirmation, and no pattern is guaranteed to work.
Most experienced traders recommend mastering 2 to 4 patterns deeply rather than trading all twelve. Specialization sharpens recognition speed and consistency, while spreading attention across every pattern dilutes both. Learn the full map first, then pick the few setups that fit your market and timeframe.
Day traders commonly spot patterns on the 5-minute, 15-minute, and 30-minute charts, use the 1-minute chart for entry timing, and check an hourly chart for trend context. Patterns that appear on multiple timeframes at once carry more conviction than those visible on only one.
Reversal patterns, such as the head and shoulders or double top, signal that the current trend may be about to change direction. Continuation patterns, such as flags and pennants, signal a brief pause before the trend resumes. Bilateral patterns, like the symmetrical triangle, can break either way.
Chart patterns can improve the odds when combined with volume confirmation, trend context, and strict risk management, but they are probabilities, not guarantees. False breakouts are common, patterns fail regularly, and traders without a defined stop-loss and disciplined process tend to lose regardless of pattern knowledge.
A false breakout occurs when price moves beyond a pattern's boundary, then reverses back inside it, trapping traders who entered early. The common filters are waiting for a confirmed candle close beyond the level, watching for expanding volume, and placing a stop at the pattern's invalidation point.
¿Listo para aplicar un riesgo disciplinado a las criptomonedas? Explore los nuevos instrumentos de cripto de Audacity Capital y traiga su estrategia de trading.
Aprender másBoletín
Únase a nuestro boletín para mantenerse al día.
Únete a Nuestra Comunidad Social
Comienza Tu Viaje Hoy Con Nuestra Prueba Gratuita
Muestra con orgullo tus habilidades y logros a través de certificados y obtén reconocimiento por tu arduo trabajo y dedicación de posibles inversores y compañeros.
Prueba GratuitaArtículos Relacionados

Day Trading Tips: The Rules That Actually Decide Whether You Survive
Practical day trading tips ordered by what actually matters. Risk rules, discipline, execution, and the 2026 pattern day trader change explained honestly.

Why Is Pattern Day Trading Illegal? (It Is Not, and the Rule Is Gone)
Why is pattern day trading illegal? It never was. Learn what the old PDT rule required, what changed in 2026, and what traders need to know now.

15 Best Day Trading Platforms in 2026
The best day trading platforms in 2026, grouped by what they actually do. Compare brokers, charting layers and funded accounts.

8 Best Day Trading Simulators for Beginners in 2026
Explore the best day trading simulators for beginners, including paper trading platforms, strategy testing tools, and risk-free trading environments.