


How to Trade Indices: A Beginner's Guide


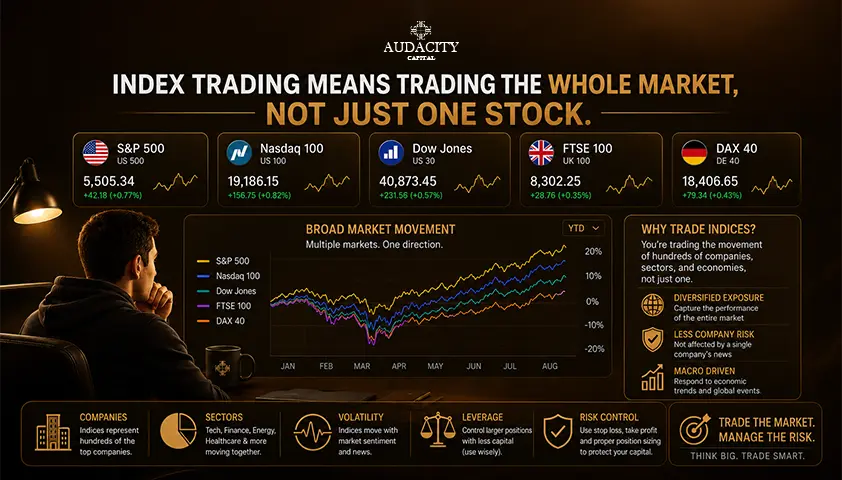
Trading indices means taking a position in the direction of a whole market segment, not a single share.
To do it, you choose a product that follows the index you want exposure to, pick a session and timeframe, build a directional thesis, calculate position size from your stop distance and the product's point value, place the order, and manage the trade against a written exit plan.
The first thing to get straight: an index itself is not tradable.
The S&P 500, DAX 40, or Nikkei 225 are calculated benchmarks. You access their price movement through a CFD, futures contract, ETF, or option, and those products behave differently.
In this guide we will cover instrument selection, what actually moves index prices, session timing, position math, cost drivers, and how funded-account rules can affect an otherwise sound setup.
What Trading Indices Actually Means?
A stock market index is a rules-based measure of a group of securities. The index provider decides which companies are included, how they are weighted, and when the basket is rebalanced. That rulebook shapes how the number on your screen moves.
Weighting matters because it changes your trade. A market-cap-weighted index like the S&P 500 can be pushed heavily by its largest constituents on any given day.
A price-weighted index like the Dow Jones Industrial Average gives more influence to higher-priced shares regardless of company size.
A basket of many companies is not automatically evenly diversified.
The benchmarks retail traders follow most often include:
- S&P 500 – 500 large US companies, market-cap weighted
- Nasdaq 100 – large non-financial companies listed on Nasdaq, technology-heavy
- Dow Jones Industrial Average – 30 large US companies, price-weighted
- DAX 40 – major German companies
- FTSE 100 – large companies listed in London
- Nikkei 225 – Japanese large caps, price-weighted
- Nifty 50 – major companies on India's NSE
Remember this one line: you analyse the index, but you trade a product designed to follow it.
Index | Market Represented | Weighting | Main Concentration | Typical Active Session |
S&P 500 | US large caps | Market cap | Tech, financials | US cash hours |
Nasdaq 100 | Nasdaq large caps | Market cap | Mega-cap tech | US cash hours |
DAX 40 | Germany | Free-float cap | Industrials, autos | European hours |
FTSE 100 | UK large caps | Free-float cap | Energy, financials, miners | London hours |
Nikkei 225 | Japan | Price-weighted | Exporters, tech | Tokyo hours |
Choose How You Will Trade the Index

"Trade the index" is not a single product decision. The instrument you pick determines price behavior, holding cost, expiry, market hours, leverage, and the legal protections you receive.
1. Index CFDs.
Contracts for difference let you go long or short on margin. They come in two common forms: cash or spot-quoted contracts that use the underlying cash market with overnight financing, and futures-based contracts that track a specific futures expiry.
CFD availability and retail protections differ significantly by jurisdiction.
2. Index futures.
Exchange-traded contracts with a defined multiplier, tick size, contract size, and expiry.
E-mini and Micro contracts on the S&P 500 and Nasdaq 100, for example, offer different notional exposures. Futures require an exchange-approved broker and specific margin.
3. Index ETFs.
Exchange-traded funds hold or replicate an index and trade like shares. Standard unleveraged ETFs are generally used for investment or longer holds.
Leveraged and inverse ETFs are separate, more complex products with daily reset mechanics that make them unsuitable for buy-and-hold thinking.
4. Index options.
Contracts whose value depends on an index or index-linked future. Options add expiry, decay, and volatility variables that deserve their own study before use.
Two products that track the same benchmark can quote different prices at the same moment. The gaps come from financing, expected dividends, futures basis, differing market hours, and expiry mechanics.
Product | Ownership | Short? | Leverage | Expiry | Overnight Cost | Main Use | Main Risk |
Cash Index CFD | No | Yes | Yes | None | Financing + dividend adj. | Short-term directional | Financing drag, jurisdiction limits |
Futures | Contract holder | Yes | Yes | Fixed date | None (mark-to-market) | Active trading, hedging | Rollover, expiry, margin calls |
ETF | Yes (units) | Only via inverse product | Only via leveraged product | None | Holding fees | Investment | Tracking error |
Options | Right/obligation | Yes | Built in | Fixed date | Time decay | Defined-risk speculation, hedging | Decay, expiry |
CFDs, futures, ETFs, and options are not interchangeable. Access depends on your jurisdiction and account type. None is universally best.
What Moves Stock Market Indices?
Index prices move when the expected value of their constituent companies changes. Those expectations are shaped by earnings, interest rates, inflation, growth, liquidity, currencies, commodities, and general risk sentiment.
1. Constituent and sector influence.
A heavily weighted technology company can move the Nasdaq 100 or S&P 500 more than dozens of smaller members combined.
A bank-heavy index like the FTSE 100 reacts differently to a rate decision than a tech-heavy index does to the same news.
2. Macroeconomic releases.
Inflation prints, employment reports, GDP, purchasing-manager surveys, and central-bank decisions can change rate expectations and equity valuations within minutes.
The economic calendar for the country behind the index matters more than global headlines that never touch its rate outlook.
3. Earnings and guidance.
A cluster of large constituent earnings can move an index even when the wider economy has not changed. Watch the reporting schedule for the top ten weights.
4. Currencies and commodities.
A strong domestic currency can pressure exporters, so the Nikkei 225 often reacts to yen moves. Oil prices can help or hurt indices depending on their energy weighting.
5. Rebalancing, inclusions, and sentiment.
Scheduled reweightings, index additions and deletions, political events, and global risk-on or risk-off moves all leave marks. Overnight futures can react to news hours before the underlying cash market opens.
6. Correlations shift by regime and by index composition.
The same CPI print may push two indices in opposite directions in different quarters. Check the composition before assuming yesterday's reaction repeats today.
How to Trade Indices Step by Step?
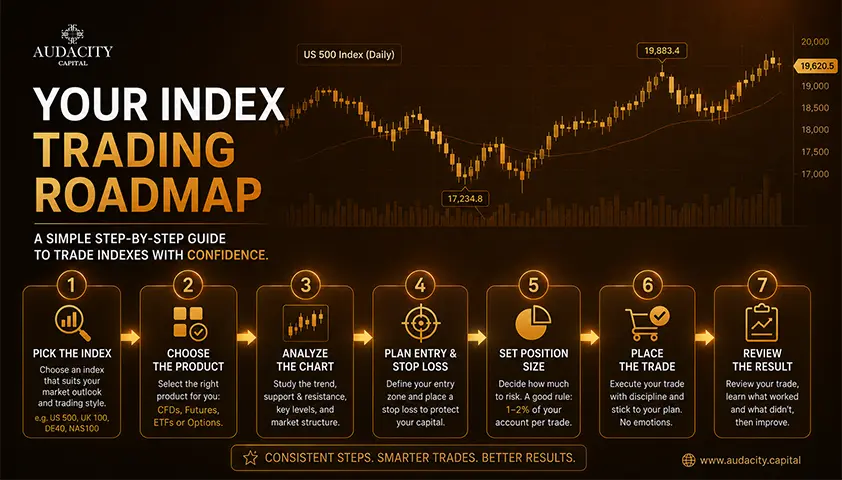
The short answer, in seven steps:
- Pick one index you understand.
- Choose the instrument and read its contract specification.
- Select your session and timeframe.
- Build a thesis with a defined invalidation.
- Fix your entry, stop, and target before sizing.
- Calculate position size from cash risk, stop distance, and point value.
- Place the order, manage the trade, and journal the outcome.
Step 1: Choose one index.
Focus on a market whose composition, active session, and main price drivers you can describe from memory. Trading four indices casually is worse than trading one carefully.
Step 2: Read the contract specification.
Every product has a spec sheet listing symbol, point value, minimum size, margin requirement, spread, commission, overnight financing, trading hours, and expiry or rollover schedule. Read it before your first trade, not after your first surprise.
Step 3: Choose session and timeframe.
Decide whether your plan is intraday, swing, or longer term before selecting a chart interval. A 5-minute chart and a weekly bias require different tools and different rules.
Step 4: Build the thesis.
Use market structure, trend, support and resistance, volatility measures, and the economic calendar. State clearly what would prove the idea wrong. If you cannot describe the invalidation, you do not have a trade.
Step 5: Set entry, stop, and exit first.
The stop belongs at the price where the setup is broken, not at an arbitrary dollar amount that feels comfortable.
Step 6: Calculate the size.
Derive it from risk, stop distance, and point value (covered in detail below). Never work in the other direction.
Step 7: Place, manage, journal.
Monitor event risk and drawdown, close according to plan, and record the trade with screenshots and notes. Opening and funding an account is administrative work. It is not the trading method.
How to Calculate Position Size for an Index Trade?
Sizing is where most beginner index trades go wrong.
"One lot" or "one contract" does not carry the same value across products or platforms. A single Nasdaq 100 E-mini contract and a single Micro contract track the same index but expose you to very different amounts of money per point.
Key terms:
- Point – the whole-number movement in the index price
- Tick size – the minimum price increment the product allows
- Contract multiplier – the dollar value assigned to each point
- Lot size / units – the platform's sizing unit, which may differ from the contract itself
The formula:
Position size = cash risk ÷ (stop distance in points × value per point)
For example, assume an illustrative account willing to risk $50 on one trade. The setup has a 25-point stop, and the product is worth $1 per point.
Position size = $50 ÷ (25 × $1) = 2 units
Change the point value to $5 while keeping the same stop distance, and the same 2 units now risk $250, 5 times the intended amount.
Change the platform to lots instead of units, and one unit of size might represent something entirely different again. Read the spec.
Margin is not a risk. A position might require only a fraction of its notional value as margin, but your loss depends on the full position size and price movement.
If the platform shows a $500 margin requirement, that is the deposit needed to open the trade, not the maximum you can lose.
Aggregate exposure. Long S&P 500, long Nasdaq 100, and long Dow positions can behave like one larger US equity bet. Each looks small in isolation, but they move together on the same catalysts.
Field | Example |
Account risk (cash) | $50 |
Entry | 18,500 |
Stop | 18,475 |
Point distance | 25 |
Point value | $1 |
Calculated size | 2 units |
Margin required | Product-specific |
Maximum planned loss | $50 (illustrative) |
*Numbers above are illustrative. A stop does not guarantee the exit price during gaps or fast markets.
When to Trade Indices?
An index may be quoted for extended hours, but its behavior changes across the day. The same product acts differently at the cash open, mid-session, near the close, and overnight.
1. Cash market open.
Liquidity and volatility often jump as underlying shares begin trading and overnight information is priced in. Spreads can widen, slippage can increase, and false breakouts are common in the first thirty minutes.
2. Mid session.
Activity may slow unless data or a major headline changes expectations. A strategy designed for the open often stops working here.
3. Cash market close.
Rebalancing, institutional flows, and end-of-day position adjustments can lift volume and produce directional moves.
4. Extended and overnight sessions.
Futures and some CFDs react to global news before cash shares open, which is why Asian sessions can move US index futures after a Fed statement. Liquidity and spreads usually differ from the main session.
5. Economic events.
Identify the central bank meetings, inflation prints, labour reports, and growth releases relevant to your chosen index. The same release can move several correlated indices at once, so plan for exposure across positions, not just one.
Time zones matter. Server time on your platform may not match your local clock, and daylight-saving shifts can move the effective open by an hour twice a year.
Session Condition | Typical Liquidity | Typical Volatility | Main Event Risk | Strategy Question |
Pre-open | Low | Elevated | Overnight news | Is spread wider than my edge? |
Cash open | High | High | Data at open | Can my stop survive the initial spike? |
Mid-session | Moderate | Lower | Scheduled data | Does my setup rely on volatility? |
Cash close | High | High | Rebalancing flows | Am I chasing end-of-day noise? |
Overnight | Low to moderate | Variable | Global headlines | Is holding worth the financing and gap risk? |
FYI: There is no universal best time to trade. The right session depends on the index, product, strategy, and your availability.
Index Trading Strategies Beginners Can Test
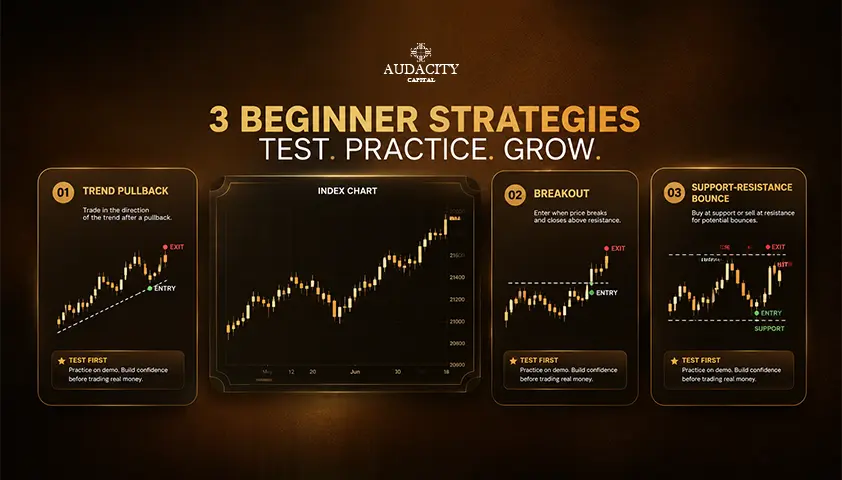
Treat the following as structures to test, not strategies that guarantee results. Every setup needs a market condition, an entry trigger, an invalidation, and an exit rule.
1. Trend Pullback
Identify a higher-timeframe trend and wait for price to pull back toward a defined structure area, such as a prior swing or a moving average that has held historically.
Enter only when a lower-timeframe trigger confirms continuation. This setup fails when the market shifts into a range or the pullback becomes a full reversal.
2. Breakout and Retest
Mark a well-defined range or a prior session's high or low. Rather than chasing the first spike, require acceptance beyond the level, then look for a retest that holds. False breaks are common around the cash open and during news events.
3. Range or Mean Reversion
Trade only when the index is rotating between established boundaries and volatility is contained. Fade extremes back toward the middle with a stop beyond the boundary. A strong trend day or a macro surprise invalidates the entire premise, often quickly.
4. Opening-Range Setup
Define an opening window, such as the first fifteen or thirty minutes of cash trading, then trade a rule-based break, retest, or failure of that range. No single opening-range length works universally across indices.
Indicators like moving averages, VWAP, ATR, RSI, and volume can support a rule set, but an indicator alone is not the strategy.
Know why the tool matches the setup.
Before any live or funded use, work each idea through historical backtesting, forward testing on demo, and demo execution with realistic spread, slippage, and session data.
Index trading strategies that look clean on a chart often break down once execution costs are added.
Market Condition | Setup | Entry Evidence | Invalidation | Main Failure Mode |
Trending | Trend pullback | Pullback into structure + trigger | Structure breaks | Trend exhausts |
Consolidation ending | Breakout and retest | Break + acceptance + retest | Retest fails | False break |
Range-bound | Mean reversion | Rejection at boundary | Boundary broken | Regime change |
Session-driven | Opening range | Rule-based break of range | Range recaptured | Whipsaw at open |
Costs and Risks That Change an Index Trade
1. Spread and commission: The visible bid-ask cost widens during the cash open, close, overnight session, and around major news. A scalping strategy with a small target can be undone by a small change in execution cost.
2. Overnight financing and dividends: Cash-index CFD positions typically receive financing charges or credits, plus dividend adjustments when constituent companies pay. Direction and amount depend on the product and whether you are long or short.
3. Futures expiry and rollover: A futures-based index price differs from the cash index because of financing costs, expected dividends, and time to expiry. This difference is called basis. Continuous charts smooth over the rollover between contracts and can hide real cost when you move from one expiry to the next.
4. Leverage and margin close-out: Leverage reduces the deposit needed to hold a position. It does not reduce the notional exposure or the loss per point. Under some account conditions, a margin close-out can occur before your planned stop level is reached.
5. Gap and slippage risk: Stops can fill materially beyond your selected level when price moves through it without available liquidity, especially around weekends, news, and earnings.
6. Concentration and correlation: A broad index can still be dominated by a handful of names or sectors, and several index positions can duplicate the same underlying risk without you noticing.
Product | Entry Cost | Holding Cost | Expiry/Rollover | Dividend Treatment | Main Execution Risk |
Cash CFD | Spread + commission | Overnight financing | None | Adjustment applied | Slippage, financing drag |
Futures CFD | Spread + commission | None to expiry | Rollover on new contract | Priced into basis | Rollover gap |
Futures | Commission per side | Mark-to-market margin | Fixed expiry/settlement | Priced into basis | Margin call |
ETF | Commission or spread | Fund fees | None | Distributed to holders | Tracking error |
Compliance note: derivatives carry substantial risk. Diversification within an index does not remove risk, and a stop loss does not fix the maximum possible loss.
Common Index Trading Mistakes
Mistake | Why It Happens | Damage | Check That Prevents It |
Same lot size across every index | Assumes contracts are equivalent | Blown risk on high-point-value products | Read point value and contract size before sizing |
Treating margin as maximum loss | Platform shows margin, not risk | Position much larger than intended | Calculate notional and loss per point separately |
Trading a headline index without knowing the product | Assumes CFD = futures = ETF | Wrong hours, wrong basis, wrong costs | Confirm cash vs futures pricing in the spec |
Chasing the first move at the cash open | Fear of missing out | Filled on wide spreads into a false break | Wait for acceptance beyond the range |
Holding through major releases without a plan | Wants to stay "in" the trade | Gap loss beyond stop | Set an event rule: flat, hedge, or reduce |
Stacking correlated index positions | Each looks small in isolation | One theme, multiple losses | Track aggregate exposure by region and sector |
Assuming broad indices are evenly diversified | Reads "500 companies" as safety | Undiscovered concentration risk | Check top-10 weights and sector split |
Ignoring financing, rollover, and dividend adjustments | Focus only on price chart | Realised P&L differs from screen | Read holding-cost line on the specification |
Switching strategies to a more volatile index | Chasing recent action | Rules fail on the new session | Retest the strategy on that market first |
How Funded Account Rules Change Index Trading
A technically valid index trade can still fail a funded account if it breaches daily loss limits, maximum drawdown, position size caps, event windows, holding rules, or prohibited-strategy conditions.
The chart may be right and the account is still finished. That’s why before you build a strategy for a funded account, map it directly to the rulebook.
Check:
- permitted index symbols,
- leverage by asset class,
- maximum position size,
- whether open equity or only closed equity counts toward drawdown,
- restrictions around high-impact news,
- overnight and weekend holding rules,
- minimum trade duration,
- and how correlated exposure is treated.
Index volatility around the cash open and macro data interacts with account-level drawdown in ways single-symbol backtests rarely capture.
A permitted trade can still breach the account through spread widening, slippage, or aggregate open loss on correlated positions.
At Audacity Capital, index instruments are available across the funded programs, including Ability Challenge, Ability One, and the FTP instant funding.
The current program rules still govern leverage, drawdown, position size, news-event timing, holding, and prohibited trading behavior. The asset list and the rulebook must be read together, not separately.
Verify current index symbols, spreads, commissions, leverage, per-position limits, news-event windows, and overnight and weekend policies against the live program documentation before you place capital at risk.
Frequently Asked Questions
No. An index is a calculated benchmark, not an asset. You gain exposure through a product designed to track it, such as an index CFD, index futures contract, index ETF, or index option. Each product has different costs, hours, and risks.
There is no universal minimum. The required amount depends on the product's contract size, margin requirement, your stop distance in points, and the account rules you trade under. A Micro futures contract, a small CFD position, and an ETF share all require very different capital.
A point is a one-unit move in the index price, but the cash value of that point depends entirely on the product. One point on a Micro E-mini S&P 500 contract is worth a different dollar amount than one point on a standard E-mini or a broker's cash CFD. Always check the point value in the contract specification.
No. Buying an index fund or ETF means holding units of a fund, usually for investment. Index trading with CFDs, futures, or options is short-term, leveraged, and designed for directional speculation. The tax, cost, and risk profiles differ substantially.
Some index products, particularly futures and certain CFDs, quote nearly around the clock on weekdays. Liquidity, spreads, and volatility change materially outside the underlying cash market hours, so a 24-hour quote does not mean a 24-hour opportunity.
News outlets typically report the cash index value. Your platform may show a futures-based price or a cash CFD price that includes financing and dividend adjustments. Basis, trading hours, and each provider's methodology account for the gap.
Neither is universally better. Indices offer exposure to a basket of companies with defined trading hours and well-known drivers, but they still carry leverage risk, event risk, and concentration risk. The right market depends on your strategy, available time, and account rules.
Yes, most prop firms including Audacity Capital allow index trading within their funded programs. The specific symbols, leverage, position size limits, news restrictions, and holding rules are set by the firm, so review the program rulebook alongside the asset list before designing a strategy.

¿Listo para aplicar un riesgo disciplinado a las criptomonedas? Explore los nuevos instrumentos de cripto de Audacity Capital y traiga su estrategia de trading.
Aprender másBoletín
Únase a nuestro boletín para mantenerse al día.
Únete a Nuestra Comunidad Social

Comienza Tu Viaje Hoy Con Nuestra Prueba Gratuita
Muestra con orgullo tus habilidades y logros a través de certificados y obtén reconocimiento por tu arduo trabajo y dedicación de posibles inversores y compañeros.
Prueba GratuitaArtículos Relacionados
Prop Firms With No Minimum Trading Days
Prop firms with no minimum trading days compared, with evaluation rules, payout conditions and who each one suits.


Trade Deficit Explained: Causes, Effects and Markets
What a trade deficit is, what actually causes it, why it can widen in a strong economy, and why the textbook currency rule often fails.
Inside Bar Pattern: Meaning, Examples and Trading Rules
Learn how to identify the inside bar pattern, compare entry and stop rules, and assess false breakouts before testing a trading strategy.

Prop Firms That Allow Weekend Holding in 2026 (Compare Firms)
Compare prop firms that allow weekend holding. Explore weekend and overnight rules, news trading, drawdown, markets, profit splits and key restrictions.