


Best Moving Average for Day Trading in 2026


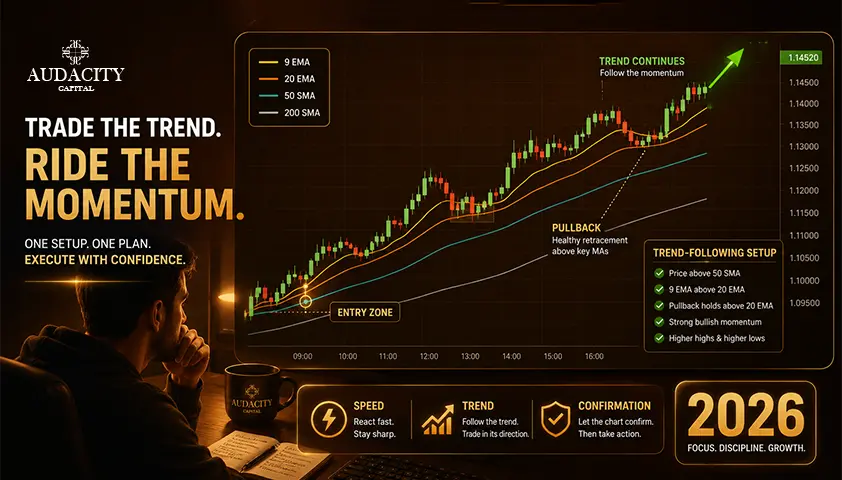
There is no single best moving average for day trading across every market and timeframe, but the 20 or 21 EMA on a five-minute chart is a strong all-round starting point.
It reacts faster than a long SMA while filtering more noise than a very fast 5 or 9 EMA.
Think in roles: a 9 EMA for fast momentum, a 20 or 21 EMA for short-term trend and pullbacks, a 50 for broader direction, and a 200 for higher-timeframe context. Remember, the number counts chart bars, not minutes.
What a Moving Average Actually Measures?
A moving average summarizes a rolling set of past bars. That is all it does.
It does not know the next price, identify fair value, or confirm that a level will hold. It is a smoothed picture of where the price has already been.
Define the period precisely.
A 20-period average uses 20 chart bars, not 20 minutes or 20 days. On a one-minute chart that is roughly 20 minutes of bars. On a five-minute chart it is about 100 minutes. On a 15-minute chart it stretches to around five hours.
The same number describes very different amounts of market time depending on the chart.
Now the lag-versus-noise trade-off.
Shorten the period and the line follows price sooner, but it also reacts to more random movement. Lengthen it and the line becomes smoother while its signals arrive later.
There is no setting that removes both problems at once. Every choice is a compromise between speed and stability.
The source input matters too.
Most indicators calculate from closing price by default, but you can change the source to open, high, low, or a composite price. Each change shifts the line.
If you switch sources between charts and tests, you are comparing different things. Keep one consistent source across every screenshot and every result.
The correction is simple: a period has no meaning on its own. It only means something in combination with the chart timeframe, the session, and the job you assign to the line.
EMA vs SMA vs VWMA for Day Trading
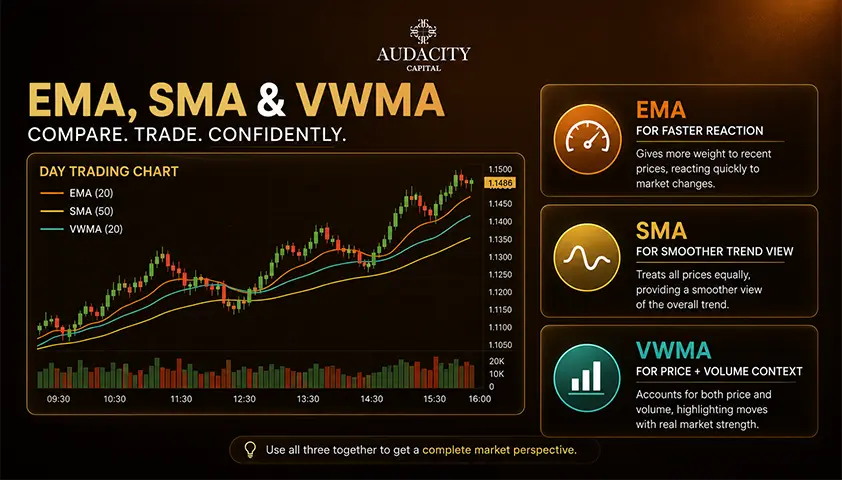
When you compare EMA vs SMA for day trading, judge them by behavior, not by claiming one is universally better. Each type answers a different question.
The EMA gives more weight to recent prices, so it reacts faster. That responsiveness makes it useful for short-term momentum and pullback tracking.
The same sensitivity produces more whipsaw in choppy conditions, because the line keeps chasing small, meaningless moves.
The SMA gives equal weight to every bar inside the window. It is slower and smoother, which makes it better suited to broader context and widely watched structural levels such as the 50 and 200 averages. Many traders watch those SMAs precisely because they are slow and stable.
The volume-weighted moving average, or VWMA, weights each bar by its volume. It can help you see whether the average is being pulled by high-participation bars or by quiet, thin ones.
Its usefulness depends entirely on the quality and meaning of the volume data for that market, which is not equal across instruments.
Faster variants exist too. WMA, HMA, and DEMA all try to change responsiveness or cut lag. Lower lag does not remove the fundamental trade-off.
In most cases these lines simply increase signal frequency, which means more entries and more of them are wrong.
Keep VWAP separate. Session VWAP is a cumulative volume-weighted average that resets according to its anchor, usually the session open.
It behaves like an intraday benchmark that institutions and desks watch, but it is not the same calculation as a rolling VWMA. Do not treat them as interchangeable.
The practical default: use an EMA for the fast execution line and an SMA or slower EMA for context. Add VWMA only where reliable volume genuinely adds information rather than another line of clutter.
The Best Moving Averages for Day Trading in 2026
Here are the best moving averages for day trading, organized by use case rather than by an imaginary profitability ranking. No line is a complete signal on its own.
1. 9 EMA: Best for fast intraday momentum
Best for: scalping and momentum tracking on one-minute to five-minute charts. The 9 EMA stays close to price and can show when a strong move is maintaining short-term pressure.
How traders use it: as a momentum line or the fast component of a two-average setup, not as an automatic buy the moment price crosses above it.
Where it fails: consolidation. During flat, ranging conditions the line generates repeated false movement because there is no trend for it to track.
What to test: whether momentum entries built around it survive after costs on your chosen instrument, or whether the crossings are just noise.
2. 20 or 21 EMA: Best all-round moving average for many day traders
Best for: reading the short-term session trend and locating pullbacks on five-minute and 15-minute charts. The 20 EMA, and the near-identical 21 EMA, filters more noise than the 9 without becoming as slow as the 50.
How traders use it: as the primary trend and pullback reference. Price above and holding above it suggests short-term upside control, and pullbacks toward it become candidate continuation zones.
Where it fails: flat markets. When no directional trend exists, price crosses this line repeatedly with no useful follow-through.
What to test: whether the pullback logic holds only when a clear trend is already present, which is its real precondition. This is the article's default answer, with that limitation stated plainly.
3. 50 EMA or 50 SMA: Best for broader intraday direction
Best for: acting as a trend filter and a deeper pullback reference. The relationship between price, the 20, and the 50 EMA helps you judge whether short-term momentum agrees with the broader session structure.
How traders use it: as a filter. If price and the 20 sit on the same side of the 50 with slopes agreeing, the session structure is more coherent than when everything is tangled.
Where it fails: it turns slowly, so it lags obvious changes. On the EMA-versus-SMA choice, the EMA turns sooner while the 50 SMA is smoother. The correct version is the one you use consistently in testing, not whichever looked better on your last chart.
What to test: whether adding this filter improves results or just reduces trade count without improving quality.
4. 200 EMA or 200 SMA: Best for major context, not precise entries
Best for: a broad directional bias and a major dynamic level on higher intraday or daily charts. The 200 EMA and 200 SMA are context tools, too slow to serve as the only entry trigger for most day trades.
How traders use it: to set a directional lean and to mark a widely watched zone that many participants reference.
Where it fails: as a precise entry. The common mistake is treating every touch as guaranteed support or resistance. It is a reference zone, not a mechanical trigger, and price structure, liquidity, and the chart timeframe still decide what happens there.
What to test: whether respecting the broader bias it defines improves outcomes versus trading against it.
5. VWMA: Best when volume participation should affect the average
Best for: instruments with meaningful centralized volume, where you want high-volume bars to influence the average more than quiet ones.
How traders use it: as a confirmation layer that shows whether a move is backed by participation or drifting on thin activity.
Where it fails: market-specific data. Spot forex volume is usually broker or tick volume rather than one centralized global total, so a volume-weighted moving average signal on spot forex is not equivalent to the same signal on a centralized futures or stock market.
What to test: whether the volume feed for your instrument is meaningful enough to justify the line at all.
Best Moving Average Settings by Chart Timeframe
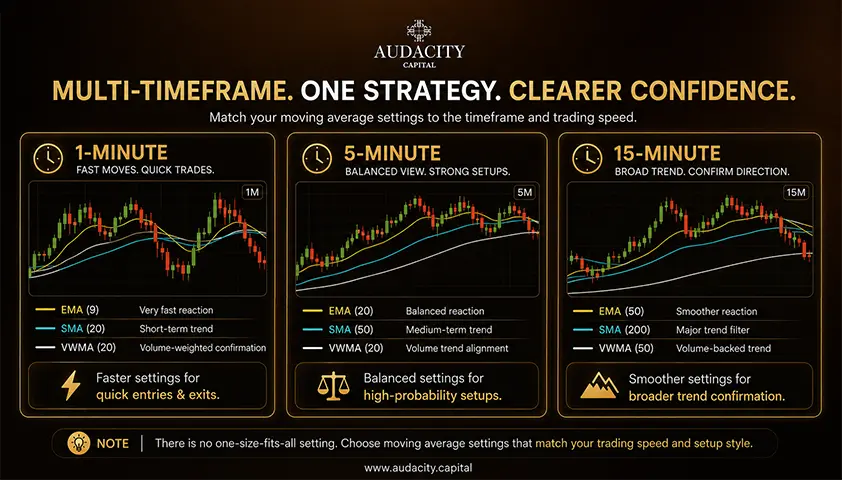
The same average changes meaning when the chart timeframe changes. These are teaching frameworks, not a universally correct template.
1. One-minute chart
A 9 EMA and a 20 or 21 EMA can show very short momentum, with a 50 average for context. The one-minute chart carries severe noise, more crossings, and much greater sensitivity to spread, slippage, and execution delay.
For the best moving average for intraday trading at this speed, a faster line only helps if your execution and costs can keep up. Most cannot.
Five-minute chart
This is the strongest default teaching setup: a 9 EMA for momentum, a 20 or 21 EMA for the active trend, and a 50 EMA or SMA for session context on the five-minute chart.
Keep the 200 on a higher timeframe, or use it only when it adds a clearly defined bias. This combination gives you a fast line, a trend line, and a filter without crowding the chart.
15-minute chart
A 20 or 21 average paired with a 50 can define broader intraday structure and cut noise on the 15-minute chart. Entries are less frequent and later, but the setup is far less sensitive to individual one-minute candles.
On multi-timeframe analysis, you can read the 50 or 200 on a higher timeframe and use a faster EMA for execution.
The rule is discipline: never mix lines without a written role for each one. If you cannot say what a line is for, remove it.
One warning on platform settings:
An indicator calculated from a higher timeframe can update only when that higher bar closes, or it can display developing values differently depending on the platform and script.
On MT5 or DXTrade, confirm how your specific indicator behaves before you build rules around it.
Read About 15 Best Day Trading Platforms
3 Moving Average Day Trading Setups
Each moving average day trading strategy below teaches process, not certainty. Every setup starts with market condition, then trigger, then invalidation and no-trade condition.
1. 9/20 EMA trend pullback
Condition: both averages slope in the same direction and price has formed a directional structure.
Trigger: price pulls back toward the 20 EMA and then confirms continuation through price action, not a blind touch of the line.
No-trade condition: the averages are flat, tangled, or repeatedly crossing. Stops and targets come from market structure, not from a fixed distance around the line.
2. 20/50 trend alignment
Condition: price and the 20 average sit on the same side of the 50, with both slopes agreeing. Use the 50 as the session filter and the 20 as the pullback reference.
Limitation: alignment confirms what has already happened. A late entry after an extended move can still carry poor risk-to-reward, even when everything looks neatly stacked.
3. Higher-timeframe 200 bias with a fast execution EMA
Condition: use the 200 average on your chosen context timeframe to avoid repeatedly trading against the broader direction. Use a faster average and price structure on the execution chart for timing.
No-trade condition: price is rotating directly around the 200 and the line is flat. That is uncertainty, not a directional signal.
These are rule structures, not profitable or high-probability setups. Each one requires testing, risk control, and a suitable market regime before it means anything.
Why Moving Average Signals Fail?
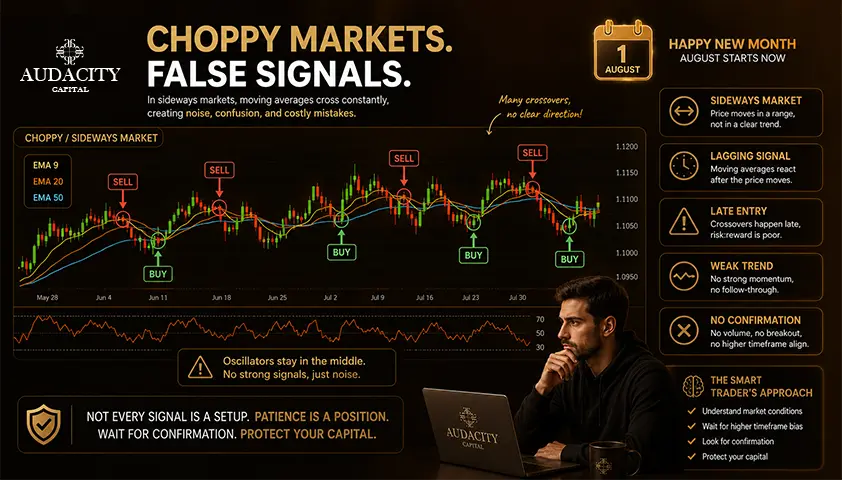
Sideways markets are the main failure environment. A trend-following line cannot create a trend, so in a range price crosses back and forth and produces whipsaw. This is not a flaw in the setting. It is the tool working normally in the wrong conditions.
1. Every moving average is late by design:
Any moving average crossover confirms a change after the price has already moved. This is why the best moving average crossover for day trading is still a lagging indicator rather than a leading one. Faster settings reduce lag only by accepting more noise, which trades one problem for another.
2. A moving average is a zone, not an exact price:
Treating a one-tick touch as a mechanical entry ignores volatility, spread, and normal overshoot. Price routinely pokes through a line and reverses, or holds well before reaching it.
3. News and gaps can make the historical average temporarily irrelevant:
The line summarizes what happened before the event. It cannot absorb new information before the market prices it in.
4. Too many averages create duplicated information:
Five lines drawn from the same closing-price series can look like layered confirmation while simply repeating the same lagged input. This is why the goal is to remove lines, not to collect every average a video recommends.
5. Exact-period optimization curve-fits history:
Choosing 17 because it beat 18 during one sample is meaningless unless the edge survives neighboring settings and unseen data. A genuine edge should not depend on one precise integer.
6. Execution costs bite hardest on the fastest setups:
A small theoretical crossover edge can vanish entirely after spread, commission, slippage, and missed fills. The faster the trade, the more these costs matter.
The regime rule: moving averages organize directional price action. They are weakest when the market is flat, discontinuous, or dominated by a sudden event.
How to Test a Moving Average Instead of Guessing?
This is the step most traders skip, and it is what separates a real method from a screenshot. Backtesting a moving average properly means defining it fully first.
Step 1: Fix the market, session, chart timeframe, price source, and rules before you test anything.
A "9 EMA strategy" is not testable until the entry, exit, stop, filters, and no-trade conditions are written down. If you cannot define it, you cannot test it.
Step 2: Include every trading cost and use realistic order assumptions.
Model spread, commission, slippage, and latency. The faster your chart, the more these inputs decide whether an edge is real or imaginary.
Step 3: Use separate development and out-of-sample periods, then run walk-forward testing through different volatility and trend regimes.
One strong month proves nothing about durability. A method that only worked during a single trending stretch will fail the moment conditions change.
Step 4: Compare neighboring periods.
If 20 works but 19 and 21 collapse, your result is likely fitted to noise rather than a stable pattern. Robust logic does not hinge on one exact number.
Step 5: Measure the full picture.
Expectancy, number of trades, maximum drawdown, profit factor, average win and average loss, longest losing streak, and time in market. Win rate alone can hide a strategy whose losses are far larger than its wins.
Step 6: Finally, forward-test manually or in simulation before you risk capital.
The purpose is to confirm execution behavior and rule clarity, not to prove future profitability.
Any result you rely on must be labeled illustrative or must cite its full methodology, including instrument, period, costs, sample size, and drawdown.
Historical or simulated performance does not establish future results.
Using Moving Averages on a Funded Trading Account
If you trade a funded account, one point matters above all: a moving average does not manage your account. It cannot control your daily loss limit or your maximum drawdown.
You still decide position size, stop placement, aggregate exposure, and whether a late signal is worth taking at all.
Fast crossover systems can overtrade in ranges. That produces a stream of small losses plus transaction costs, which is especially damaging under a fixed daily loss or total drawdown limit.
A line that crosses ten times in a flat hour can quietly eat through a loss buffer.
A stop placed only on an average can sit too far from price after volatility expands, or too close during normal noise. Risk must be calculated from your actual stop distance and position size, not from wherever the line happens to be.
Watch correlation. Several related markets can flash the same moving-average signal at the same time. Treat those as one combined directional exposure, not as three independent confirmations, because they can all lose together.
There is a clear line between using an average manually and coding it into an automated system. Once you build the setup into an EA or automated script, your firm's current rules on EAs, trade frequency, copy trading, and prohibited behavior apply.
Turn Your Knowledge Into Opportunity
Practice your trading skills in our Free Monthly Trading Competition, where top traders can earn a Free Funded Account Challenge.
Frequently Asked Questions
Neither is universally better, because they do different jobs. The 9 EMA is a fast momentum line for quick moves and scalping, while the 20 EMA is a short-term trend and pullback reference that filters more noise. Many traders use both together, with the 9 for timing and the 20 for the active trend.
A 9 EMA with a 20 or 21 EMA is a common momentum pairing, but the answer comes with heavy warnings. The one-minute chart is dominated by noise, frequent crossings, and high sensitivity to spread and slippage. Any edge here can vanish after execution costs, so test carefully before trading it live.
Yes, as a filter rather than a trigger. The 50 EMA helps you judge broader intraday direction and marks deeper pullback zones. It turns too slowly to serve as your only entry signal, so most traders pair it with a faster line for timing.
Use the EMA for fast execution lines and the SMA or a slower EMA for context. The EMA reacts sooner because it weights recent prices, while the SMA is smoother and steadier. The right choice depends on the job you assign to the line, not on one being superior overall.
Yes, but as context rather than a precise entry tool. The 200 EMA or 200 SMA sets a broad directional bias and marks a widely watched dynamic level. It is far too slow to trigger most day trades, so treat it as a reference zone, not a mechanical signal.
No. VWAP is a cumulative volume-weighted average that resets with its session anchor, functioning as an intraday benchmark. A rolling moving average, including a VWMA, uses a fixed lookback window instead. They are different calculations and should not be treated as interchangeable.
No. A moving average summarizes past price and confirms movement after it has already happened. It can support a reversal setup only when combined with market structure, volume, and other evidence, and even then it does not predict anything.
Usually two or three at most, each with a clearly defined role. Adding more lines built from the same price series duplicates lagged information and clutters the chart. If you cannot state exactly what a line is for, remove it.
Day trading carries high risk and can produce rapid losses. This article is educational and not financial advice. No moving average, crossover, or chart setup guarantees a profitable trade, and past or simulated results do not establish future outcomes. Test any method thoroughly and confirm all program rules at source before you trade a funded account.

Ready to apply disciplined risk to crypto? Explore Audacity Capital's new crypto instruments and bring your trading strategy.
Learn MoreNewsletter
Join our newsletter to stay up to date on features and releases.
Join Our Social & Community

Start Your Journey Today With Our Free Trial
Proudly showcase your skills and accomplishments through certificates and get recognition for your hard work and dedication from potential investors and peers.
Free TrialRelated Articles

How to Create a Day Trading Risk Management Plan?
Build day trading risk management strategies with daily loss limits, position sizing rules, drawdown controls, and a practical trading checklist.

15 Best Day Trading Platforms in 2026
The best day trading platforms in 2026, grouped by what they actually do. Compare brokers, charting layers and funded accounts.
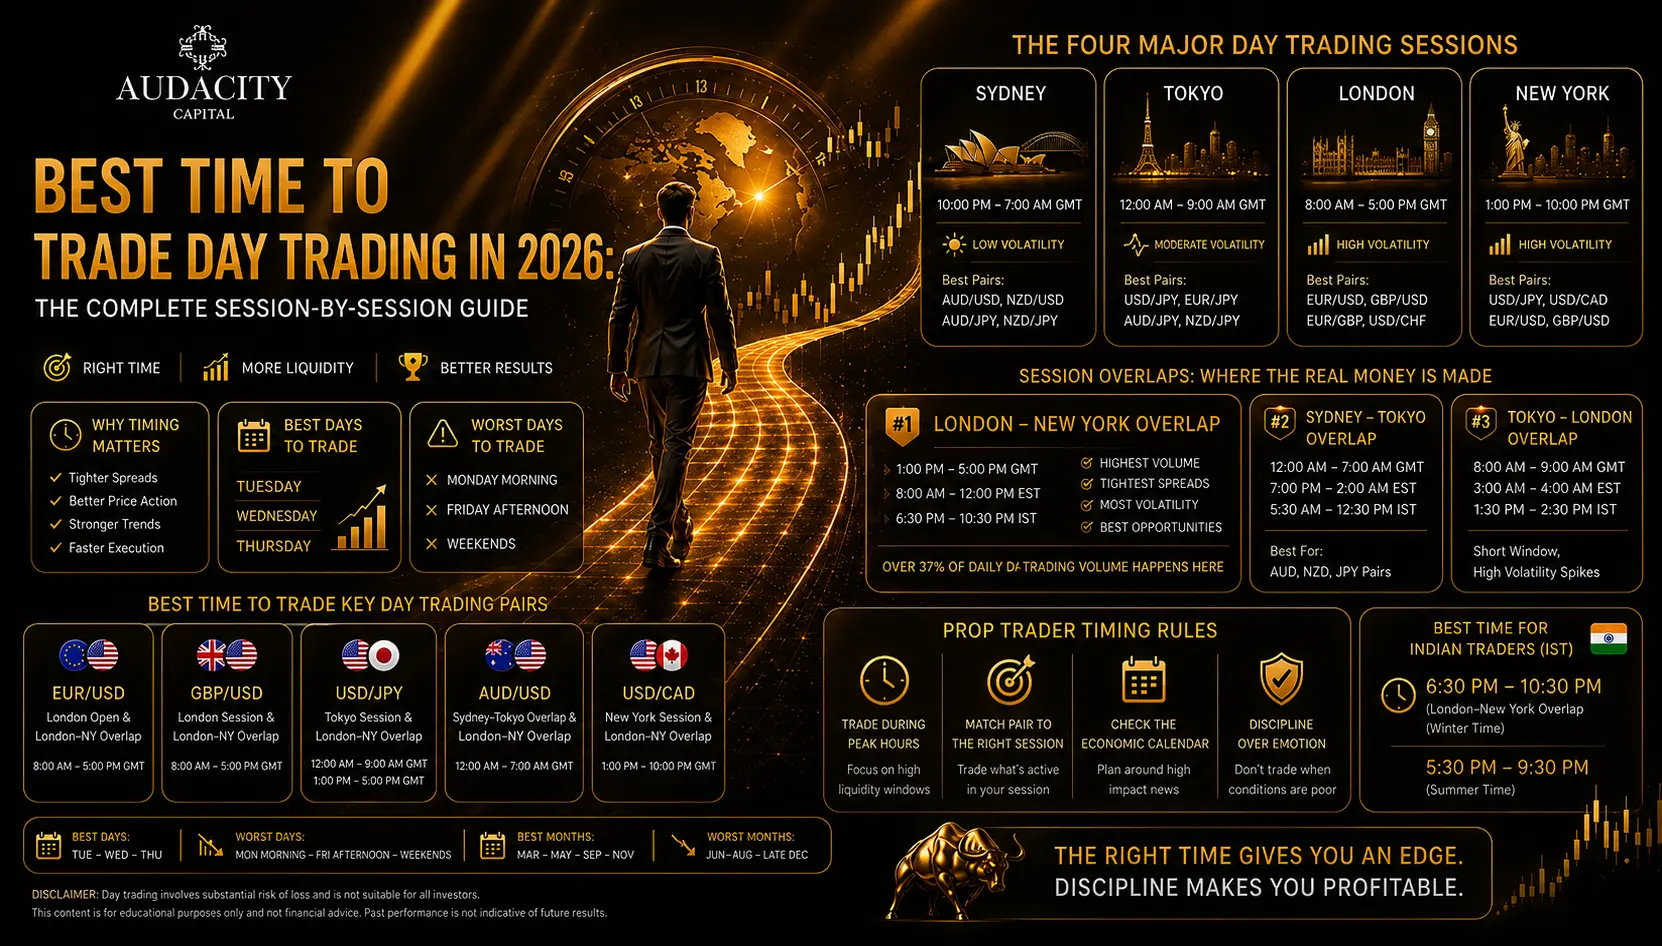
Best Time Frame for Day Trading (2026): 5-Minute vs 15-Minute vs 1-Hour Charts
Discover the best time frame for day tradingin 2026. Compare 5-minute, 15-minute, and 1-hour charts, learn multi-timeframe analysis, and find the right chart for your trading style.
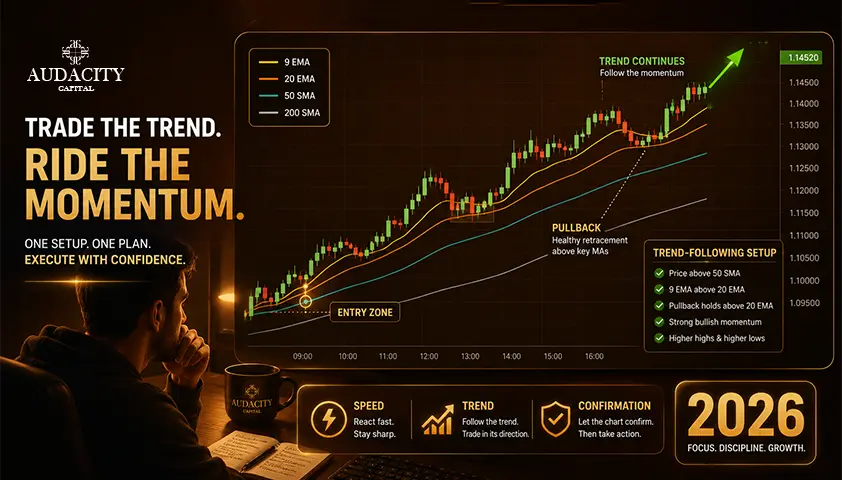
Best Moving Average for Day Trading in 2026
Compare the 9, 20, 50 and 200 moving averages for day trading, when each works best, and how to avoid lag, noise and false signals.