


10 Best Forex Swing Trading Indicators and How to Use Them


Forex swing trading is a type of forex trading when you plan to hold a currency pair from several days to weeks. It seeks to profit from price movements over that particular period.
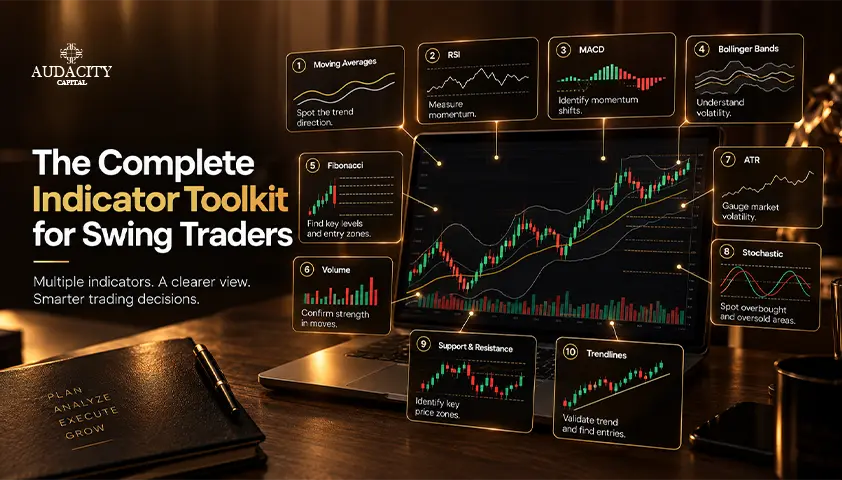
Indicators such as moving averages, RSI, MACD, ATR, and others can help you to analyse these movements, identify trends, assess momentum, and find potential entry and exit points.
However, choosing the right indicator, adjusting its settings, deciding the combination, is no easy task.
Every indicator has a different purpose, strategy, market conditions, and limitations. In this guide, we dig deep into forex swing trading indicators, explain how they work across different markets and compare them based on strength, risk & limitations to help you decide which indicators suit your trading style.
What Are Forex Swing Trading Indicators?
Forex swing trading indicators are tools used to find opportunities in currency pairs that traders may hold for several days or weeks. These indicators help you to judge market trend, volatility, momentum, price levels of a currency pair.
Indicators can be categorised into different categories.
Category #1: Calculated indicators (moving averages, MACD, RSI, Bollinger Bands, etc) apply mathematical formulas on the historical prices.
Category #2: Chart-analysis indicators (support, resistance, trendlines, price channels) use visual patterns available on the chart to manually plot anchor points.
Category #3: Leading indicators (RSI, Stochastic) capture price movement early to signal possible momentum change or market direction. However, their early signals may sometimes lead to false alerts.
Category #4: Lagging Indicators (MA crossover, MACD) are slow to give signals, capture movements that have already happened and in the range-bound market, may lead to whipsaws.
While indicators provide clues about price movements, they cannot determine risk, position size, sudden news events that lead to price spikes, or trade setups.
How to Choose the Right Indicator for Forex Swing Trading
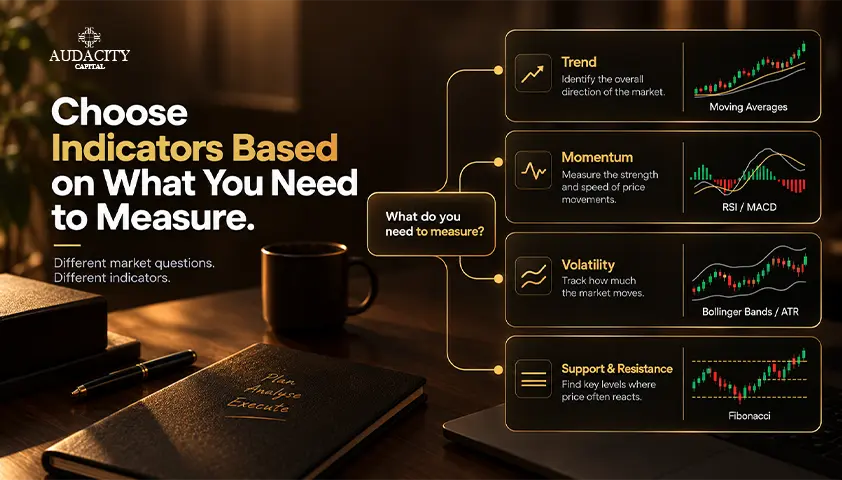
Before we dive into best indicators for swing trading, lets understand how to select the right indicators:
1. Trend Direction
Before taking a trade, you must ask: “Which direction is the market moving overall?” Rely on tools like moving averages, trendlines, price channels to identify the higher-timeframe trend.
2. Momentum and Entry Timing
Once the market trend is confirmed, the next question in line is: “Is the price move gaining or losing strength right now?”
Momentum oscillators tools like RSI, MACD, or Stochastic judge the strength of momentum and time of your entry.
3. Volatility and Risk Distance
It is also important to manage risk as per your trades. Therefore, ask questions like, “How far is the price moving on average?” or “Where should I place my stop-loss?”
ATR or Bollinger Bands can help you to judge the price volatility and help in setting stop-loss or targets.
4. Participation and Price Levels
To confirm your theory, the final question you must always ask is: “Where is the trade happening, and is market interest increasing?”
Use support and resistance lines or Fibonacci retracement levels along with tick volume to mark important price zones where the price may reverse, bounce or react sharply.
10 Best Forex Swing Trading Indicators and Tools
Listed below are best swing trading indicators categorised into calculated indicators and chart-based analysis tools:
1. Moving Averages: SMA and EMA
Moving averages help to assess the currency pair trend direction, smoothing the short- term price movements.
A simple moving average (SMA) gives equal weight to all candles in the chosen timeframe whereas, an exponential moving average (EMA) gives more weight to recent prices. Here’s how to use moving averages in forex trading:
Slope: Slope refers to the angle, or the direction in which the moving average is pointing. An upward or rising slope shows a bullish trend, as opposed to a downward or falling slope that indicates a bearish trend. A flat or horizontal line usually signals a sideways or range-bound market.
Price Position: When the price is above the rising moving average, it supports a bullish view. However, when the price is below the falling moving average, it reflects a bearish market. If the price frequently crosses a flat moving average, it is advised to wait for a stronger trend.
Alignment: You can also use multiple moving averages such as 20-day, 50-day and 200-day and their alignment to judge the direction. If EUR/USD is trading above all these averages, the 20-day average is above the 50-day average and the 50-day average is above the 200-day average, this alignment reflects a bullish market.
When the alignment is reversed, for instance, the EUR/USD is trading below all three averages, the 20-day average is below the 50-day average and the 50-day average is below the 200-day average, you may look for selling opportunities.
Pullback before Crossovers: While beginners wait for the crossover, swing traders should look out for a pullback. Wait for the price to move towards the moving averages, while the slopes remain aligned.
Look for a bullish candle to bounce off the MA line. The key is to not act when the price has merely touched the MA line, but wait for a formal crossover with a better risk-to-reward ratio and tighter stop-loss.
However, MAs depend on historical prices. Much of it is reported when the movement has already happened. It is also advised to avoid whipsaws (currency pair prices are moving between a flat MA line) as it may create false signals.
2. Relative Strength Index (RSI)
The Relative Strength Index (RSI) assesses the momentum of a currency pair price change on a scale from 0 to 100.
The standard setting of a RSI indicator is 14 periods on a daily chart, and the latest 14-hour candlesticks on a 4-hour chart.
The 50-line: This line divides the RSI into two halves. When the RSI is above 50, it may indicate a bullish trend. When RSI is below 50, it reflects a bearish trend.
0 (Overbought) and 30 (Oversold) zones: When the price crosses above 70, it shows that buying momentum is strong. In some sessions, the price may continue to rise while the RSI above 70 is also sustained. The price may have moved quickly, but it does not mean that the price will crash right away.
Similarly, when the price crosses below 30, it shows a strong downward momentum. For swing traders, it is advised to wait and see how the price reacts after reaching these levels. You may either look for a pullback, or reversal before trading.
RSI range shifts: In a bullish market, RSI may stay between 40-80, wherein the 40-50 levels acts as support during pullbacks. Similarly, RSI may stay between 20-60 during a bearish market, wherein the 50-60 levels act as resistance.
Divergence: When price and RSI move in opposite directions, it leads to divergence. The divergence reflects that the current trend is losing strength.
For instance, when GBP/USD price makes a new low, but RSI reads higher than its previous low; it signals a weakening selling pressure where you may prepare for a long entry or exit short trades.
Likewise, when GBP/USD price makes a higher high, but RSI does not reach its previous peak; it may signal the beginning of bearish trend.
3. Moving Average Convergence Divergence (MACD)
MACD helps forex swing traders to judge the speed, strength, & direction of a currency’s trend. It uses 12, 26, 9 as default settings to track the average price over these respective timeframes.
You can spot a bullish trend, if:
- MACD line (primary line & the difference between 12-period & 26-period average) crosses above the signal line (9-period average plotted above the MACD line)
- The histogram bars (set of vertical bars that shows the distance between signal and MACD line) grows above the zero.
- The price supports this alignment with higher highs and higher lows.
You can also assess the momentum when the histogram bars are shrinking in height. It means that the current trend is losing its steam and may warn of an upcoming market reversal.
It is also important to consider that MACD relies on past data and signals may often appear when the price move has already started occurring.
And if you already use moving average indicators, then using MACD will display more or less similar information.
4. Bollinger Bands
Bollinger bands are one of the best forex indicators for swing trading that capture the volatility in a currency pair. They help to identify if the currency pair price is deviating or moving unusually far from its recent average. The band has three components:
- Middle line (20-day average): Using SMA, it shows the average price action of the latest 20 candles.
- Outer Bands (Standard deviation): These two lines sit above or below the middle line. These bands help you to judge how far the price has spread from its average.
The distance between the upper and lower band is called band width.
Contraction: When the upper & lower bands move close together, they get very narrow. This signals a low volatility. However, in forex, a tight squeeze is a warning sign of a massive price breakout or an upcoming strong trend.
Expansion: When the bands move further apart, and price suddenly shoots up or down, it reflects an increasing volatility. If prices rise and bands widen, it may lead to a bullish trend. Similarly, if prices fall and brands widen, it may lead to a bearish trend.
A close outside the band: In cases when prices close outside the upper band, it may indicate that buying pressure is strong. If price closes below the lower band, selling pressure is strong.
Also, price touching the band alone, does not confirm a trend. You must wait for other signals to confirm the trend.
5. Stochastic Oscillator
The Stochastic Oscillator is a measure of whether the price is closing near the top or bottom of a defined range. It helps to compare a currency pair’s closing price with its recent price range. The indicator has the following settings:
- 14-period setting: This setting compares the lowest closing price with the highest high and lowest low over the last 14 candles.
- 3-period %K setting: It assesses where the latest closing price sits within that 14-period range.
- 3-period %D: Acting as a signal line, this setting is a 3-period moving average of the smoothed %K line.
The indicator sits between 0-100. Readings above 80 are overbought and readings below 20 are oversold categories.
You can use these settings to spot:
- Upward momentum (%K crosses above %D). If this happens below 20, it may signal a trend reversal, particularly, if the stock is near support level.
- Downward momentum (%K crosses below %D). If this happens above 80, it may signal a potential reversal, especially if the price is near a resistance level.
Read about Momentum Trading Strategy
This indicator works best in sideways markets or in pullback cases. During range-bound markets, it helps to identify support/ resistance levels.
Similarly, in strong uptrends, you can wait for the currency price to pull back temporarily and for the Stochastic lines to drop down near 20. When they cross upward there, use it to take the trade in the direction of the main trend.
6. Average True Range (ATR)
Average True Range measures how many points a currency pair moves around in a given timeframe. While it may not tell you the direction of the market trend, it does help you to measure the volatility.
The default setting of ATR is a 14-period setting. The indicator appears as a single line below the main price chart.
When the ATR line is rising, the market is volatile and choppy. Similarly, when the line is falling, the market is calmer and moving in small ranges. You can use ATR for:
- Stop-Loss: If the ATR of EUR/USD is 80 pips, you may consider a stop-loss at 120 pips, that is 1.5 times of the current ATR.
- Position Size: A volatile currency pair with high ATR means the market is moving wildly. Therefore, consider a small position size to keep your trade safe.
- Trailing Exits: You might set the trail exit at 2 ATR below the highest price reached in a long trade.
7. Forex Tick Volume and Volume Tools
Forex traders rely on forex tick volume, which measures how many times price changes happened during a specific candle or time period.
A high tick volume means prices are changing too frequently, many orders are hitting the market while low tick volume means a slow-moving market. You can use tick volume to assess:
- Breakouts: When the price breaks above a major support or resistance, it is supported by a clear spike in tick volume. A high forex tick volume can confirm the trend, whereas low tick volume will help you avoid fake signals.
- Rejection: When price hits a barrier and bounces away, a jump in volume can mean strong buying or selling pressure has defended that level.
8. Fibonacci Retracement
Fibonacci Retracement is a chart-analysis tool that helps you to judge potential pullback levels where a currency price might pause or reverse before continuing the broad or main trend. To use this tool, you’ll have to connect and draw two major points:
- Swing Low: Lowest point of recent price move.
- Swing High: Highest point of recent price move.
Since the selection of these points differ as per trading style, market moves, & other factors; use a clear, logical rationale to draw them
In forex trading, you may watch out for:
- 38.2%: A shallow pullback, when buyers step in quickly to support strong trends.
- 50%: The halfway point of previous price moves.
- 61.8%: Often termed as golden ratio, leading to a deep pullback where you may watch for trends to resume.
However, a fibonacci retracement is a strong zone of interest. Not a guarantee of price confirmation. So traders must pair this indicator with other signals before acting a trade.
9. Support and Resistance
Support and Resistance are price-level tools used to assess areas where a currency pair price may pause, break or reverse. When price hits either of these areas, watch out for:
Reactions: How far and strong the price bounces away from that level. Quick and strong bounces reflect that buyers & sellers are actively defending that level.
Closes: A candle’s closing point can tell you if the particular level is held or broken. For instance, if the candle closes past the resistance zone, it may signal a breakout. However, if the candle’s wick pokes through that zone but closes below it, the level has been defended.
Role Reversals: Once a particular support or resistance is broken, the role flips. For example, if EUR/USD breaks above 1.0900 and trades above it for several sessions, the 1.0900 which was acting as resistance earlier has now become a new support level.
10. Trendlines and Price Channels
These indicators are visual tools that help you to identify the direction and boundaries of the market. A trendline connects two points: swing high and swing low to show the general direction of the price.
A price channel, on the other hand, uses two roughly parallel lines to mark the boundaries of a price move.
You can use trendlines and price channels to assess:
- Consistent Anchor Points: An upward trendline should connect rising lows while downward trendlines should connect falling highs.
- Touches: While you may draw a line with two anchor points, it takes a third touch to confirm the validity of the trend.
- Slope: A steep line indicates a faster move and the price action may be difficult to sustain. A flattening slope can suggest a trend is losing strength. But a 45-degree slope signals a healthy trend.
- Breaks & Retest: When the price cuts straight through the trendline, wait for it to loop back and retest the broken line from the opposite end. If the broken uptrend line now acts as new resistance, it confirms the old trend is over and a new move downward is beginning.
Do not ignore price spikes, bend trendlines or slice through candle bodies to confirm your theory. If the market does not show clear, logical swing points, do not force a line onto the chart.
Best Forex Swing Trading Indicator Combinations
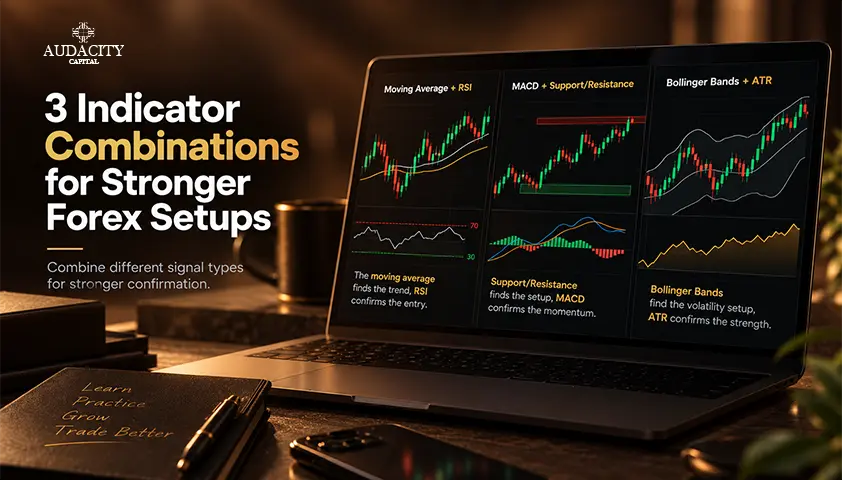
There’s no single or a set of best indicators for swing trading that can define your trade setup. Therefore, it is advised to use the right combination of indicators such as trend indicator, volatility indicator or different swing trading timeframes to set up your trade.
Listed below are some of the best forex swing trading indicator combinations:
Trend Pullback: 20 and 50 EMA, RSI, and ATR
This combination will help you join an existing market trend after a temporary price dip.
- Market Condition: A strong and clear bullish/ bearish trend reflected in the price pattern.
- Context: The 20-day EMA is above the 50-day EMA. The RSI must pull back from the 70 or 30 levels toward the middle, showing a temporary pause in momentum.
- Entry: Wait for the closing price of the candle after the RSI resets.
- Invalidation: Set it at a distance equal to 1.5 times the ATR, beyond the recent price swing or high.
- Exit: Exit when price crosses back to 20 EMA or RSI hits the opposite direction.
- Failure: The setup can fail in a sideways market or when the trend is reversed completely instead of minor pullback.
Volatility Breakout: Bollinger Band Squeeze, MACD or Tick Volume, and ATR
After a rangebound market, this setup can identify potential breakouts or capture sharp price movements.
- Market Condition: A low-volatile market where the currency pair price has moved within a narrow range and Bollinger Bands are squeezed closely together.
- Context: Watch out for Bollinger Bands and understand how closely they’re squeezed together.
- Entry: Enter when a price candle closes outside the outer Bollinger Band, confirmed by the expanding MACD, or by a surge in tick volume.
- Invalidation: Use the middle line of Bollinger Band to place your stop-loss; or use distance based on 1x ATR of a currency-pair breakout candle.
- Exit: Exit when the price touches the opposite Bollinger Band or MACD indicates a slow-down in momentum.
- Failure: This occurs when price briefly pokes outside the band but reverses quickly inside it caused by low liquidity, economic news, and sudden reversals.
Range Reversal: Support and Resistance With RSI or Stochastic
This setup helps you to profit in a range-bound market:
- Market Condition: A sideways market with clearly defined and tested support and resistance levels.
- Context: Price must touch the outer boundary of the range. RSI or Stochastic showing extreme readings (above 80 for resistance or below 20 for support).
- Entry: Wait for the bullish rejection candle and enter near the support area. The oscillator must turn back towards the center.
- Invalidation: Place your stop-loss below the support zone and the recent rejection low. For a short trade, place it above the resistance zone and the rejection high.
- Exit: Set your initial target at the middle range but an ambitious target can also be set at the opposite boundary.
- Failure: The price may break through the boundary and may not bounce, leading to immediate triggering of stop-loss
Comparison At A Glance
The table below compares the best indicators for swing trading combinations:
Basis | Trend pullback | Volatility breakout | Range reversal |
Market Conditions | Clear upward or downward trend | Tight consolidation before a possible expansion | Established sideways range |
Tools | 20 & 50 EMA | Bollinger Bands | Support and resistance zones |
Confirmation | RSI turns with the trend; candle closes in the trend direction | Candle closes beyond the range; MACD or tick volume supports the move | Rejection candle at a boundary; RSI or Stochastic confirms a turn |
Stop-loss basis | Beyond the recent swing point | Beyond the breakout structure | Beyond the support or resistance zone |
Exit approach | Fixed reward-to-risk target or trailing stop | Range-height projection or trailing stop | Middle of range, then potentially the opposite boundary |
Main risk | Trend weakens or reverses | False breakout | Range breaks and price continues in one direction |
Forex Swing Trade Example: From Market Context to Exit
Lets understand the forex swing trading, the best swing indicators and the trade setup with the example below:
1. Establish the Higher-Timeframe Bias
The first and foremost step is to confirm market trends using a higher-timeframe. Consider this:
- EUR/ USD price on a daily timeframe is creating higher highs and higher lows
- The 20 EMA is above the 50-EMA,
- Both the moving averages lines are upward sloping
The framework signals an overall trend. You may then move to next steps.
2. Define the Setup and Entry Trigger
Once the broader trend is confirmed, switch to a lower timeframe to find entry points.
- EUR/ USD price pulls back to 1.0840 (support zone and also closer to 50-EMA).
- RSI drops from 72 to 38.
This may reflect a healthy momentum reset. However, this alone cannot trigger your entry. Wait for the 4-hour bullish candle to close above 1.0865, clearly cutting straight through the support area, and the RSI turns upward above 40.
You may then enter a trade right at the close of 1.0865.
3. Set the Stop, Position Size, and Exit
- Your stop loss can be at 1.0805 or below this invalidation point (20 pips below the recent swing low of 1.0825.
- The total risk distance now becomes 60 pips (1.0865 entry minus 1.0805 stop-loss).
- Use ATR to verify the stop-loss. The 4-hour ATR reads 35 pips. Your 60-pip stop distance is roughly 1.7 times the ATR.
- With an account balance of 10,000andarisklimitof1%(100), your position sizing is $16,666 units or 0.16 mini lots. (PositionSize=Account RiskStop Distance in PipsPipValue standardunit)
- Set your exit around a major resistance around 1.0985. The reward-to-risk ratio now becomes 2:1, a target distance is safe at 120 pips.
- Do not forget to account for spread, overnight swap fees, brokerage that may reduce profit margins.
4. Review the Trade and Failure Case
The trade must be assessed on its quality, whether the rules were followed or not, instead of just profit or loss. For instance, your trade hits a stop-loss at 1.805; then immediately accept that loss and exit the trade.
Or consider another example, where the price falls below the support, before the entry. In this case, simply abandon the trade, as the original setup is invalidated.
Be it profit, or loss, always review the trade after closing the position.
Best Timeframes and Settings for Forex Swing Trading Indicators
Use a higher-timeframe to confirm broader trends and identify support and resistance. For instance, for trades lasting a few weeks, use a weekly chart, for trades lasting a few days use a daily chart.
Move to a lower time-frame (4-hour chart) to define your trade setup, judge the pullbacks, momentum resets, or volatility squeezes.
And, most importantly do not use too many indicators simultaneously for more confirmation.
When it comes to indicator settings, adjusting it depends on your holding period or market volatility. For instance, if your trade lasts several weeks, you may adjust RSI from 14 to 21-period. Similarly during volatile markets, you can move Bollinger Band deviation from 2.0-2.5.
In such cases, adjusting indicator settings is acceptable. However, the default settings (14-period RSI, 20-day EMA) are popular because they cut out the short-term market noise, and avoid the problem of curve-fitting.
When Swing Trading Indicators Give False Signals
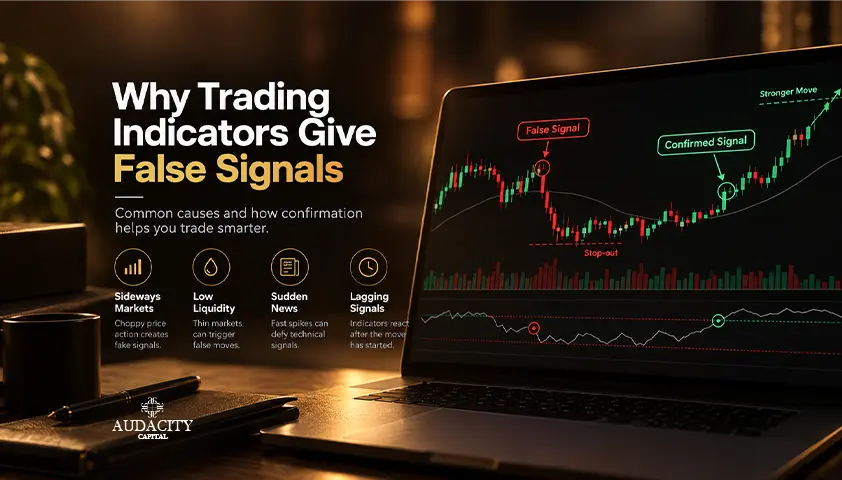
Sometimes even the best forex indicators for swing trading may give false signals. It is important to understand when this can occur and how to prevent it.
Market-Regime Mismatch
When indicator settings do not align with the prevailing market conditions, it may lead to false signals. For instance, trend-following tools (moving averages) create whipsaws in the sideways market.
Conversely, reversal indicators (RSI or stochastic) may lead you to take losing short trades as they give overbought signals in a strong uptrend.
Indicator Stacking and Confirmation Bias
Using overlapping swing trading indicators such as RSI, stochastic and MACD may confirm an overbought signal. However, what you fail to see is all three indicators are calculating momentum data just in three slightly different ways.
Instead, you can use the following framework:
- Primary Signal: An indicator (like RSI reset or candle bounce) or price pattern that triggers your entry
- Complementary Filter: A tool measuring a different market dimension to filter out bad setups (e.g., a 50 EMA for trend direction or Bollinger Bands for volatility).
- Risk Management Tool: A tool (ATR) to measure volatility for stop-loss placement.
Treating a Signal as a Forecast
Often a moving average crossover, a bollinger band touch, or RSI divergence is treated as a signal. But it leads to mistakes such as entering mid-candle or curve-fitting.
Instead, always wait for confirmation signals such as candle to close fully, define a clear trade invalidation point, accept the stop-loss or abandon the trade, if the setup fails.
How to Backtest a Forex Swing Trading Indicator Combination
Backtesting a trade can help you assess how the best swing trading indicators combination, the entry signals, stop-loss, and exit conditions would have performed on historical price data. The process includes:
- Write clear objective rules for market condition, indicator settings, entry trigger, stop-loss, position size, and exit method.
- Collect sufficient data of at least 100-200 consecutive trades across different market conditions.
- Include trading costs (spread, slippage, brokerage, overnight swap fees).
- Use one part of historical data to define your strategy and another part to test the final rules without adjustments.
- Use paper trading or demo accounts to practice your trades).
While backtesting, it is important to record metrics such as sample size, win rates, average win/loss, average money you expect to gain/lose, profit factor, maximum drawdown and consecutive losses.
Do not test individual parts of strategy in isolation. Test the end-result using market conditions, entry, stop-loss, position-size, and exit rather than treating each of these metrics as individual filters.
Conclusion
Forex swing trading indicators answer different trade-related questions from volatility to momentum, support/ resistance levels to price movements, and speed to strength.
However, indicators can help you assess the market, not decide the entry or exit of your trades or act as standalone confirmation to take a trade. You must choose indicators depending on the market condition, adjust their settings, avoid overlap and curve-fitting, and wait for price action to signal a confirmation.
Successful forex swing trading depends on the right use of indicators, paired with adequate risk management, strict rules and clear execution.
Related Articles
Forex swing trading : complete guide
6 Best Forex Swing Trading Strategies
is Day Trading Easier than Swing Trading?
Forex Risk Management Strategies
Support and Resistance Trading Guide
Candlestick Patterns in Forex Trading
Frequently Asked Questions
You cannot rely on a single indicator for forex swing trading. The right indicator depends on the market trends, momentum, volatility, trading activity, your trading style and other factors.
While the timeframe depends on your holding period and trading strategy, traders commonly use a daily chart or a 4-hour timeframe to assess price movements and confirm broader market trends.
There’s no particular number of indicators to be used in swing trading. Though, it is advised to keep the number small, (one primary, one complimentary and one risk management). Do not use more indicators to seek more confirmation as it may lead to unnecessary information or mixed signals.
While leading indicators capture price movements early they also lead to false signals during volatile markets. It is important to treat leading indicators like RSI or stochastic to identify conditions and wait for confirmation before taking a trade.
Forex swing trading indicators can predict when a reversal will occur. Instead, they identify conditions like a weakening momentum, divergence between price and oscillator, or loss of strength near support or resistance. It is advised to wait for confirmation or price action.
The forex market uses tick volume which helps to assess the trading activity. For instance, a price breakout with high tick volume can suggest a strong interest. These volumes can serve as reliable proxy for market activity and participation.
No, the forex swing trading indicators cannot give you information like entry, exit, stop-loss, position-size, or costs. Use indicators as a broader part of your trade process.

Ready to apply disciplined risk to crypto? Explore Audacity Capital's new crypto instruments and bring your trading strategy.
Learn MoreNewsletter
Join our newsletter to stay up to date on features and releases.
Join Our Social & Community

Start Your Journey Today With Our Free Trial
Proudly showcase your skills and accomplishments through certificates and get recognition for your hard work and dedication from potential investors and peers.
Free TrialRelated Articles

Forex Swing Trading Signals : Complete Guide (With Examples, Strategies & Risk Management)
Learn how forex swing trading signals work, including entry, stop-loss, and take-profit. Discover strategies, indicators, and risk management to trade signals effectively.


Forex Swing Trading: Complete Beginner to Advanced Guide (2026)
Learn how forex swing trading works, including timeframes, market trends, risk management, trade execution, and swing trading examples.