



MACD Trading Strategy: How to Read Signals and Trade Momentum


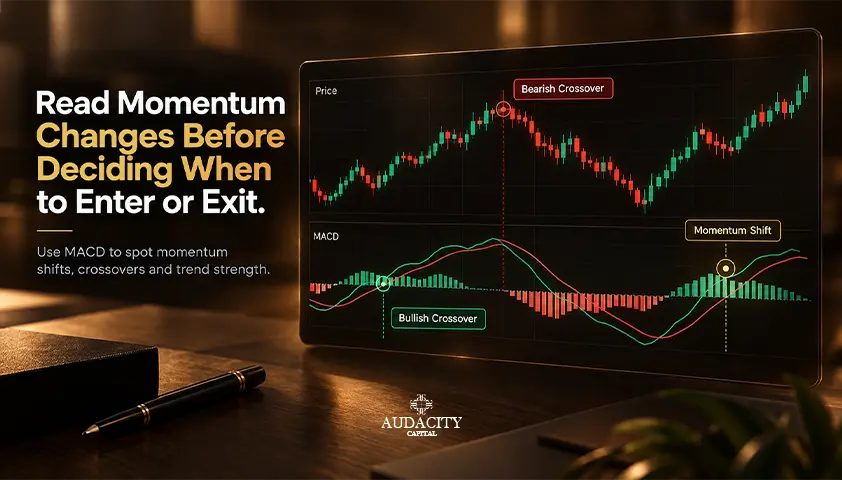
The MACD is one of the simplest indicators to place on a chart and one of the most misunderstood signals. You get a crossover. You get a change in the color of the histogram bar. You get a divergence pattern.
The urge is to immediately make a trade on any of these occurrences. And that is where the majority of traders make mistakes. A signal is information but not a decision.
Here’s a detailed guide to how the MACD works, the true meaning of all its signals, their limitations, and how to create a full-fledged MACD trading strategy based on market conditions.
The objective is not to cut corners but to be trustworthy in your interpretation.
Key Takeaways
- MACD incorporates both trend direction and momentum into one single indicator based on two exponential moving averages and a signal line.
- The standard 12-26-9 is a typical setting and does not guarantee the best setting.
- Crossovers should be interpreted within the market context; a bullish crossover in an upward trend means something else than the same crossover occurring within a downward trend.
- Divergence implies that there is a difference between price and momentum, but it is not indicative of a reversal.
- MACD is lagging by nature because all values are calculated using historical prices.
- Range-bound markets lead to more whipsaw and false crossovers.
- Risk management lies with price structure and position size.
What Is the MACD Indicator?
Moving Average Convergence Divergence (MACD) is a technical indicator that evaluates the relationship between two moving averages of price.
It takes a fast EMA and a slow EMA of that and smooths the difference between them with a signal line to make momentum changes more visible. In a nutshell, the MACD indicator allows you to read three things simultaneously.
The direction of the trend, the momentum behind the trend and the changes in momentum as they evolve. That's the reason many traders continue to monitor it on their forex, indices, and commodity charts.
There is one feature that makes the indicator differ from other momentum oscillators such as RSI and Stochastic.
MACD is unbounded. It does not have a fixed ceiling or floor and does not have any pre-determined overbought or oversold levels. The values may continue to rise or fall, but only if the moving averages that support them continue to diverge.
What Does MACD Measure?
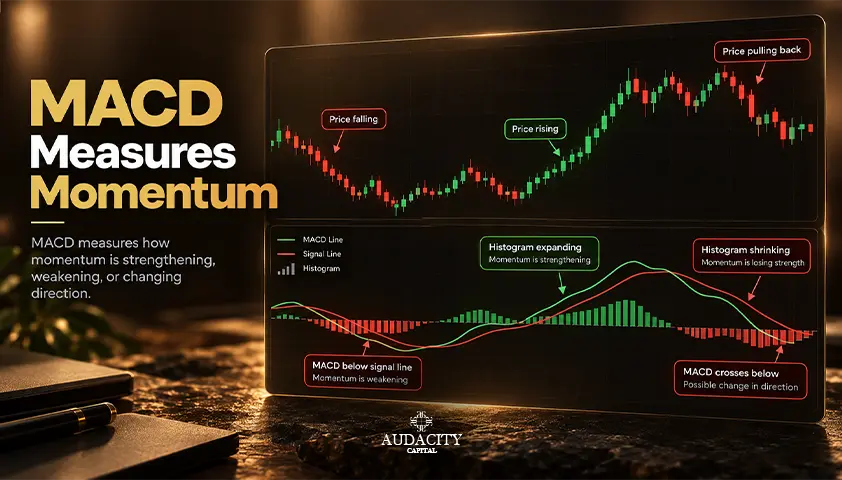
The MACD reflects the convergence and divergence of the two EMAs. Whenever the faster EMA moves away from the slower one, the gap increases. This indicates that momentum is increasing. When both EMAs are returning towards each other, the momentum is fading.
A positive value of MACD indicates that fast EMA is higher than the slow EMA. In contrast, a negative value of MACD indicates that fast EMA is below the slow EMA.
Is MACD a Trend or Momentum Indicator?
This is a bit confusing as MACD is both. It is a trend-following indicator because it is entirely made up of moving averages. However, the rate of change of the difference in EMA spreads gives information about momentum.
This is the reason why MACD is often referred to as a trend-following momentum oscillator. It tells you the direction price is heading in, and the strength of that movement.
Is MACD a Leading or Lagging Indicator?
The MACD is basically a lagging indicator. All of its values are based on historical prices calculated using exponential moving averages and are not indicative of what is to come.
A crossover typically signals the end of a momentum change once a price movement has begun. One of the most common trading errors is to interpret MACD as a predictive indicator.
Why MACD Is Primarily Lagging
The lag time is due to a simple chain of events. Price changes first. The EMAs then respond to this change with a smoothing lag time.
The difference between the two EMAs is then plotted on the MACD line. Next, the signal line smooths the MACD line. Only after that does a crossover come into sight.
Each step adds a little time. If the market is moving fast, then all those lags together can make you miss the most profitable entry point.
Can the Histogram or Divergence Give Earlier Clues?
Yes, but not always. In some cases, histogram compression or a development of a divergence can precede an entire signal-line or zero-line crossover.
They are early signs of momentum change, but are not necessarily leading signals as price can continue trending even as the divergence remains in play over several swings.
When Lag Is Useful
Lag is not inherently a weakness, confirmation helps avoid reacting to every minor deviation, hence eliminating much noise. This trade-off is evident: speed vs. confirmation.
The faster signals will allow one to catch an early move, but will increase false indications; confirmation, on the other hand, takes longer time, yet it provides stronger evidence.


Audacity Capital Empowering Traders Since 2012
Join the Top Prop FirmUnderstanding the MACD Line, Signal Line, Histogram and Zero Line
Reading a live chart involves understanding every part of the chart individually before putting them together. Each element represents what it means and how to interpret it.
MACD Line
The MACD line is the difference between the 12-period EMA and the 26-period EMA. A positive value indicates that the short-term momentum is moving upwards.
A negative value indicates otherwise. A value close to zero indicates that the two EMAs are very close together, which may occur during an intermediate range. The MACD value is not universally quantifiable for all assets.
MACD is quantified using the price value and does not have any upper or lower boundary. A MACD value of +3 will mean differently for gold than a currency pair.
Signal Line
The signal line is a 9-period EMA of the MACD line. This is used as a smoothing tool to help in comparing the MACD momentum with its own average in the recent period.
If there is divergence between the two lines, the momentum is accelerating. However, if there is convergence between the two lines, momentum is slowing down.
MACD Histogram
MACD histogram is the difference between MACD line and the signal line, represented as bars around zero. The higher the bars are, the wider the difference between these two lines and, thus, the stronger momentum.
Reducing bars indicate a convergence of two lines. It is important to understand that the contraction of the histogram means changes in momentum, not necessarily a reversal of the price.
Zero Line or Centerline
The zero level is the point where the fast and the slow EMAs are equal to each other. If the MACD line is above the zero line, the fast EMA is higher than the slow EMA and this points to a bullish trend.
If the MACD line is below the zero line, the situation is vice versa. The zero line provides you with general trend information instantly. This is why it works well as a directional filter inside a larger strategy.
How Is the MACD Indicator Calculated?
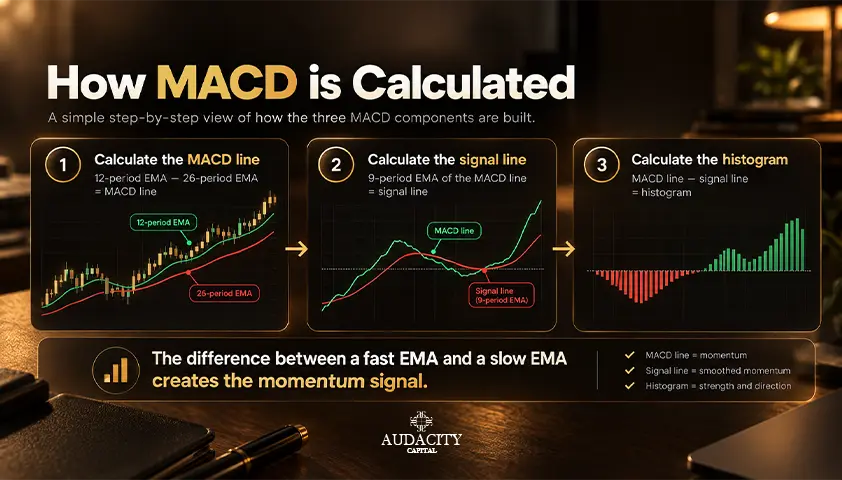
Comprehending the maths behind the MACD indicator allows one to understand all its signals. It consists of three equations, with each one based on the previous one.
- MACD Line = 12-period EMA − 26-period EMA
- Signal Line = 9-period EMA of the MACD line
- Histogram = MACD Line − Signal Line
Simply put, the first step is to calculate the difference between a quick and a slow moving average. Then, you smooth this difference by taking its 9-period average to create the signal line. .
The histogram only displays how far apart these two lines are from each other.
Why MACD Uses Exponential Moving Averages
There is one particular aspect why MACD employs an exponential moving average and not the simple one. EMA puts more emphasis on current prices; thus, the indicator is more sensitive while smoothing out all sorts of noise at the same time.
Such sensitivity makes the indicator detect momentum changes without being responsive to every tick.
What Do 12, 26 and 9 Mean?
They correspond to the formula directly: 12 is the fast EMA period, 26 is the slow EMA period and 9 is the smoothing period used to calculate the MACD line into the signal line.
These are the default numbers for calculation, not some kind of universal optimal values. This is just the first step in your testing.
Small Calculation Example
Let’s assume that the 12 timeframe EMA is equal to 105 and the 26 timeframe EMA is equal to 102. In such a case, the MACD line will be 105 – 102, which is equal to +3.
This is an indication that the fast average is higher than the slow one, therefore the momentum is up.
You do not have to make all these calculations manually in real-time trading, but at least you should understand where the number is coming from.
How to Read MACD Signal-Line Crossovers
Signal-line crossovers are the most used trading signals based on MACD and also the ones frequently misused. The trick is in proper understanding of context.
Bullish MACD Crossover
In case of a bullish crossover, the MACD line crosses above the signal line. In other words, it shows that the short-term momentum got stronger in comparison to its average in recent periods. That sounds like a buy, but location is important.
An bullish crossover that occurs near or above the zero line will be significant in case of a market trend that is already upwards. But the same crossover that happens way down below zero, in a downtrend, would only imply a temporary rise.
Bearish MACD Crossover
A bearish crossover is simply the opposite. The MACD dips below the signal line, signaling that the bullish momentum is losing steam or bearish momentum is building. Once again, the trend context will determine the signal.
A bearish crossover within a downtrend is confirming the price action, whereas the same type of signal within a strong uptrend may be just an indication of a retracement.
Why Crossovers Whipsaw in Ranges
When the price fluctuates sideways, the fast and slow EMA lines become very close and continue to oscillate, creating a series of signal-line crossovers without much follow-through. Such repetitive crossover is referred to as whipsaw.
Fidelity has always warned that MACD crossovers tend to whipsaw in trading ranges and such warnings are well founded. In choppy conditions, crossovers generate far more noise than opportunity.
What Does a MACD Zero-Line Crossover Mean?
The zero line is a lagging but wider indicator of the direction of the trend compared to the signal line.
Bullish Zero-Line Crossover
The bullish MACD zero line crossover occurs when the MACD line crosses above the zero line, and this occurs as the fast EMA moves above the slow EMA.
This is not necessarily an early signal but rather a confirmation of the trend since by the time it triggers, the change in the underlying EMA relationship has already occurred.
Bearish Zero-Line Crossover
The bearish zero-line crossover is just the opposite of the bullish one, with the MACD crossing below the zero line as the fast EMA moves below the slow EMA.
This shows bearish structure, although not as quickly as the signal-line crossover since it has to wait for a change to occur in the EMA relationship.
Signal-Line vs Zero-Line Crossover
The two are different in terms of speed and accuracy.
Signal-line crossovers act faster; hence they are more prompt but also more noisy. Zero-line crossovers take time, but they represent real change in the fast and slow EMAs, hence carrying more trend information.
Traders often use zero lines as direction filters and signal lines as timing mechanisms.
What Do Rapid Rises and Falls in MACD Mean?
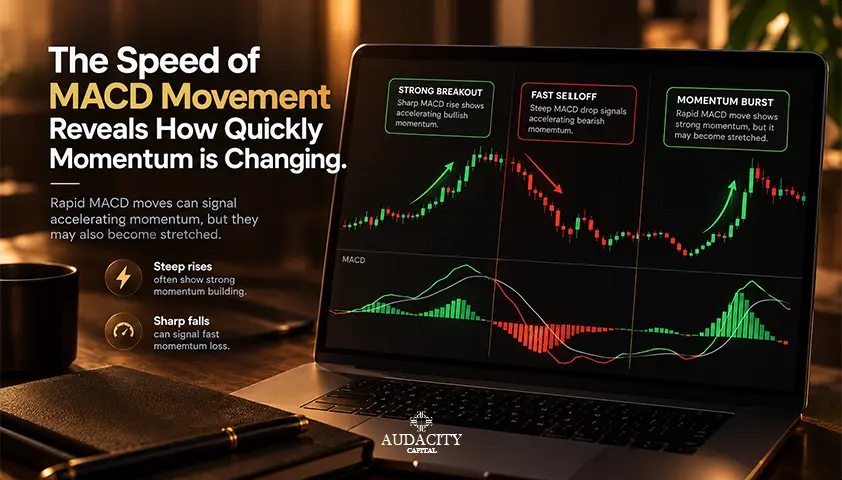
A fast move in either direction indicates a swift increase in divergence between MACD and the signal line, accompanied by fast growing histogram bars.
This suggests extremely high levels of momentum acceleration. As MACD lacks upper or lower limits, avoid the temptation to interpret a fast upward move as overbought and a fast downward move as oversold. The indicator can keep stretching.
Rapid Rise in MACD
On the positive side, a fast move means that MACD line jumps above the signal line, and the histogram bars shoot up from zero.
This shows a high level of bullish momentum acceleration.
The situation admits two plausible explanations. This may be either the beginning or continuation of a strong trend, or it may simply be an increasingly stretched short-term move.
Before assuming a reversal, check price structure and volatility. Rapid rises and falls in MACD describe momentum speed. They do not establish a ceiling or floor.
Rapid Fall in MACD
Rapid decline is the opposite scenario. MACD falls fast below its signal line, negative histogram bars expand, and bearish momentum builds up.
Here the error lies in trading on MACD being "too low." There is no floor; quick decline may stretch way beyond what appears extreme.
Why Extreme Momentum Can Persist
Powerful trends will keep the MACD difference at a wide level much longer than anyone imagines. That is precisely the reason why mean-reversion trades from MACD distance are so dangerous.
MACD divergence is a measure of momentum, not a timing indicator.
MACD Divergence: Bullish and Bearish Signals Explained
MACD divergence refers to the discrepancy between the price structure and MACD momentum indicator readings. When the price and MACD momentum act in opposition to each other, then their alignment has been violated.
This is crucial to know since divergence marks a lack of momentum alignment, not reversal. Numerous traders incur losses by considering divergence as a reversal signal.
Bullish MACD Divergence
Bullish MACD divergence forms in stages:
- Price creates a lower low.
- MACD registers a higher low at the comparable swing points.
- The second price low signals the continuation to the downside, while the higher MACD low signals a weakening of the downward momentum.
What you should be looking for now is confirmation in the form of a bullish candle structure change, a breach of a nearby resistance level, MACD crossover or rebound in the histogram. Divergence creates the hypothesis, while confirmation makes the trade.
Invalidation would occur when the price continues to make new lows and MACD breaks lower as well, thereby breaking the concept of divergence. If there is no price confirmation as expected, then no divergence trade exists.
Take, for instance, a downtrend approaching a previous support area. In this case, the price forms a marginal lower low, while MACD forms a distinct higher low.
This divergence will become relevant only when the price breaks out of a lower high or resistance level. Until then, it is a warning, not a signal.
Bearish MACD Divergence
Bearish MACD divergence occurs in opposite way:
- Prices form a higher high.
- MACD forms a lower high through comparable swing points.
- The second price high indicates that the price action continues to rise, but the lower MACD high indicates that the upside momentum is losing its strength.
The confirmation in this case involves bearish price structure, price rejection from the resistance level, MACD bearish crossover or histogram rollover.
Imagine an uptrend attempting to break out of the resistance zone. Price posts a higher high while MACD posts a lower high. Trading on the signal alone without price confirmation is a bad strategy since strong trends usually extend.
Price confirmation is useful because it helps prevent early entry. The way to invalidate the divergence is simple. Price advances further, while the MACD momentum reverses and heads higher.
Regular vs Hidden Divergence
There are two broad categories. Regular divergence is the form defined above, commonly seen as reversal indications.
Hidden divergence is the opposite and is used as a trend-continuation indicator, with the price making a higher low while MACD makes a lower low within an uptrend.
Take note of this difference, without overloading yourself trying to consider all variants.
Why MACD Divergence Can Fail
Divergence fails more frequently than most novices would imagine. Trends can be so powerful that divergence occurs time and again prior to any reversal taking place. Mismatches in swing points can make divergences appear where none exist.
A divergence can disappear entirely as new bars print. Low-liquidity or high-volatility moves can distort the readings.
This is always the case in all the above scenarios. Divergence requires price confirmation before it can be relied upon.
4 MACD Trading Strategies Traders Can Test
A MACD trading strategy isn’t one signal but rather a full system including market condition, trend filter, trigger, confirmation, and invalidation.
The following four strategies are examples of how you can construct a MACD indicator trading strategy. Treat every example as educational and hypothetical and not a recommendation.
Strategy 1: Trend-Pullback MACD Crossover
First, establish the trend on the higher timeframe. Then wait for the price to pull back in the existing trend and watch for the MACD to make a move in line with the trend via signal-line crossover.
Require price structure confirmation, such as a swing continuation, before entering. Place invalidation below the pullback swing in an uptrend, or above it in a downtrend.
This MACD crossover strategy is much more selective compared to simply trading crossovers since it is only used when the MACD confirms the dominant trend.
Strategy 2: Zero-Line Trend Continuation
Consider the use of the MACD position above or below the zero line as the directional filter. In case of an uptrend with the MACD above the zero line, go long when the indicator pulls back towards the zero line during the retracement and then moves along with the trend.
The difference here is the timing because, unlike in Strategy 1 where the trade is made on the first signal of the zero-line cross, here the trade is made after momentum resets itself within the trend.
Strategy 3: MACD Divergence at Support or Resistance
This is the combination of a bullish divergence around the support level and bearish divergence around the resistance level. The position of the divergence is what matters. There should be some sort of structure breakdown or rejection before you enter.
If price continues trending and invalidates the support or resistance level, then the setup does not work.
Strategy 4: Histogram Momentum Confirmation
The increasing histogram bars indicate that there is momentum for a move, while decreasing bars signal weak momentum for the move.
One thing to remember is that a histogram color change alone should not be used as a trigger. The price confirmation needs to come along with it so you know that you are trading based on actual momentum.
How to Use MACD Across Multiple Timeframes
Learning how to use the MACD indicator across more than one timeframe sharpens both your bias and your timing.
Higher Timeframe for Market Direction
Use one higher timeframe for establishing your bias and structure. The daily or H4 timeframe will help you get an overview of the trend so your decisions on the lower-timeframe have some kind of context to work in.
Lower Timeframe for Timing
Switch to a shorter timeframe to look for a MACD crossover which fits into your bias on the longer timeframe. For example, if your H4 bias is bullish, you may wait for an H1 crossover following a retracement. The longer timeframe indicates where, the shorter timeframe indicates when.
What to Do When Timeframes Conflict
If the two timeframes contradict each other, don’t force a trade. The lower-timeframe momentum works against the higher-timeframe trend during normal pullbacks, and this contradiction gives you information, not an entry.
Plan in advance whether your trading approach follows the higher-timeframe trend or makes counter-trend entries, and be consistent about it.
What Are the Best MACD Settings?
There’s no one right answer, but knowing how to use them will help you make a choice.
Standard 12-26-9 Settings
There is a good reason why the 12-26-9 parameter setting is the standard. It provides a fairly good balance between responsiveness and smoothing, so it can be used as a baseline. Take it as a standard in order to test other settings.
Faster MACD Settings
Shortening periods will lead to faster reaction and faster signals, however, the price will be more noise and a higher whipsaw risk.
Faster MACD parameters may be suitable for lower timeframes or more aggressive trading style, however, beware of applying some fast settings universally. What helps one market can hurt another.
Slower MACD Settings
Longer periods smooth the indicator, reduce how often signals fire, and increase lag. These settings filter out more noise, which some trend traders prefer, at the expense of later entries and exits.
Test Settings by Market and Timeframe
Proper testing should be done regarding your specific market and timeframe in order to find proper MACD settings. Backtest first, then analyze the results using out-of-sample data.
Analyze performance in terms of signal quality, drawdown, trading expenses, and stability of the settings throughout various periods. Be cautious with over-optimization and trying to fit the historical data.
Curve-fitted parameters rarely perform as well in live markets.
When Does a MACD Trading Strategy Work Best?
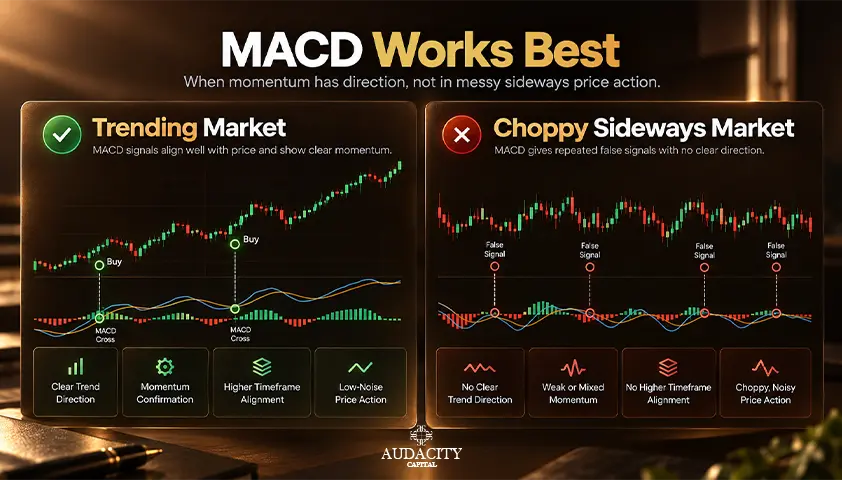
MACD is not always equally effective in any scenario. Applying it to the right market environment differentiates disciplined use from random use.
Trending Markets
With trending prices, moving-average relationships used in MACD become obvious.
Crossovers, zero-line dynamics, and histogram widening are meaningful in a trend environment, since there is a dominant direction for them to agree or disagree with.
Sideways and Choppy Markets
In the range, fast and slow EMAs often converge and cross each other. This produces signal-line whipsaws and false triggers. Fidelity's caution concerning trading-range whipsaws applies to the case directly.
MACD signals become less actionable in such an environment, as overtrading is very probable.
High-Volatility Event Risk
Price gaps or spikes, usually caused by some news events, can trigger a rapid increase in MACD after the price movement has occurred.
Being aware of upcoming news and other high-impact events will help you avoid following a lagging MACD signal.
Limitations of the MACD Indicator
It is important to know what your instrument is incapable of doing if you want to become a serious trader. Here is a list of MACD’s limitations you should consider if you are going to trade using MACD.
MACD Is Lagging
As MACD is derived using moving averages, it provides lagging signals after the price has already moved. That is why during rapid changes in trend direction you will find yourself entering into the position too late or leaving the trade too early.
MACD Can Whipsaw in Sideways Markets
Multiple crossovers without any follow-through on price movement are common in range markets. Every false crossover is a temptation to enter a trade, and the multiple small losses from whipsaws can add up very fast.
Overtrading in this situation is one of the quickest ways to lose money on the account.
Divergence Does Not Guarantee Reversal
Sometimes, divergence will continue for many swings before the price changes its direction, if it changes at all. Entering a trade against a trend using only divergence signals is one of the costliest mistakes in technical analysis.
MACD Has No Fixed Overbought or Oversold Levels
Unlike most bounded oscillators, MACD does not have a maximum and minimum value. This is directly relevant to rapid rises and falls interpretation.
Even when the value seems to go off the charts, this does not mean that we are seeing a reversal level as there is no built-in boundary to lean on.
Results Depend on Settings and Timeframe
A market can yield totally different signals using MACD on a five-minute chart compared to an H4 chart. Changing the parameters alters the crossover frequency and lag as well. The result will be just as relevant as the context and parameters used.
MACD Does Not Measure Volatility or Trade Risk
MACD does not tell you how much position size to take, how far the market is likely to go, or where the stop should be placed. It is a momentum and trend indicator, that's all.
You need to use it alongside the price structure and when necessary, volatility and risk management indicators.
MACD Can Confirm the Move After the Best Price Has Gone
Sometimes, confirmation occurs after most of the move has taken place already. This is the central trade-off in using any lagging indicator. You may wait for confirmation and enter late, or enter early but with more uncertainty.
None of these options is without costs, and knowing what you are doing prevents false expectations.
Risk Management and Common MACD Trading Mistakes
Even a well-read signal fails without execution discipline. These are the mistakes that quietly undermine traders using MACD.
Trading Every Crossover
Trading on all signal-line crossovers will inevitably result in overtrading, more so when there are range trades with whipsaws occurring all the time. It is selectivity rather than frequency that makes trading safe for your capital.
Entering on Divergence Without Price Confirmation
Momentum disagreement is a factor one should consider, but not a reason to trade. When there is no confirmation with structure break or rejection, then you do not trade a setup, but a warning.
Chasing a Late MACD Signal
A technically valid signal can still offer poor trade location after a large move. Even if the signal may appear clean, the risk-to-reward may not be worth the trade if the best price has already been achieved.
Constantly Changing Settings
Changing parameters for each losing trade is curve-fitting and not strategy. It disrupts consistency and gives you results that only apply to the past.
Choose a configuration that has already been tested and see how it performs in a sufficient number of trades to have any meaning.
Letting MACD Decide the Stop Loss
Your stop should be placed at the point where the trade idea is wrong in price, not just where the MACD crosses back.
Set the trade invalidation, price structure, and account risk per trade rules with tie stops, and a single indicator cross will not determine how much you lose.
Ignoring Position Size and Drawdown Limits
MACD is an indicator, not a risk managing system. However, there is still a risk limitation for a particular trade, a proper stop level, and account limitations that prevent the size of drawdowns from reaching a large level.
The indicator is used to identify momentum, and risk management tools are needed to protect an account.
Conclusion
MACD is a tool worth considering on a chart if one knows what each component stands for and uses MACD signals combined with the context of markets, price confirmation, invalidation, and risk management.
MACD is mostly a lagging instrument. Even though the histogram values and divergence may give some warning signals, none of them guarantees the reversal. No single signal is enough to make a trade decision.
Trade using MACD cautiously and confirm everything using the price action, and manage all trades considering the risks. That way, you will make your tool more helpful and will stop considering every move as a trading opportunity.
Frequently Asked Questions
A MACD trading strategy utilizes the trend and momentum indicators provided by the MACD to generate trade opportunities. It integrates these signals along with the market setting, entry and exit criteria.
You can use the MACD line and signal line to determine the momentum, the histogram to monitor the difference between them and the zero line for trend setting. Apply these readings within a defined strategy rather than trading signals in isolation.
MACD is primarily a lagging indicator because it is calculated from historical prices. Histogram contraction and divergence may offer earlier clues to momentum changes, but they do not reliably predict reversals.
Rapid rises or falls indicate a sharp change in momentum, often accompanied by an expanding histogram. Since MACD has no fixed upper or lower limit, an extreme reading alone does not signal a reversal.
Bullish MACD divergence occurs when price makes a lower low while MACD makes a higher low. It suggests weakening downside momentum and may signal a potential reversal.
Bearish MACD divergence arises when prices form a higher high and the MACD forms a lower high. It points to weakening upside momentum and may signal a potential reversal.
The 12-26-9 is the default baseline and a solid reference point. There is no perfect MACD setting. Experiment with different settings for your specific market and timeframe, study out-of-sample performance, and do not over-optimize MACD so that it will work on historical data only.
Not really. The fast and slow EMAs move closer in a range environment and cross each other many times, resulting in whipsaw and fake crossovers. MACD signals are more effective when markets trend in a certain direction and can confirm their direction.
No, not necessarily. There isn’t a single better indicator between the two because they have different roles and solve different problems.

暗号資産に規律あるリスクを適用する準備はできていますか?Audacity Capitalの新しい暗号資産商品を探索し、あなたの取引戦略を持ち込んでください。
詳細を見るニュースレター
ニュースレターに登録して最新情報を入手。
ソーシャルコミュニティに参加

関連記事

Swap in Trading: What It Is, How It Is Calculated and How It Affects Your Positions
Learn what a swap in trading is, how overnight fees are calculated, when triple swaps apply, and how swap costs affect forex and CFD positions.


NQ in Trading – What is NQ in Trading?
Learn what NQ means in trading, how E-mini Nasdaq-100 futures work, their contract specifications, trading hours, strategies and risks.

Bearish RSI Divergence: How to Spot It, Confirm It and Trade It
Learn how to identify bearish RSI divergence, confirm reversal signals, plan entries and exits, and manage risk with practical forex trading examples.

What Is the Slow Stochastic Oscillator? Formula, Signals and Strategies
Learn how the Slow Stochastic Oscillator works, understand its formula and signals, and explore trading strategies and risk management.