Best Indicators for Scalping: 7 Tools Every Trader Should Know


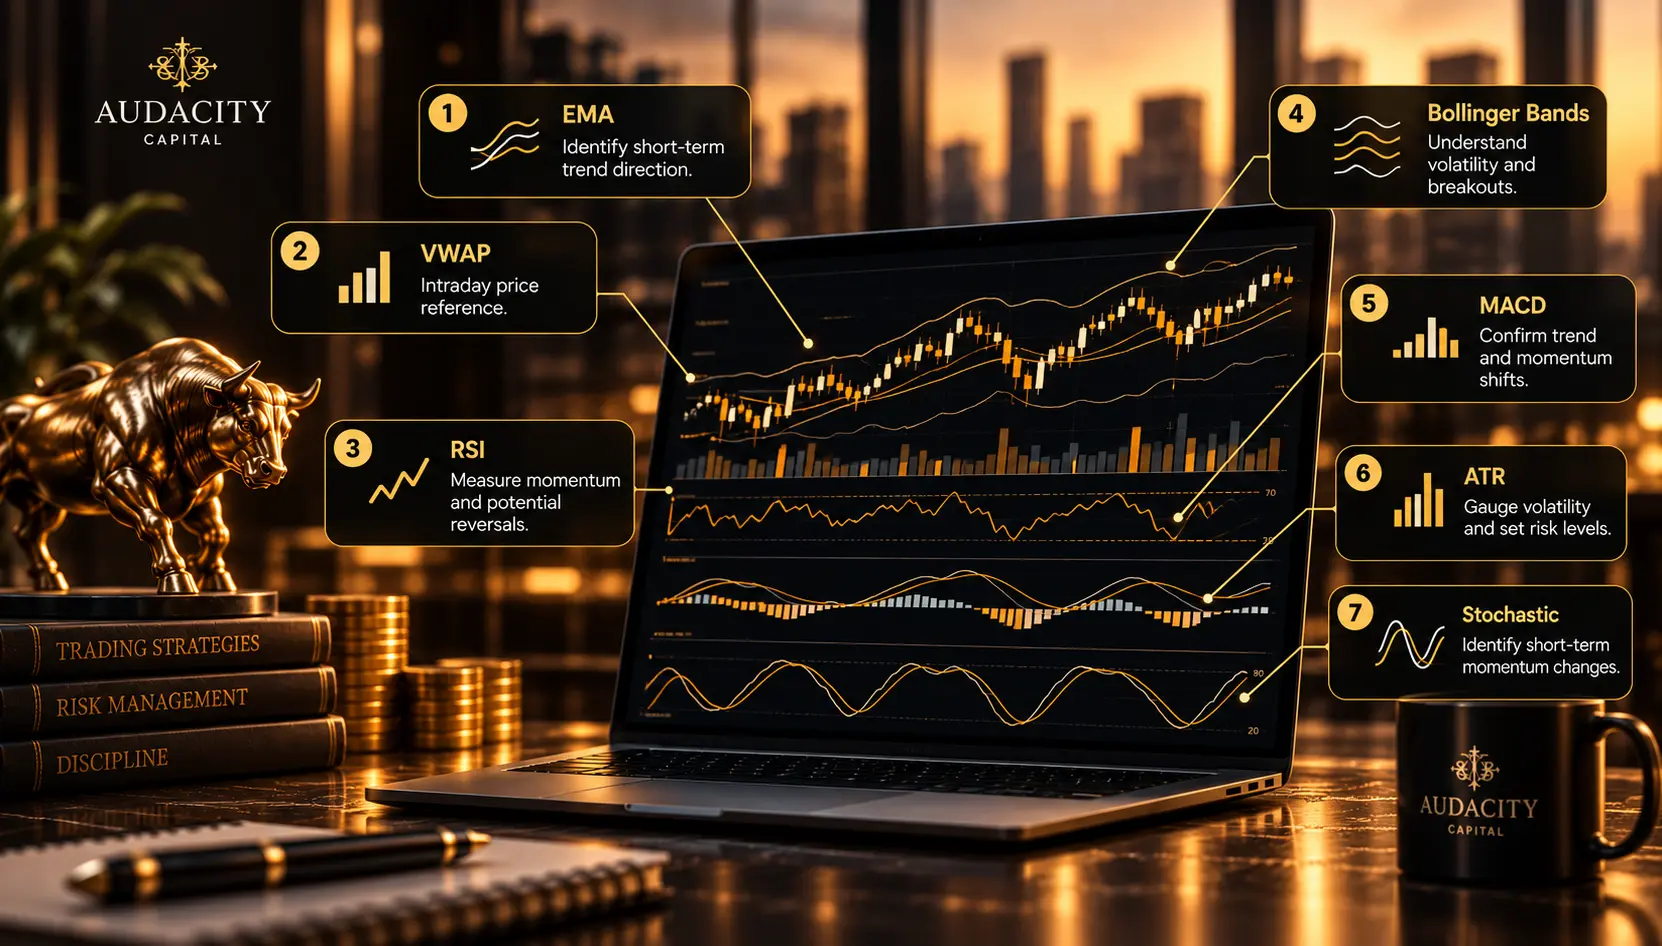
Scalping is a short-term trading approach that aims to capture relatively small price movements over short periods. Because trades can develop quickly, scalpers often use technical indicators to identify trend direction, momentum, volatility, liquidity and potential entry or exit areas.
There is no single indicator that works best for every scalping strategy. The most useful setup depends on the market, timeframe, trading style and risk-management approach.
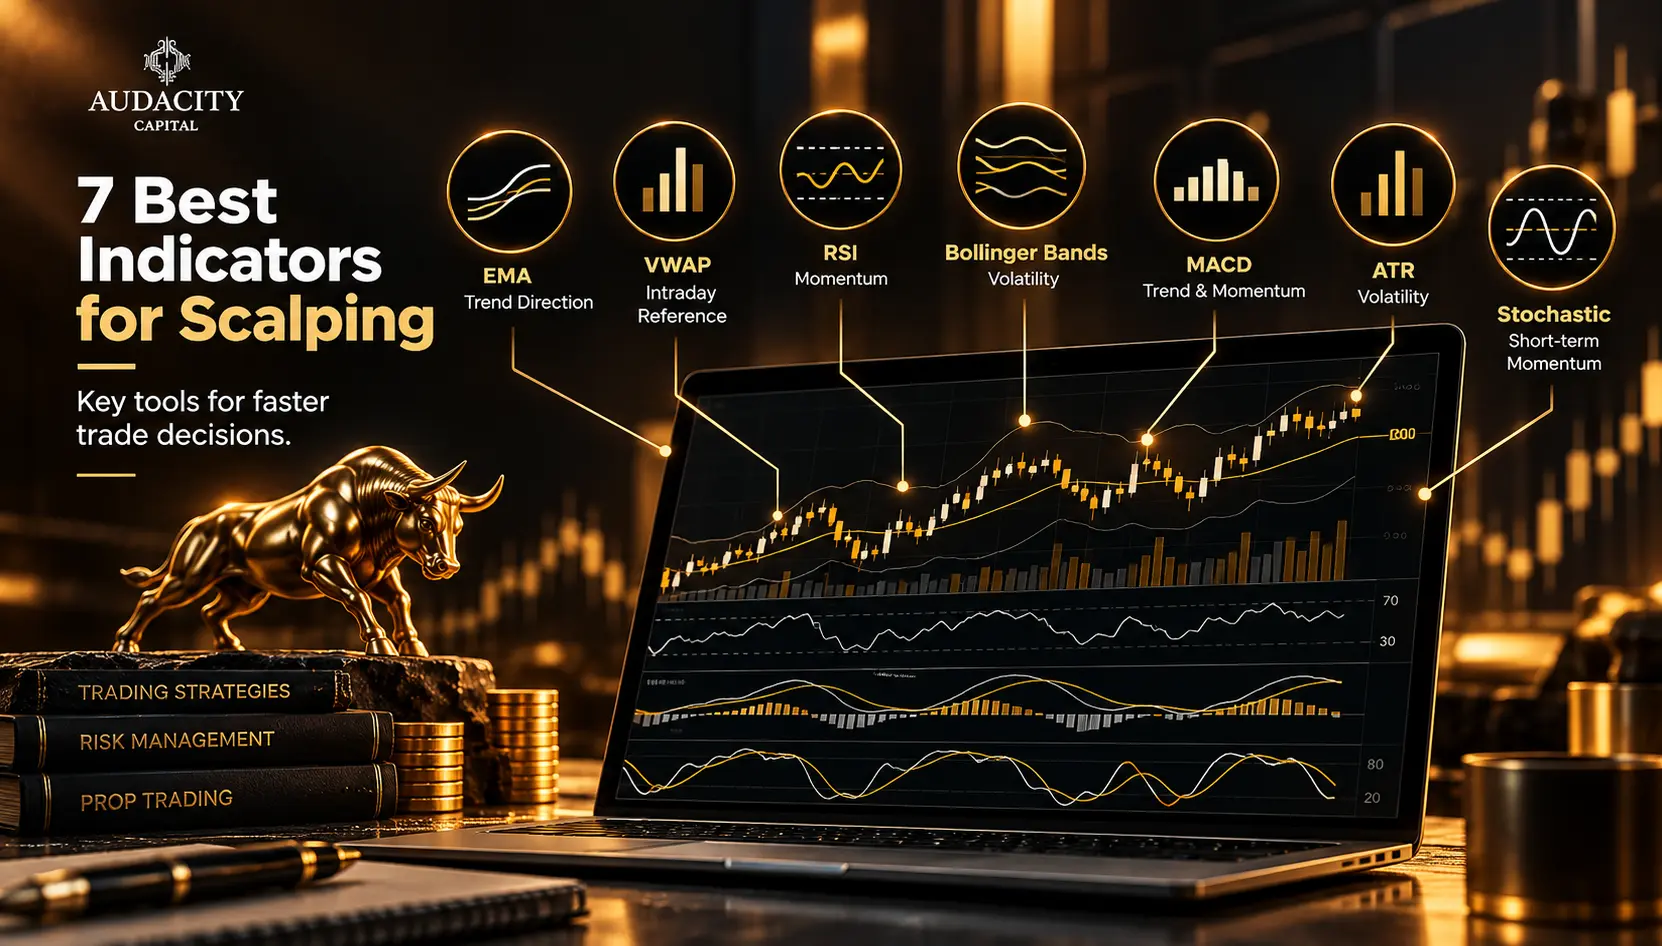
Some of the most commonly used indicators for scalping include the Exponential Moving Average (EMA), Volume Weighted Average Price (VWAP), Relative Strength Index (RSI), Bollinger Bands, Moving Average Convergence Divergence (MACD), Average True Range (ATR), and Stochastic Oscillator.
The key is not to put as many indicators as possible on a chart. Instead, traders can combine a small number of indicators that provide different types of information.
What Are the Best Indicators for Scalping?
The most useful indicators for scalping can be grouped according to the information they provide:
Indicator | Main Purpose | Common Use in Scalping |
|---|---|---|
EMA | Trend direction | Identify short-term trends |
VWAP | Price relative to volume-weighted average | Identify intraday bias and reference levels |
RSI | Momentum | Identify momentum and potential exhaustion |
Bollinger Bands | Volatility | Identify expansion and contraction |
MACD | Trend and momentum | Confirm momentum shifts |
ATR | Volatility | Help assess market movement and risk |
Stochastic Oscillator | Momentum | Identify short-term momentum changes |
Rather than relying on one indicator, many traders use a combination to confirm whether a setup meets their trading criteria.
7 Best Indicators for Scalping
1. Exponential Moving Average (EMA)
The Exponential Moving Average, or EMA, gives greater weight to recent prices than a simple moving average. This makes it useful for identifying short-term changes in price direction.
For scalping, traders commonly use shorter-period EMAs to monitor short-term trends.
For example, a trader might place a 9-period EMA and 21-period EMA on a chart.
How scalpers use EMA
A common approach is to look at the relationship between two EMAs:
- Shorter EMA above longer EMA → short-term bullish momentum
- Shorter EMA below longer EMA → short-term bearish momentum
- Price repeatedly crossing the EMA → potentially choppy conditions
A trader may also use an EMA as a dynamic reference level during a trend.
Example
Suppose EUR/USD is trading above both the 9 EMA and 21 EMA, while the shorter EMA remains above the longer EMA.
A trader could interpret this as evidence of short-term upward momentum. However, the EMA alone does not confirm that a trade should be opened.
Other factors such as market structure, volatility and risk should also be considered.
Best use
Trend identification and trend confirmation.
2. Volume Weighted Average Price (VWAP)
VWAP stands for Volume Weighted Average Price. It calculates the average price traded during a session while weighting prices according to volume.
VWAP is particularly useful for intraday traders because it provides a reference for where trading has occurred relative to the session's volume-weighted average price.
How scalpers use VWAP
Traders may look at whether price is:
- Above VWAP
- Below VWAP
- Moving back toward VWAP
- Breaking away from VWAP with increasing momentum
For example, if price remains above VWAP during an intraday uptrend, some traders may use VWAP as a reference for bullish market structure.
If price repeatedly crosses VWAP, the market may be less directional.
Important limitation
VWAP is generally more useful for intraday markets with meaningful volume data. The way volume is reported can vary between markets and platforms.
For spot forex, for example, traders may be working with tick volume rather than centralized exchange volume.
Best use
Intraday bias and price reference.
3. Relative Strength Index (RSI)
The Relative Strength Index (RSI) is a momentum oscillator that measures the speed and magnitude of recent price movements.
It moves between 0 and 100.
Traditionally:
- RSI above 70 → potentially overbought
- RSI below 30 → potentially oversold
However, scalpers should avoid treating these levels as automatic buy or sell signals.
How RSI can help scalpers
RSI can be used to:
- Assess momentum
- Identify potential momentum shifts
- Compare price movement with momentum
- Identify potential divergence
- Confirm a broader trend
For example, in a strong uptrend, RSI can remain above 50 for extended periods. A reading above 70 does not necessarily mean price must immediately reverse.
RSI divergence
Divergence occurs when price and the indicator move in different directions.
For example:
Price makes a higher high while RSI makes a lower high.
Some traders interpret this as a possible sign that momentum is weakening.
However, divergence can persist before price reverses, so it should be treated as a confirmation tool rather than a standalone signal.
Best use
Momentum analysis and potential momentum exhaustion.
4. Bollinger Bands
Bollinger Bands consist of a moving average with upper and lower bands positioned according to market volatility.
They can help scalpers understand whether volatility is expanding or contracting.
The three components
A standard Bollinger Band setup includes:
- Middle band
- Upper band
- Lower band
When volatility increases, the bands generally widen.
When volatility decreases, the bands generally contract.
Bollinger Band squeeze
A period of narrowing bands is often called a Bollinger Band squeeze.
The idea is that a period of reduced volatility may eventually be followed by increased price movement.
However, the bands themselves do not indicate which direction a breakout will take.
How scalpers use Bollinger Bands
They may use them to:
- Identify volatility contraction
- Monitor volatility expansion
- Assess whether price is moving unusually far from its recent average
- Combine volatility information with trend or momentum indicators
Best use
Volatility analysis and identifying potential expansion.
5. MACD
The Moving Average Convergence Divergence (MACD) indicator combines moving averages to help traders assess trend and momentum.
The standard MACD consists of:
- MACD line
- Signal line
- Histogram
How scalpers use MACD
Traders may monitor:
- MACD/signal-line crossovers
- Histogram expansion or contraction
- Momentum shifts
- Divergence
- Relationship to the zero line
A bullish crossover can indicate increasing upward momentum, while a bearish crossover can indicate increasing downward momentum.
However, MACD is derived from moving averages, which means it can react more slowly than some other momentum tools.
For very fast scalping strategies, this is an important consideration.
Best use
Momentum and trend confirmation.
6. Average True Range (ATR)
The Average True Range (ATR) measures market volatility.
Unlike RSI or MACD, ATR does not tell traders whether price is likely to move up or down.
Instead, it helps answer:
How much is this market typically moving?
This makes ATR particularly useful for scalpers because short-term markets can change significantly in volatility throughout a trading session.
How scalpers use ATR
ATR can help traders:
- Assess current volatility
- Set realistic stop-loss distances
- Avoid trading when expected movement is too small
- Adjust position size according to volatility
- Compare volatility between markets
For example, if ATR is unusually low, a trader may find that there is not enough movement to justify a particular short-term strategy.
Best use
Volatility assessment and risk management.
7. Stochastic Oscillator
The Stochastic Oscillator compares a security's closing price with its recent price range.
It is commonly used to identify momentum changes and potential overbought or oversold conditions.
Traditional interpretations often use:
- Above 80 → overbought
- Below 20 → oversold
Again, these levels should not automatically be interpreted as reversal signals.
How scalpers use Stochastic
It can help identify:
- Short-term momentum shifts
- Potential pullbacks
- Momentum divergence
- Conditions within a defined trading range
Stochastic can be particularly useful when a market is moving sideways, although its signals can become less reliable during strong trends.
Best use
Short-term momentum and range-bound markets.
Which Indicators Work Well Together for Scalping?
Using seven indicators simultaneously isn't necessary.
A better approach is to choose indicators that answer different questions.
For example:
EMA + RSI
EMA: What is the short-term trend?
RSI: How strong is the momentum?
This combination can help traders avoid taking momentum signals that go against the broader short-term direction.
VWAP + EMA
VWAP: Where is price relative to the session's volume-weighted average?
EMA: What is the short-term trend?
This can provide both an intraday reference and trend information.
EMA + Bollinger Bands
EMA: What is the short-term direction?
Bollinger Bands: How is volatility behaving?
This combination can be useful when traders want to distinguish between directional movement and volatility expansion.
RSI + Bollinger Bands
RSI: What is momentum doing?
Bollinger Bands: How far is price moving relative to recent volatility?
This can be useful for traders looking for short-term reversals or range conditions.
EMA + VWAP + RSI
For traders who want three different perspectives:
- EMA → trend
- VWAP → intraday price reference
- RSI → momentum
This gives each indicator a different job instead of having multiple indicators measuring essentially the same thing.
Best Indicator for Forex Scalping
For forex scalping, traders commonly use EMA, RSI, Bollinger Bands, ATR and other momentum or volatility tools.
A practical setup could use:
9 EMA + 21 EMA + RSI + ATR
The EMAs provide a short-term trend reference, RSI provides momentum information, and ATR gives an indication of current volatility.
However, the effectiveness of any setup depends on the currency pair, trading session, timeframe, market conditions and execution.
There is no universal indicator combination that guarantees profitable scalping.
Best Indicators for Gold Scalping
Gold can experience rapid price movements, making volatility particularly important for short-term traders.
A scalper may combine:
- EMA for trend
- VWAP for intraday reference
- RSI for momentum
- ATR for volatility
For example, a trader might use EMA to determine the short-term direction and ATR to understand whether the current market movement is large enough for the strategy being used.
Because gold can move quickly around major economic releases, traders should also consider the impact of news and spreads before entering short-term positions.
Best Timeframes for Scalping Indicators
Scalpers commonly use short timeframes such as:
- 1-minute
- 3-minute
- 5-minute
- 15-minute
The exact timeframe depends on the strategy.
A useful approach can be to use more than one timeframe.
Example
15-minute chart:
Identify broader short-term market direction.
5-minute chart:
Look for the setup.
1-minute chart:
Refine the entry.
Using multiple timeframes can help traders avoid interpreting a very short-term movement without considering the broader intraday context.
How to Use Indicators Without Overloading Your Chart
Adding more indicators does not necessarily produce better trading decisions.
For example, using:
- RSI
- Stochastic
- MACD
- CCI
- Williams %R
at the same time may provide several versions of similar momentum information.
Instead, consider giving each indicator a specific role.
A simple framework
1. Trend: EMA
2. Intraday reference: VWAP
3. Momentum: RSI
4. Volatility: ATR
This gives the trader four different types of information without unnecessarily filling the chart.
Indicators vs Price Action for Scalping
Indicators are mathematical calculations based on price, volume or both. They can help organize market information, but they should not replace an understanding of price action.
Scalpers may also consider:
- Support and resistance
- Market structure
- Higher highs and higher lows
- Lower highs and lower lows
- Breakouts
- Pullbacks
- Candlestick formations
- Liquidity
- Spread and execution conditions
For example, an RSI reading below 30 does not automatically mean a trader should buy. If the market is in a strong downtrend, momentum can remain weak for an extended period.
Using indicators alongside price structure can provide additional context.
Common Mistakes When Using Scalping Indicators
1. Using too many indicators
More indicators can create conflicting signals and make decision-making slower.
2. Treating indicators as guarantees
Indicators are analytical tools, not predictions that guarantee a particular market outcome.
3. Ignoring market conditions
An indicator can behave differently in:
- Trending markets
- Range-bound markets
- High-volatility markets
- Low-volatility markets
4. Ignoring transaction costs
Scalping involves frequent trades, so spreads, commissions and other costs can have a meaningful effect on results.
5. Using the same settings everywhere
An indicator configuration that works for one market or timeframe may not be appropriate for another.
6. Ignoring economic news
Major economic releases can create rapid price movements and wider spreads. Traders should understand how their strategy and trading provider handle news events.
7. Focusing only on entries
A scalping strategy also needs rules for:
- Stop-loss placement
- Position sizing
- Profit targets
- Maximum daily risk
- Trade frequency
- When to stop trading
How to Choose the Right Indicators for Your Scalping Strategy
Instead of asking which indicator is universally the best, consider what information your strategy is missing.
If you need trend information:
Consider EMA.
If you need an intraday reference:
Consider VWAP.
If you need momentum information:
Consider RSI or Stochastic.
If you need volatility information:
Consider ATR or Bollinger Bands.
If you want additional trend/momentum confirmation:
Consider MACD.
The goal is to build a simple system where every indicator has a clear purpose.
Example Scalping Indicator Setup
Here's a simple educational example:
Chart
5-minute timeframe
Indicators
- 9 EMA
- 21 EMA
- VWAP
- RSI
- ATR
Possible framework
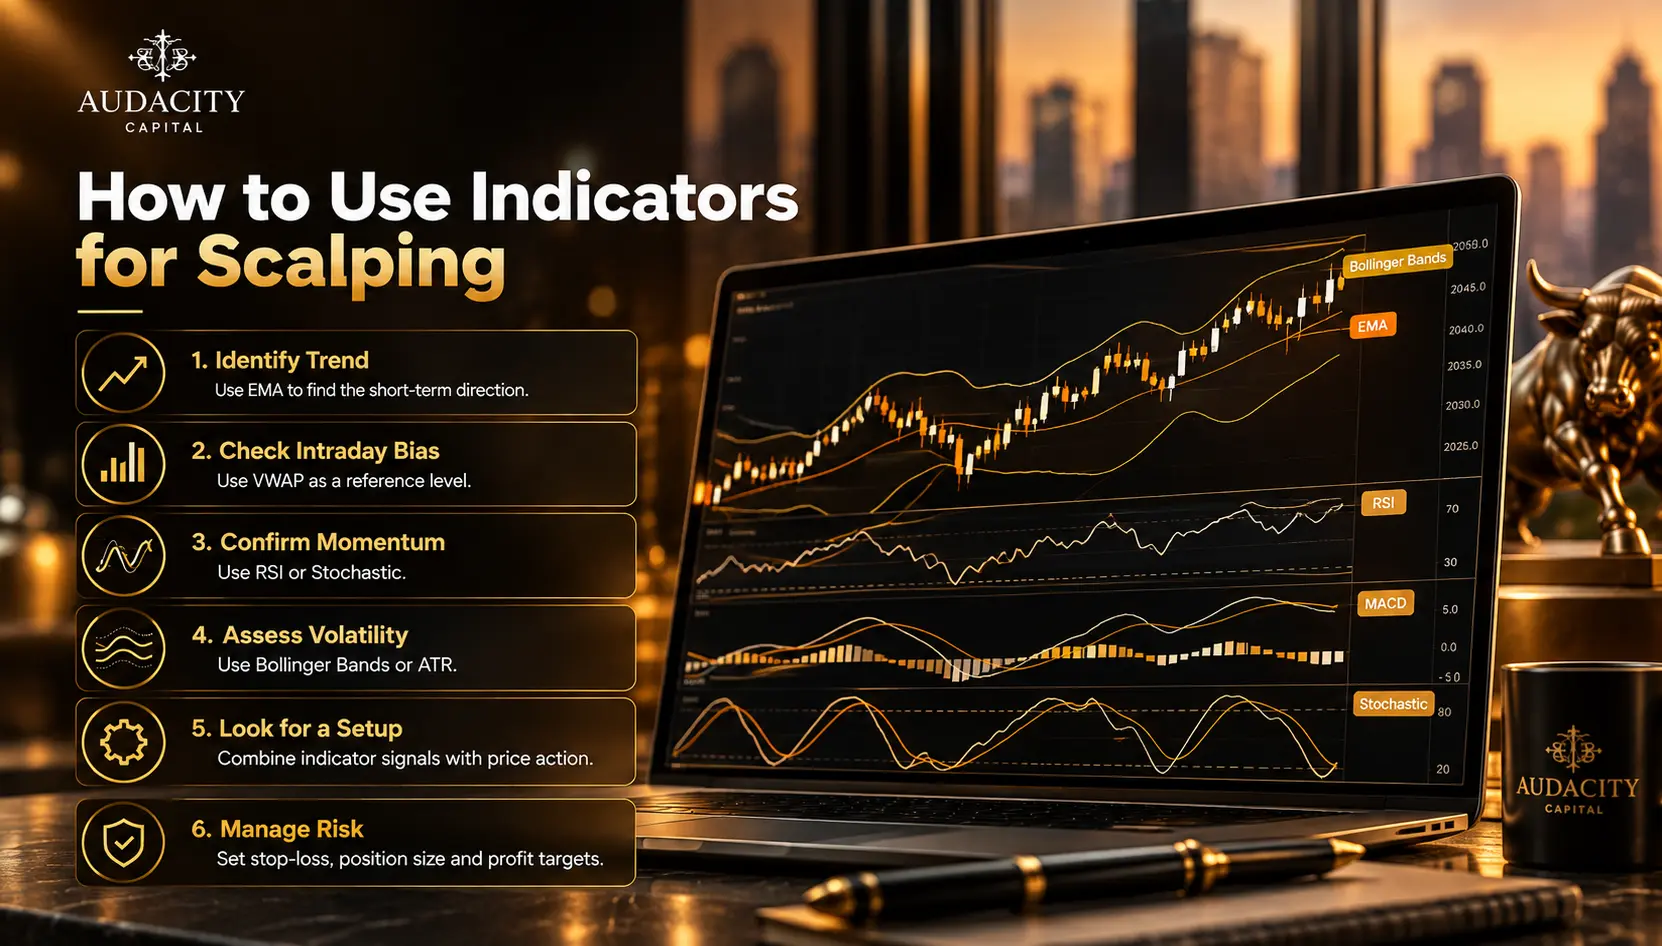
Step 1:
Use the 9 EMA and 21 EMA to identify the short-term direction.
Step 2:
Check price relative to VWAP for additional intraday context.
Step 3:
Use RSI to assess whether momentum supports the directional bias.
Step 4:
Check ATR to understand current volatility.
Step 5:
Use price action to identify the actual setup.
Step 6:
Define the maximum risk before entering.
This is an example of how indicators can work together. It is not a guaranteed trading strategy.
Scalping Indicators and Prop Firm Trading
For traders using a prop firm, technical indicators are only one part of the trading process.
A strategy also needs to operate within the firm's specific trading conditions.
Before using a scalping strategy, traders should check:
- Daily drawdown limits
- Maximum drawdown
- Position-size restrictions
- News trading rules
- Weekend holding rules
- EA or automated trading rules
- Copy-trading restrictions
- Trading-platform requirements
A strategy that works technically can still be unsuitable for a particular program if it conflicts with the firm's trading conditions.
For traders evaluating funded programs, understanding the rules and risk limits is therefore just as important as choosing indicators.
Final Takeaway
The most useful indicators for scalping are not necessarily the ones that generate the most signals. They are the ones that help a trader answer specific questions about the market.
EMA can help identify trend direction.
VWAP can provide an intraday price reference.
RSI can help assess momentum.
Bollinger Bands can show changes in volatility.
MACD can provide additional trend and momentum information.
ATR can help measure volatility and support risk planning.
Stochastic can help assess short-term momentum, particularly in range-bound conditions.
Rather than relying on a single indicator, traders can combine a small number of complementary tools with price action, market structure and disciplined risk management.
For prop traders, the technical setup is only part of the equation. The strategy also needs to fit the account's drawdown limits, trading restrictions and other program conditions.
Frequently Asked Questions
There is no single indicator that is best for every scalper. EMA, VWAP, RSI, Bollinger Bands and ATR each provide different information about trend, price, momentum and volatility. The most suitable combination depends on the trader's strategy and market.
For very short-term strategies, traders may use fast EMAs, VWAP, RSI or volatility indicators such as ATR. Because 1-minute charts contain more market noise, traders should also consider spreads, execution speed and transaction costs.
RSI can be useful for assessing short-term momentum and identifying potential momentum shifts. However, overbought and oversold readings should not automatically be treated as buy or sell signals.
Yes, EMA can help scalpers identify short-term trends because it gives more weight to recent price data. Shorter EMAs are often used when traders want a more responsive trend reference.
VWAP can provide an intraday reference for price relative to the volume-weighted average. It can be particularly useful for markets where reliable volume data is available.
There is no fixed number. A simple setup with two to four indicators can be easier to interpret than a chart filled with overlapping signals. Each indicator should have a specific purpose.
No. Indicators are analytical tools and cannot guarantee profitable trades. Market conditions, execution, transaction costs, risk management and strategy discipline all affect trading outcomes.

Pronto para aplicar risco disciplinado em cripto? Explore os novos instrumentos de cripto da Audacity Capital e traga sua estratégia de trading.
Saiba MaisNewsletter
Junte-se ao nosso boletim para ficar atualizado.
Junte-se à Nossa Comunidade Social

Comece Sua Jornada Hoje Com Nosso Teste Gratuito
Mostre com orgulho suas habilidades e conquistas através de certificados e obtenha reconhecimento pelo seu trabalho árduo e dedicação de potenciais investidores e colegas.
Teste Gratuito