


Order Flow Imbalance: How to Read Buy and Sell Pressure



A highlighted cell on a footprint chart appears like a verdict: the buyer won, so the price should continue to increase. This is where the majority of new order flow traders go wrong.
The phrase order flow imbalance refers to three different measures: executed trades, resting orders and a quantitative market-microstructure measure.
This guide distinguishes them, covers up with the exact examples, and builds up a practical workflow. It is only for learning purposes and trading involves risk of loss.
What Is Order Flow Imbalance
Order flow imbalance is the difference between buying pressure and selling pressure that occurs over a brief time period, or at a price level. The inputs are dependent on the tool.
A footprint chart usually compares executed aggressive volume and a depth ladder reveals resting liquidity which may move or disappear.
There is never a one-sided execution, as each one matches up a buyer with a seller. It's all about who is making the spread. The bid is the highest price that a buyer is willing to pay and the ask is the lowest price that a seller is willing to take.
Aggressive buying is when a market order raises the offer price. Aggressive selling is when a market order hits the bid. Limit orders act passively at these levels and provide the other half of the match.
When there is one aggressor dominating, the outcome is an executed volume imbalance, although every trade is two-sided.
Take the signal as proof of what has occurred or what is displayed at that instant and not what will happen next. Whether the signal is effective for your trading concept relies on price action, market level, liquidity, and follow-through, or additional move after the signal.
Three Meanings of Order Flow Imbalance
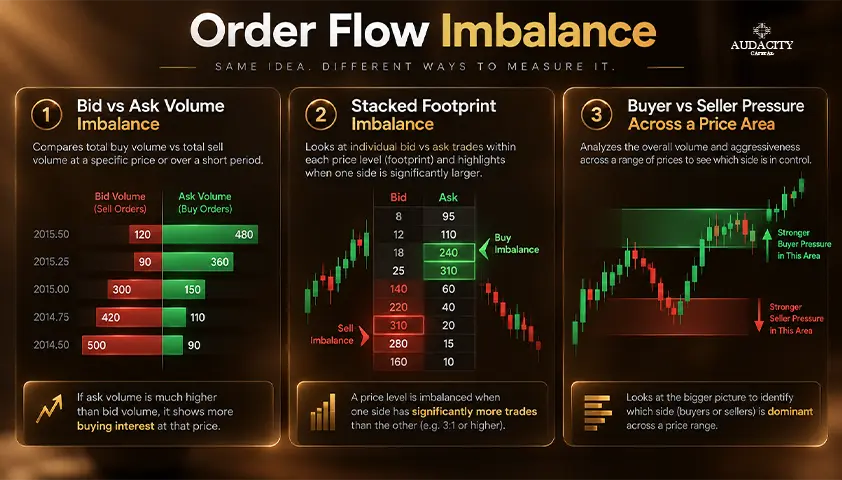
In trading education, one word is used for three distinct but related measures. The third one is called order flow imbalance (OFI) by researchers. The table is used as a guide throughout this article.
Term | What it measures | Typical tool | Main limitation |
Footprint imbalance | Executed bid and ask volume at adjacent price levels, usually shown as a ratio. | Footprint or volumetric bar | Describes completed aggression but not the entire resting book. |
Order book imbalance | Displayed bid size versus displayed ask size at one or more levels. | Depth of market (DOM) ladder, Level II or heatmap | Orders could be moved, cancelled, hidden or refreshed before being executed. |
Quantitative OFI | Net changes at the best bid and ask from limit orders, market orders and cancellations. | Event-level market data and code | Data intensive and not the same as a colored footprint cell. |
The quantitative measure is based on market microstructure research. Cont, Kukanov and Stoikov attributed the short-interval price changes to the changes in supply and demand at best quotes.
That's academic data about a particular calculation, not evidence that a retail footprint threshold has a reliable forecasting advantage.
This article will concentrate on the footprint imbalance that many platforms refer to as a buy-sell imbalance or bid-ask imbalance. Order book imbalance only comes as context, and each change between the two names identifies the source of the data.
How Footprint Imbalances Are Calculated
The footprint graph segments each bar by price level and displays the volume of the execution by the bid, to the left, and ask, to the right.
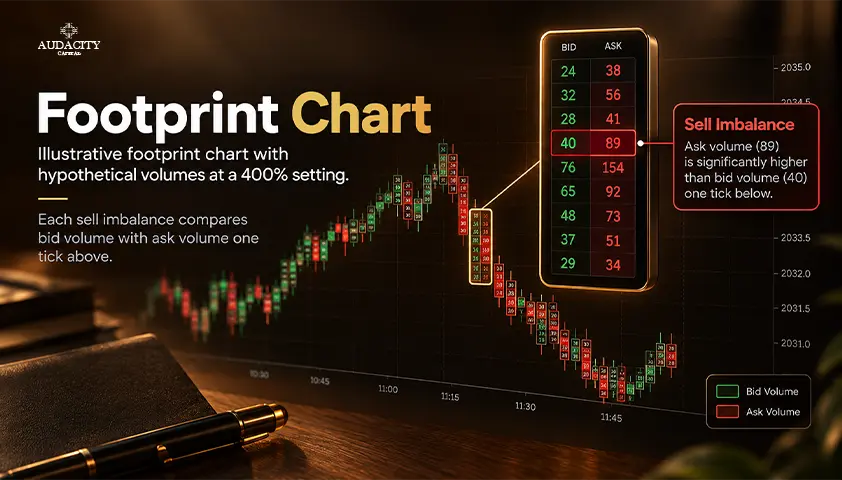
An imbalance ratio is based on the diagonal comparison. A buy imbalance is when the ask volume at a price is compared to the bid volume at the price one tick lower.
A sell imbalance occurs when the bid volume at one price level is compared to the ask volume at one price level higher.
The diagonal represents the auction that has taken place across the spread i.e., buyers who are buying at one price level are contrasted with sellers who are resting one tick below.
Never compare the bid and ask volumes at the same price, unless the trading platform provides this calculation. The hypothetical examples below assume a 400% setting, or 4 times the comparison volume.
Other sites display the same figure as a 4-to-1 ratio. Verify the zero volume settings and action prior to repeating any calculation.
Example | Lower-price bid | Higher-price ask | Calculation | Reading |
Buy side | 80 at 4501.00 | 320 at 4501.25 | 320 divided by 80 equals 4.0 | 400 percent buy imbalance |
Sell side | 360 at 4500.75 | 90 at 4501.00 | 360 divided by 90 equals 4.0 | 400 percent sell imbalance |
The percent ratio is an adjustable user input and not a rule set by the market. According to TradingView, the default rate is 300%, meaning that one side is three times the other.
Test the threshold on the same instrument, feed, aggregation and session that you plan to trade on. The higher the ratio, the fewer the number of highlights but not necessarily the better indicators. All order flow imbalance indicators work differently with different data feeds.
One of the necessary price levels is an individual imbalance. A Stacked Imbalance is when the same side of the market is involved in multiple qualifying prices in succession. There is no universally accepted number of stacks, as platforms and educators vary.
Same-side price levels indicate focused aggression, but not a continued attack or support and resistance. That is the key concept in reading an imbalance on a footprint chart.
How to Read Buy and Sell Imbalances
First, location. Note the price at a prior session high or low, a range high or low, or a volume profile level or breakout zone prior to the start of the session. An unbalanced zone in the middle of a noisy volume should be disregarded.
Next, watch the response. In case of a buy imbalance and price acceptance above that level, it might indicate an initiative-buyer read.
In case of a sell imbalance and price drop, it may mean just the opposite. Use conservative language since the print does indicate aggression and not the identity or motive of the participant.
Absorption is the other case. When there seems to be aggressive buying but no movement in price, passive sellers could be absorbing the buying pressure.
The matching liquidity is assumed from the lack of response, as a footprint does not tell who the seller is. Use the mirror principle in aggressive selling when it can't sink below support.
The volume delta is the difference between the ask volume and bid volume of the bar. The total volume delta is referred to as cumulative delta at each bar. Both provide context, whether it is at a bar level and session level, although neither indicates price levels the way imbalances do.
Before taking any action, run a quick checklist:
- The location was known in advance.
- The imbalance is bigger than the limit that you have tested.
- The price moves as expected.
- The next bar confirms or denies the read.
- There is an invalidation level close by.
Do not add any indicators if there is some contradictory information.
How to Use Order Flow Imbalance in a Trade Plan
Order flow imbalance trading is best used in a sequence not in response to colour:
- Record the higher time frame (or session) location.
- Select a data feed, footprint setting and trigger.
- Wait for the order flow imbalance and price reaction to be settled.
- Set the entry, stop and target points prior to placing an order.
- Calculate position sizing with regard to the desired loss and stop distance.
- Screenshot your work and remember the outcome.
Continuation Setup
Same-side imbalances occur when a known price and level is taken and are typically displayed in a breakout or pullback. Define acceptance with a rule, e.g. close and hold outside the level and do not enter when cells become green or red.
Reversal Setup
When a known extreme fails there are three parts to the failed auction: volume prints are aggressive, price does not move further in the direction of the failed extreme, and a confirmation occurs on the other side.
Some traders call this stall exhaustion, but only when the price is not moving in the positive direction. Never combine absorption and imbalance. Heavy buying at a high is not necessarily bearish, and heavy selling at a low is not necessarily bullish.
Execution Discipline
Consider whether to employ a market, limit, or stop order, and be prepared to handle any uncertain fills. A stop order might be filled away from its price due to shifting liquidity in the marketplace.
In the case of DOM orders, the available liquidity on the order ladder may have been consumed by the time your order reaches it.
Order Flow Imbalance Trade Example
This is a hypothetical example of an exchange-traded instrument. Price moves to a higher level in the previous session at 4500.00.
The buy imbalance is created at the higher high, but the bar retraces back down below 4499.75. The next bar displays three consecutive sell imbalances and then closes below the rejection bar.
In this example, the trader goes short at 4499.50, following the confirmation of the lower trade. The planned stop is at 4501.00 which is above the known extreme. The target is a previously marked support level at 4496.50.
The price risk is 1.50 points and the potential gain is 3.00 points (2R before costs). One R is the expected loss in the trade.
The table shows the two possible outcomes from the same decision.
Item | Target reached first | Stop reached first |
Entry | 4499.50 | 4499.50 |
Planned stop | 4501.00 | 4501.00 |
Planned target | 4496.50 | 4496.50 |
Illustrative exit | 4496.50 | 4501.00 |
Gross result | +2R | -1R |
The example excludes fees, spread and slippage, and it assumes fills at the displayed prices. The reward ratio is indicative and not the mandatory goal. One example does not say anything about win rate or profitability.
Order Flow Imbalance Across Markets
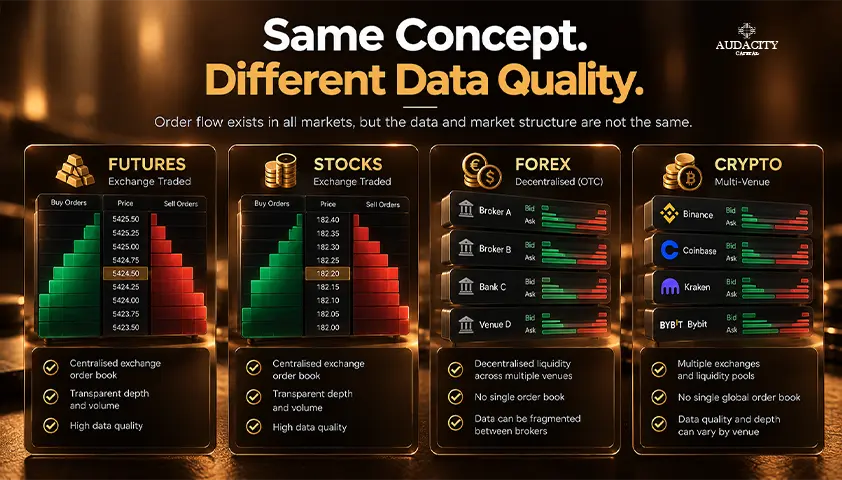
Order flow imbalance readings are as accurate as the data they are based on and this data varies across markets.
Futures and exchange-traded stocks.
Centralized exchanges may provide exchange tick-by-tick information and order book data depending on your subscription and depth. Information from one exchange does not mean liquidity on all the other exchanges where the asset is traded.
Crypto.
Specify the exchange and the contract. The spot pair and the perpetual contract will trade with different order books and flows. Aggregation tools pool several venues according to their own rules, therefore none of them shows the total picture of the crypto market.
Spot forex and CFDs.
There are no centrally traded order books for these instruments. MetaTrader 5 platform provides a tick volume metric, which measures the number of price updates rather than trading volume. Available order depth is symbol and provider specific.
A related currency futures footprint is an independent instrument and must be marked as such.
For comparison of results, specify the same instrument, feed, session, aggregation settings and the imbalance threshold. A threshold validated for futures is not necessarily valid for forex, stocks or crypto.
Common Order Flow Imbalance Mistakes and Risks
Most errors come from treating a highlight as a decision. Watch for these:
- Entering on every highlight.
- Confusing footprint imbalance with order book imbalance.
- Ignoring the price response.
- Changing thresholds after a loss.
- Reading a completed bar with hindsight.
- Using data that omits the bid and ask classification the method needs.
Displayed liquidity deserves extra care. Resting orders can be modified or canceled at any time. Spoofing is the deliberate placement of orders intended for cancellation before execution.
Ordinary cancellation is also part of a changing market. One DOM snapshot cannot reveal intent, so do not label every vanishing order as manipulation.
Test any order flow trading strategy before trusting it. Record the level, setting, feed, trigger, entry, stop, target and screenshot before the outcome is known.
Include skipped and losing signals. Run unchanged rules on another period and include costs. Compare average net outcome and drawdown alongside win rate.
Choose size from the planned loss and stop distance. If volatility, thin liquidity or an unclear invalidation level makes the loss hard to define, skip the trade. Order flow detail does not remove gap, slippage or execution risk.
Conclusion
Choose one liquid instrument, one feed and one imbalance definition. Then replay twenty examples at premarked levels and record both follow-through and failure. The goal is to test a decision rule, not to collect colorful chart signals.
For display mechanics, read Audacity's footprint chart guide. For resting liquidity, use the DOM guide. For transaction sequence, see the tape reading guide.
Frequently Asked Questions
No. A footprint or order book imbalance is based on trade or liquidity data. A fair value gap is a three-candle price pattern. Retail traders may call both imbalances, so name the measurement rather than rely on the word.
It can describe short-horizon pressure, but no isolated reading guarantees direction. The same aggressive volume can precede continuation or meet absorption. Location, subsequent price response, liquidity and tested rules determine how a trader interprets it.
Positive delta means more aggressive volume executed at the ask than at the bid over the measured interval. If price fails to advance, it can point to absorption rather than buyer control. Delta also aggregates a whole bar, while footprint imbalances identify particular price levels.
It depends on the broker or data provider. Standard forex volume may be tick volume rather than centralized traded volume, and displayed depth represents only the available feed. Verify the symbol's data before interpreting a footprint or DOM as the whole market.

Ready to apply disciplined risk to crypto? Explore Audacity Capital's new crypto instruments and bring your trading strategy.
Learn MoreNewsletter
Join our newsletter to stay up to date on features and releases.
Join Our Social & Community

Start Your Journey Today With Our Free Trial
Proudly showcase your skills and accomplishments through certificates and get recognition for your hard work and dedication from potential investors and peers.
Free TrialRelated Articles

Market Profile Trading: How to Read TPO Charts
Learn Market Profile Trading with TPO charts, value area, POC, initial balance, day types, practical examples, and risk controls.

Turtle Soup Trading: Rules, Examples and ICT Variations
Learn turtle soup trading with original rules, ICT variations, bullish and bearish examples, risk controls, and a practical backtesting checklist.
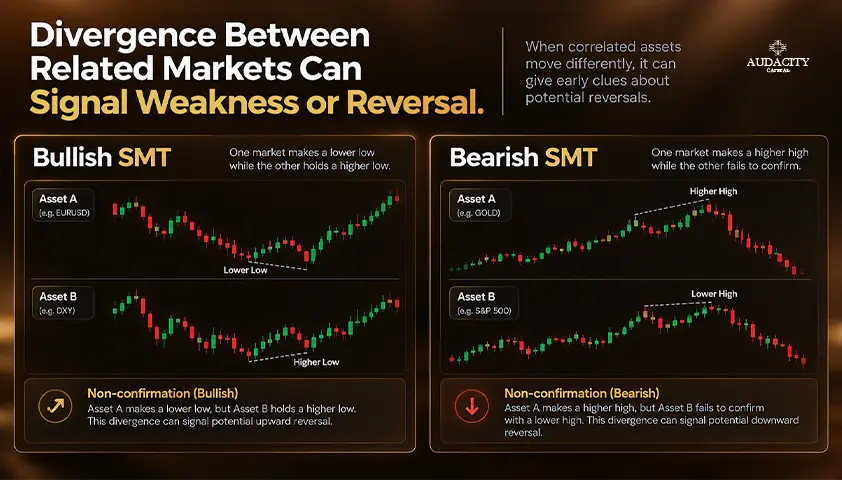
SMT Divergence in Trading: Bullish and Bearish Examples
Learn what SMT divergence means, how bullish and bearish setups form, which markets traders compare, and how to confirm signals and manage risk.
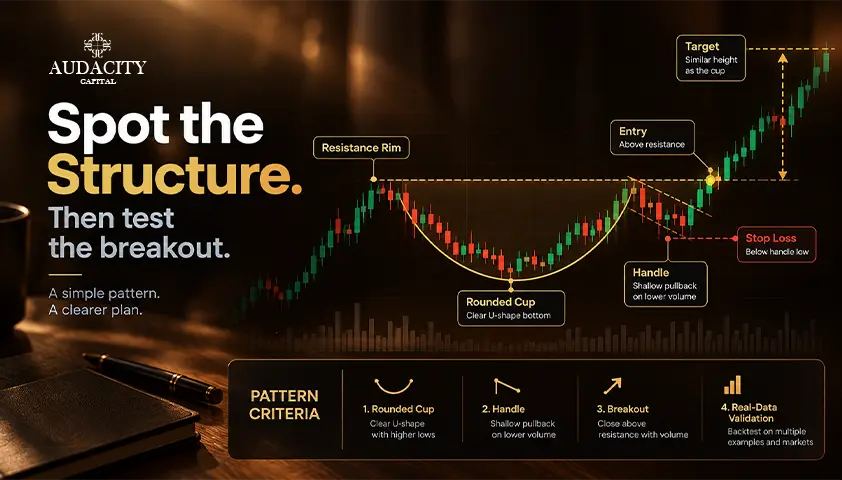
Cup and Handle Pattern: Criteria, Entry and Real Data
The cup and handle pattern explained: the criteria sources disagree on, how to trade it, and what the performance data actually says.