


Prop Firm Pass Rate: What Percentage Actually Get Funded?



There is no independently audited, industry-wide prop firm pass rate. The strongest public benchmarks suggest a minority of evaluation attempts reach a funded stage, commonly in the single digits to mid-teens.
But the number shifts sharply depending on whether the source counts accounts, people, phases, or repeat attempts.
Two credible reference points illustrate the gap.
FPFX Technology data reported by Finance Magnates found about 14% of evaluations passed and roughly 7% of all traders received a payout.
Topstep's 2025 disclosure showed 16.8% of initiated Trading Combines completed, while 51.8% of individual participants advanced at least once after one or more attempts.
Both numbers are correct. The first counts every attempt, the second counts whether a person eventually succeeded.
Key Takeaway
- No audited universal industry pass rate exists.
- Credible cross-firm data centers around 14% of accounts reaching funding.
- Only a fraction of funded traders then receive a payout.
- Always ask what the denominator counts before believing any percentage.
What Is the Average Prop Firm Pass Rate?
A defensible directional range for evaluation attempts is roughly 5% to 15%.
But again, that is not an audited industry average. It is the band public disclosures tend to fall within when the metric is clearly defined.
Building a true average is hard because firms differ on almost everything that matters: profit targets, drawdown types, time limits, permitted strategies, one-step versus two-step structure, futures versus forex combines, and even the definition of "funded."
Many firms publish total payouts or success stories without the attempt count or unique-trader base needed to calculate a rate.
There is also a difference between first-attempt probability and eventual trader success.
A trader can fail four evaluations and pass the fifth. That produces a 20% account-level pass rate, but a successful unique trader. Any headline prop firm success rate that ignores this distinction will mislead.
The commonly repeated claim that "90% of traders fail" is an estimate, not a verified statistic. The source-specific evidence below is more useful.
"Pass Rate" Can Mean Several Different Things

Before comparing numbers, define the metric. The same firm can report very different results depending on which of the following it publishes.
1. Evaluation-account pass rate
Successful evaluation account completions divided by all evaluation accounts started. Repeat attempts are counted separately, so this metric penalizes traders who buy multiple accounts.
2. Unique-trader pass rate
The percentage of individual people who eventually pass at least once, even when they use multiple repeat attempt purchases or a challenge reset. This is almost always higher than the account-level number.
3. Phase-completion rate
The percentage clearing a single phase. A strong Phase 1 pass rate is not the same as the full two-step completion rate. Phase 2 verification must be cleared separately.
4. Funded-account survival rate
The percentage retaining a funded account for a defined period, such as 30, 90, or 180 days. This measures funded-account survival, not just whether a trader crossed the finish line once.
5. Payout rate
The percentage receiving at least one payout. Always check whether the denominator is all buyers or only funded participants, because the two produce very different payout rate figures.
6. Live-capital transfer rate
The percentage moved from a simulated funded account to a live funded account where capital is exposed to real market execution. Many programs remain simulated end to end.
7. Net-profitable trader rate
The percentage whose total withdrawals exceed challenge, reset, activation, and subscription costs over a defined period. This is the metric closest to real net profitability.
The search phrase "actually get funded" usually points to full evaluation completion. Readers often care more about first payout and long-term profitability, which are lower still.
What the Best Public Data Actually Shows?
The cleanest way to read the numbers is to keep populations separate.
The table below gives the source, period, population, and metric for each disclosure, so nothing gets averaged that should not be averaged.
Source | Period | Population | Metric | Result | Limitation |
FPFX Technology, via Finance Magnates | Multi-firm sample | 300,000+ accounts, ~100,000 traders, 10 firms | Accounts reaching funded stage | ~14% | Not an audited industry census |
FPFX Technology, via Finance Magnates | Same sample | All traders in dataset | Traders receiving a payout | ~7% | ~45% of passers, per source |
Topstep 2025 disclosure | 2025 | Initiated Trading Combines | Prop firm challenge pass rate (account level) | 16.8% | Futures program only |
Topstep 2025 disclosure | 2025 | Individual participants | Participant advanced at least once | 51.8% | Person-level, not account-level |
Topstep 2025 disclosure | 2025 | Funded-level participants | Received a payout | 33.3% | Different denominator from 16.8% |
Topstep 2025 disclosure | 2025 | Express Funded participants | Moved to Live Funded Account | 0.71% | Live-capital transfer, narrow subset |
The Funded Trader, via Finance Magnates | Firm disclosure | Clients | Completed challenge | ~1 in 20 | Firm-specific, single model |
ATFunded monthly funnel | Monthly cohort | Evaluation traders | Phase 1 to Phase 2 | 22.6% | Short-period disclosure |
ATFunded monthly funnel | Monthly cohort | Phase 2 traders | Reached funded status | 26.9% | Combined funnel ~6% |
Business Insider on Topstep | 2024 | Combines | Reached funding | 12.4% | Different year, different wording |
Business Insider on Topstep | 2024 | Funded traders | Received a payout | 28.3% | Different year, different wording |
One rule prevents almost every misreading: never multiply Topstep's 16.8% account-level completion by its 33.3% funded-participant payout rate.
The denominators do not match. The same rule applies to every dataset above.
Why Prop Firm Pass-Rate Claims Conflict?
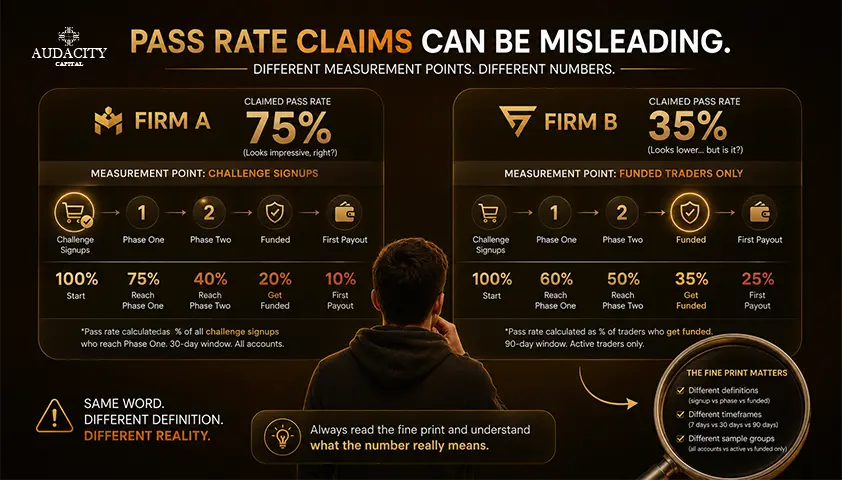
When two firms publish very different pass rates, the difference is usually in the definition, not the difficulty.
1. Account versus person: One participant may create several failed accounts before one pass. Account-level and participant-level data produce different rates from the same activity.
2. Started versus active: Some sources include every purchase. Others count only accounts that placed at least one trade.
3. Phase versus full evaluation: A high Phase 1 rate can still produce a low combined two-step completion rate.
4. Program type: One-step, two-step, instant funding, and futures combines test different behaviors. They deserve separate reporting rather than one brand-wide number.
5. Simulated versus live: Some firms use "funded" for a performance account that remains simulated. Live-capital transfer is a separate event.
6. Cohort timing: Traders who reached funding late in a reporting window may not yet have been eligible for a payout during that window.
7. Self-reported versus audited: Most figures come from firms, technology providers, or trade publications. Definitions are not standardized. Account-level data disclosures are still the exception, not the norm.
Why Most Prop Firm Challenge Attempts Fail?
Failure is not only psychological. Several structural factors combine to lower the pass rate.
Reason #1: No measured edge.
Evaluations add a profit target and breach thresholds to a strategy that may already be unprofitable after spreads, commissions, and slippage. A trader without documented strategy expectancy is paying to discover the shortfall.
Reason #2: Advertised size hides the real risk budget.
A $100,000 label often carries a much smaller maximum drawdown and daily loss limit. Sizing from the label rather than the remaining buffer is a common breach source.
Reason #3: Path dependence.
Two traders with identical long-run statistics can produce different results when one begins with a losing sequence and hits a hard breach before the edge has time to recover.
Reason #4: Target pressure changes behavior.
Traders raise risk per trade, overtrade, or take setups outside the tested plan when progress feels slow.
Reason #5: Correlated positions.
Three "small" trades in correlated instruments can become one concentrated account bet.
Reason #6: Non-P&L rules.
News windows, holding restrictions, a consistency rule, prohibited strategies, automation rules, or minimum trading days can fail an otherwise profitable account.
Reason #7: Post-pass risk inflation.
Some traders change behavior after reaching funded status and breach before satisfying payout conditions.
No single reason explains a fixed percentage of failures unless the source publishes that breakdown, which most do not.
How Evaluation Rules Change the Probability of Passing?
A lower target does not automatically mean an easier evaluation. Rules interact.
1. Profit target versus maximum loss: An 8% target against a 10% static drawdown creates a different path than a 6% target against a 6% trailing drawdown.
2. Daily loss limit: Even when overall drawdown is generous, one volatile day can end the evaluation.
3. Static versus trailing thresholds: A trailing floor can rise with equity and shrink the room available after a winning streak.
4. One-step versus two-step: One-step removes a phase but often uses tighter limits or a higher fee. Two-step splits the target across two paths but requires both to succeed.
5. Time limits and minimum days: Removing a deadline reduces forced trading. Minimum profitable-day or consistency requirements can slow qualification.
6. Strategy fit: News, weekend, EA, scalping, and copy-trading permissions can move the effective probability for a specific strategy even when the headline target is identical.
Rule | How it changes the path | Who is most affected | What to verify |
Fixed floor, room stays constant | Swing traders with variable equity | Whether it is end-of-day or intraday | |
Floor rises with profit or equity | Traders who scale up after wins | High-water calculation method | |
Daily loss limit | Ends the day early on outsized losses | Volatile-session and news traders | Whether it is balance or equity based |
Caps single-day contribution to total | Traders with one large winning day | Exact percentage and reference base | |
Minimum days | Delays qualification | Fast scalpers and short-horizon systems | Whether trades must be profitable |
A firm like Audacity Capital, for example, offers two-step (Ability Challenge), one-step (Ability One), and instant-funding (FTP) routes.
Each tests different behavior and would need to be reported separately for a meaningful pass rate. Rolling all three into a single number would obscure more than it explains.
Getting Funded Is Not the Same as Getting Paid
The funded-stage rate is higher than the payout rate because a passed evaluation is only the first gate. Traders still need to keep the account alive, generate qualifying profit, and satisfy payout terms.
Using the FPFX dataset carefully: about 14% of accounts reached funding, and about 7% of all traders reached a payout.
Roughly 45% of those who passed received a payout in that specific dataset.
Using Topstep separately: 33.3% of funded-level participants received a payout in 2025. Those two payout figures are not directly comparable because the denominators differ.
Funding does not always convert to a payout because of funded-stage drawdown breaches, insufficient qualifying profit, minimum-day or consistency requirements, conduct review, or reaching funding too late in the measurement window.
And a single payout does not prove profitability. A trader can withdraw once but still spend more on challenge fees, resets, activations, and subscriptions than the payout amount.
How to Estimate Your Own Chances More Honestly
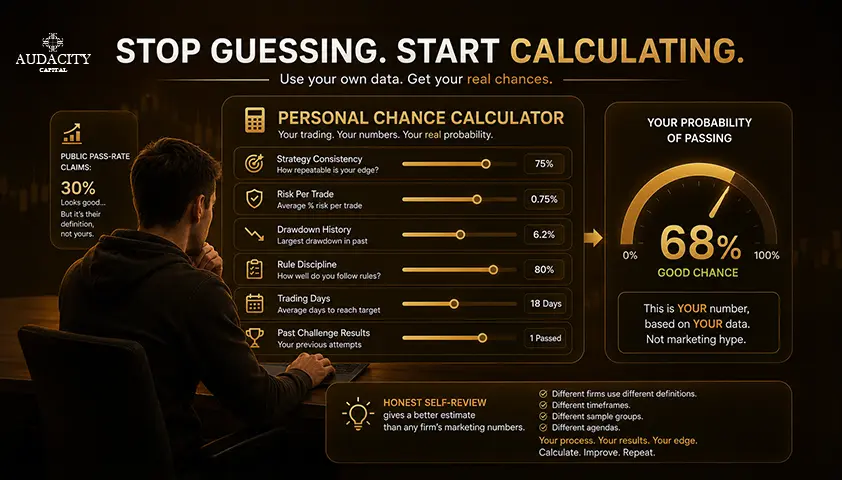
No simple calculator produces a personalized pass probability. But traders can build a defensible estimate with the right inputs.
1. Use realized data, not hoped-for numbers.
Win rate, average winner, average loss, historical drawdown, losing-streak distribution, trade frequency, correlated exposure, spreads, commissions, and slippage. If those numbers do not exist yet, the evaluation is not the right next step.
2. Map the strategy to the exact rules.
Simulate the profit target, daily limit, maximum drawdown, minimum days, reset windows, and prohibited conditions. Backtesting profit alone is not enough.
3. Handle repeat-attempt math carefully.
If the probability of passing one independent attempt is 10%, the probability of at least one pass across three independent attempts is 1 − 0.9³, or 27.1%. Real attempts are not statistically independent.
A trader may improve, change risk, or repeat the same mistake. That figure is educational, not a plan.
4. Cost the route before buying.
Multiply attempt cost by a realistic number of attempts, then add reset, activation, and subscription costs. If the total is not affordable, the route is not affordable.
How Traders Can Improve Their Odds Without Chasing the Statistic
The most useful question is not "what is the average pass rate," but "which avoidable failure points can I remove."
- Prove the strategy on enough trades to estimate expectancy and drawdown before paying for an evaluation.
- Match the rule set to the strategy's holding period, event exposure, automation, and typical drawdown.
- Size positions from the breach threshold and stop distance, not from the advertised account value.
- Set a personal daily stop inside the firm's official limit to preserve room for floating loss, costs, and slippage.
- Measure combined risk across correlated positions.
- Avoid artificial deadlines when the program has no time limit.
- Read funded-stage and payout conditions before buying, not after passing.
- Track every fee and every withdrawal so a single payout is not mistaken for overall profit.
Conclusion
Public data suggests that only a minority of evaluation attempts reach funded status, with directional benchmarks commonly in the single digits to mid-teens.
The strongest cross-firm dataset reported about 14% of accounts reaching funding and 7% of all traders receiving a payout. Topstep's 2025 disclosure shows how repeat attempts can lift the unique-trader rate to more than half while the per-account prop firm pass rate stays near 16.8%.
Before accepting any pass-rate claim, apply the denominator test. Does it count accounts or people? One phase or the full process? Funding or payout? Simulated or live capital? Same year or different years?
Statistics describe populations. They do not predict an individual result.
Understanding what a percentage actually measures is more useful than memorizing the percentage itself.
Frequently Asked Questions
No universal audited rate exists, but source-specific data points to a first attempt pass rate in the low teens or lower. The FPFX Technology dataset reported roughly 14% of accounts reaching funding across a large multi-firm sample, and single-firm disclosures often sit below that.
First-attempt-only rates are typically lower than overall account rates because they exclude traders who eventually pass on a later try.
The unique-trader rate is almost always higher than the account-level rate. Topstep's 2025 disclosure reported that 51.8% of individual participants advanced at least once after one or more evaluations, compared with a 16.8% per-combine completion rate. That gap is the account-versus-person distinction, and it is why "how many traders get funded" cannot be answered with a single number.
The what percentage of funded traders get payouts answer depends entirely on the denominator. Topstep's 2025 disclosure reported 33.3% of funded-level participants received a payout. FPFX Technology reported that about 45% of passers received a payout, equal to roughly 7% of all traders in that sample. These are different populations and should not be averaged.
Not automatically. One-step removes a phase but often uses tighter drawdown, a higher fee, or additional funded-stage conditions. Two-step distributes the target across two phases but requires both to be cleared. The right structure depends on the strategy, not the label.
Usually because the metric or denominator is different. A firm reporting participant-level, phase-only, or eventual-pass rates will show higher numbers than one reporting per-account, full-evaluation rates. Neither is dishonest by default, but the two are not comparable.
There is no reliable public evidence that account size changes the pass rate for a given ruleset. Larger accounts often carry the same percentage-based targets and drawdowns, so the statistical path is similar. Sizing errors and rule breaches are the more consistent drivers of failure.
Yes. A profitable strategy can still fail on daily loss limits, trailing drawdown, consistency rules, minimum-day requirements, prohibited strategies, or path-dependent losing sequences. Long-run profitability and short-horizon evaluation rules test different things.
No. Most available figures come from firms, technology providers, or trade publications. Definitions are not standardized, and there is no industry-wide audit that covers every retail prop firm. Read every percentage with the source, year, population, metric, and denominator attached.

Ready to apply disciplined risk to crypto? Explore Audacity Capital's new crypto instruments and bring your trading strategy.
Learn MoreNewsletter
Join our newsletter to stay up to date on features and releases.
Join Our Social & Community

Start Your Journey Today With Our Free Trial
Proudly showcase your skills and accomplishments through certificates and get recognition for your hard work and dedication from potential investors and peers.
Free TrialRelated Articles

10 Best Prop Trading Firms in Malaysia in 2026
Compare the 10 best prop trading firms in Malaysia for 2026, ranked on swap-free accounts, payout speed, fees, and payments that work from Malaysia.

Can You Hold Trades Overnight or Over the Weekend on a Prop Firm?
Can you hold trades overnight or over the weekend on a prop firm? Learn the rules, risks, gap exposure, and which prop firms allow swing trading.

Instant Funding vs the Challenge: Which Funded Account Should You Choose?
Two routes to a funded account, one honest comparison. See how instant funding vs challenge differ on cost, drawdown, and profit split, and which route fits you.
What Is Take Profit in Trading? A Detailed Guide for Traders
Learn what a take profit is, how to set one well using technical levels, risk-reward, and ATR, plus partial profits, trailing stops, and a funded-trader lens.